| Param | Original file | Final file |
|---|---|---|
| Filename | modeM0/AS1G05_234T02_9000000474_03636cztM0_level2.evt | modeM0/AS1G05_234T02_9000000474_03636cztM0_level2_quad_clean.evt |
| Size (bytes) | 462,375,360 | 83,721,600 |
| Size | 441.0 MB | 79.8 MB |
| Events in quadrant A | 3,166,076 | 520,571 |
| Events in quadrant B | 3,910,252 | 514,067 |
| Events in quadrant C | 3,134,729 | 515,036 |
| Events in quadrant D | 3,319,068 | 500,636 |
| Mode M9 | |||
|---|---|---|---|
| Quadrant | BADHDUFLAG | Total packets | Discarded packets |
| A | 0 | 8 | 0 |
| B | 0 | 8 | 0 |
| C | 0 | 8 | 0 |
| D | 0 | 9 | 0 |
| Mode SS | |||
|---|---|---|---|
| Quadrant | BADHDUFLAG | Total packets | Discarded packets |
| A | 0 | 142 | 0 |
| B | 0 | 142 | 0 |
| C | 0 | 142 | 0 |
| D | 0 | 142 | 0 |
| Mode M0 | |||
|---|---|---|---|
| Quadrant | BADHDUFLAG | Total packets | Discarded packets |
| A | 0 | 14437 | 3 |
| B | 0 | 16479 | 2 |
| C | 0 | 14381 | 2 |
| D | 0 | 15002 | 2 |
| Quadrant | Total seconds | Saturated seconds | Saturation percentage |
|---|---|---|---|
| A | 6959 | 40 | 0.574795% |
| B | 6959 | 73 | 1.049001% |
| C | 6959 | 17 | 0.244288% |
| D | 6959 | 67 | 0.962782% |
Noise dominated data is calculated using 1-second bins in cleaned event files. If a bin has >2000 counts, and if more than 50% of those come from <1% of pixels, then it is considered to be noise-dominated and hence unusable.
| Quadrant | # 1 sec bins | Bins with >0 counts | Bins with >2000 counts | High rate bins dominated by noise | Noise dominated (total time) | Noise dominated (detector-on time) | Marked lightcurve |
|---|---|---|---|---|---|---|---|
| A | 7599 | 6960 | 2 | 2 | 0.03% | 0.03% | 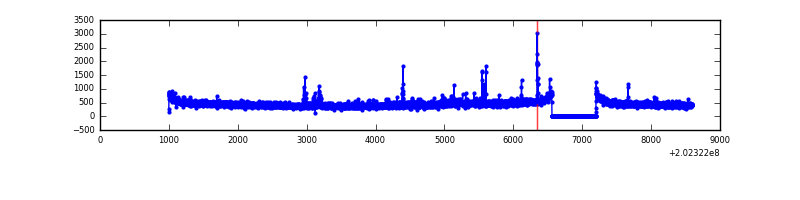 |
| B | 7599 | 6960 | 7 | 7 | 0.09% | 0.10% | 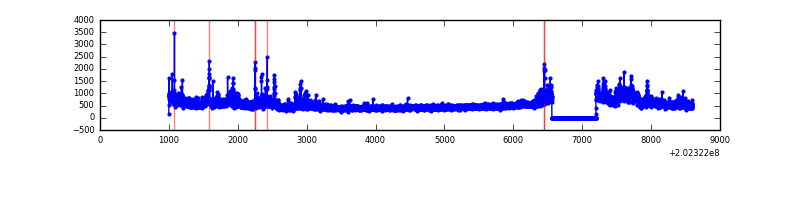 |
| C | 7599 | 6960 | 0 | 0 | 0.00% | 0.00% | 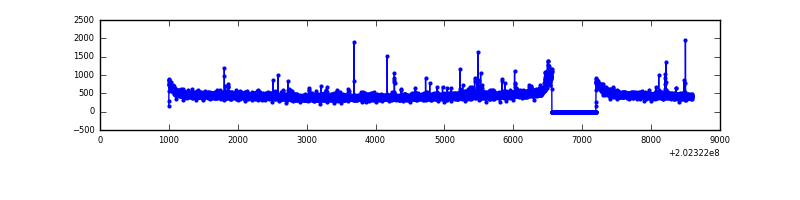 |
| D | 7599 | 6960 | 48 | 48 | 0.63% | 0.69% | 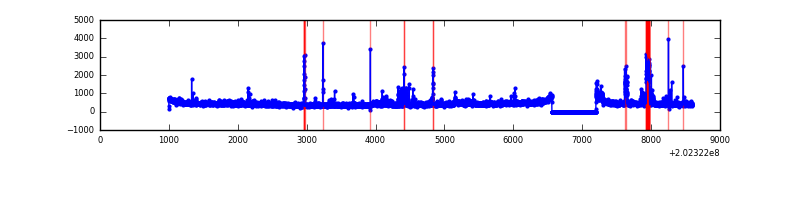 |
Top three noisy pixels from each quadrant. If the there are fewer than three noisy pixels in the level2.evt file, extra rows are filled as -1
| Pixel properties | Quadrant properties | ||||||
|---|---|---|---|---|---|---|---|
| Quadrant | DetID | PixID | Counts | Sigma | Mean | Median | Sigma |
| A | 7 | 16 | 54978 | 332.53 | 789 | 770 | 163.0 |
| A | 0 | 50 | 22666 | 134.32 | 789 | 770 | 163.0 |
| A | 8 | 160 | 14224 | 82.53 | 789 | 770 | 163.0 |
| B | 15 | 204 | 483999 | 3136.17 | 796 | 775 | 154.1 |
| B | 5 | 172 | 57930 | 370.94 | 796 | 775 | 154.1 |
| B | 4 | 81 | 57583 | 368.69 | 796 | 775 | 154.1 |
| C | 2 | 53 | 69731 | 379.75 | 774 | 778 | 181.6 |
| C | 9 | 247 | 18200 | 95.95 | 774 | 778 | 181.6 |
| C | 1 | 16 | 10327 | 52.59 | 774 | 778 | 181.6 |
| D | 13 | 46 | 154029 | 821.11 | 770 | 747 | 186.7 |
| D | 2 | 37 | 49013 | 258.55 | 770 | 747 | 186.7 |
| D | 13 | 239 | 36643 | 192.29 | 770 | 747 | 186.7 |
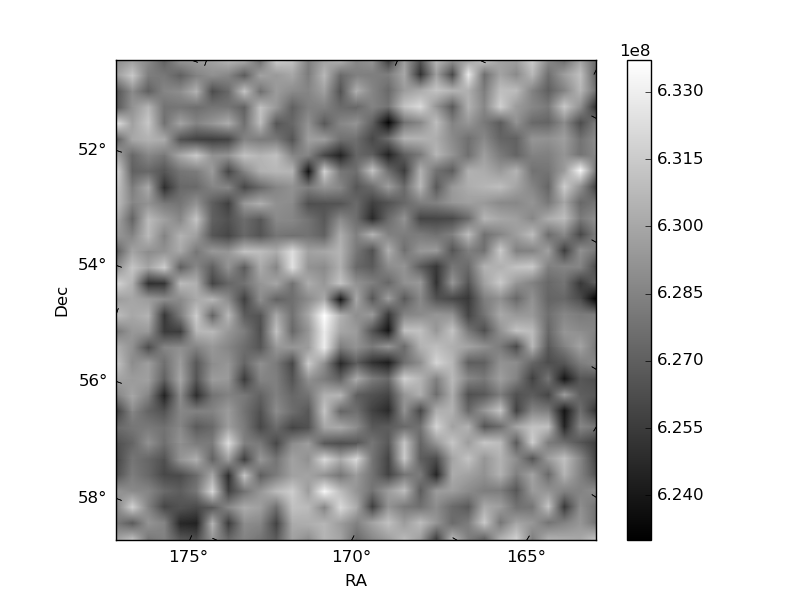
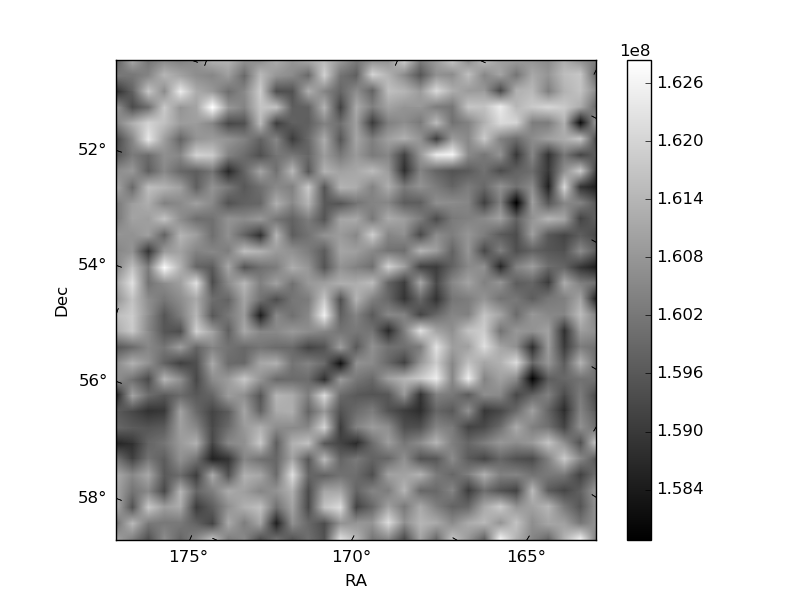
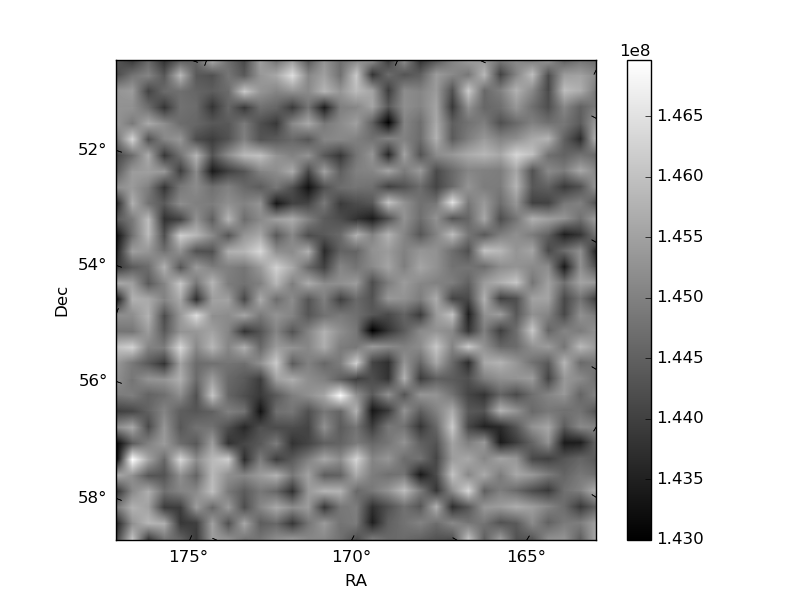
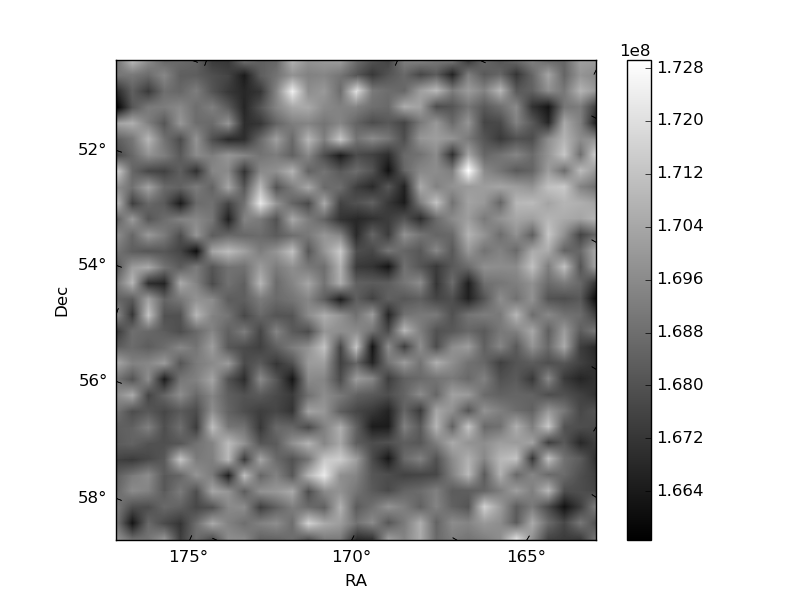
Histogram calculated using DETX and DETY for each event in the final _common_clean file
| Quadrant A | 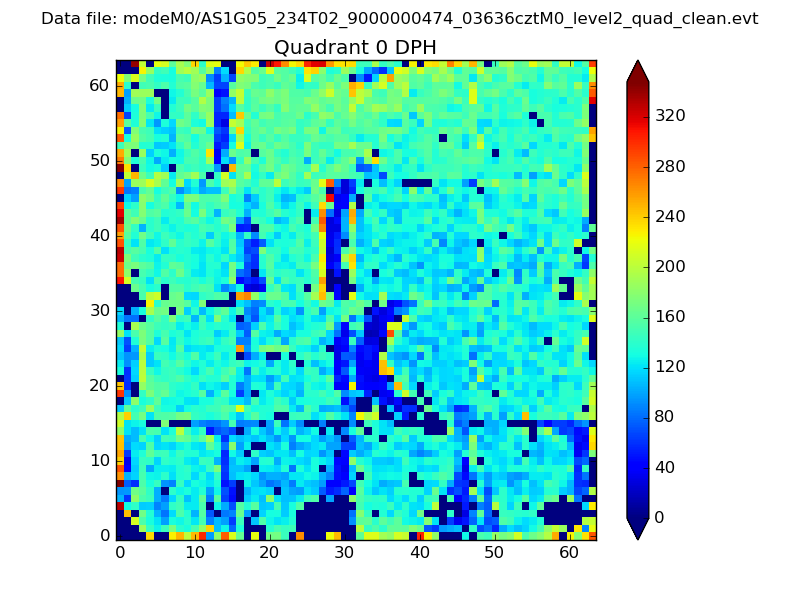 |
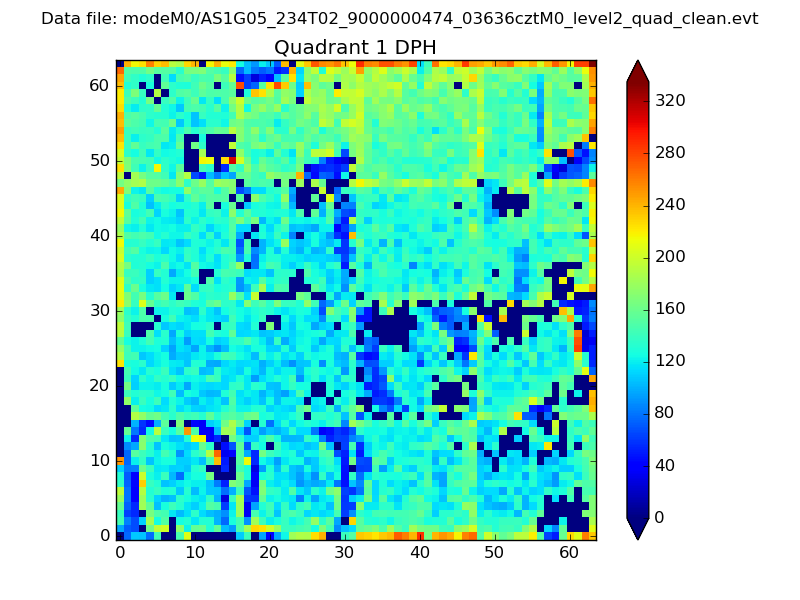 |
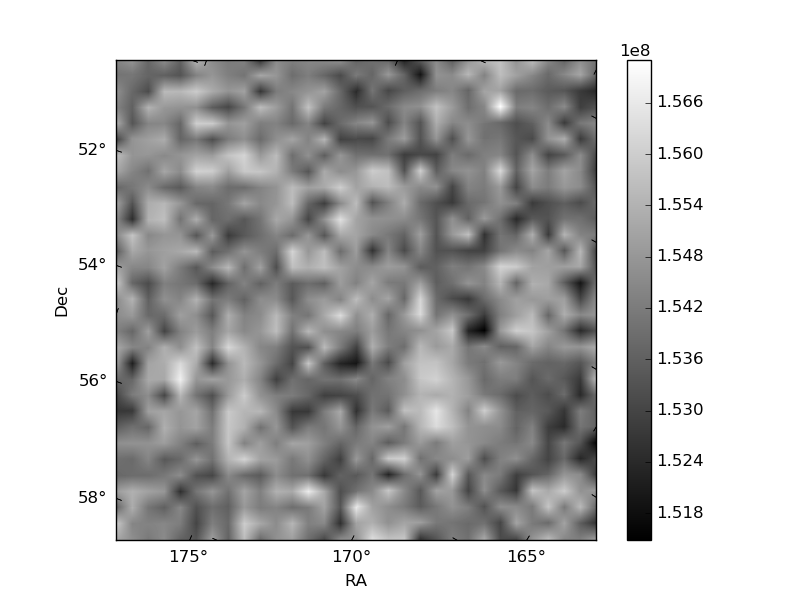
Quadrant B |
|---|---|---|---|
| Quadrant D | 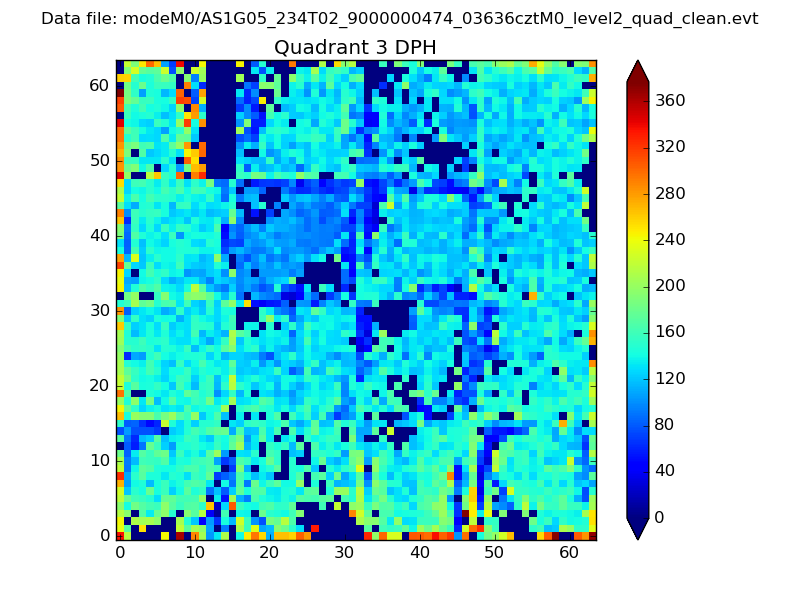 |
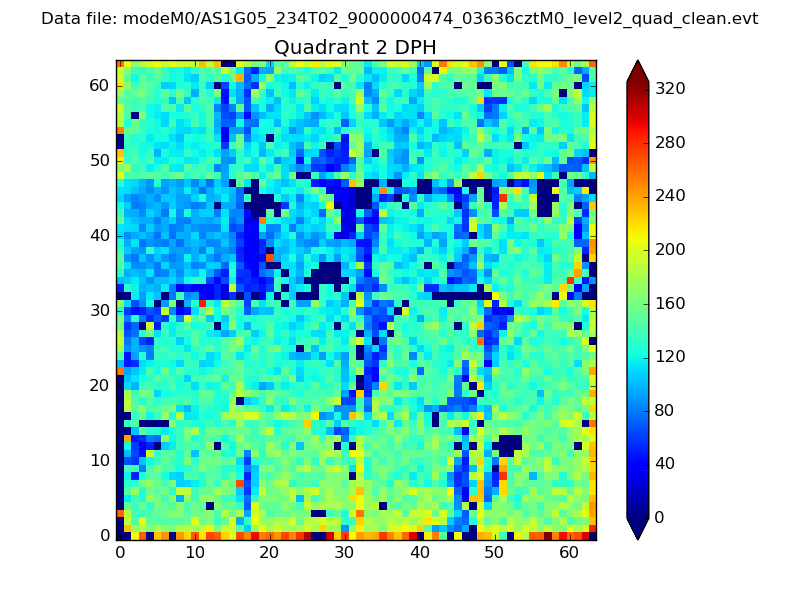 |
Quadrant C |
| Plot type | Count rate plots | Images |
|---|---|---|
| Comparison with Poisson distribution Blue bars denote a histogram of data divided into 1 sec bins. Red curve is a Poisson curve with rate = median count rate of data. |
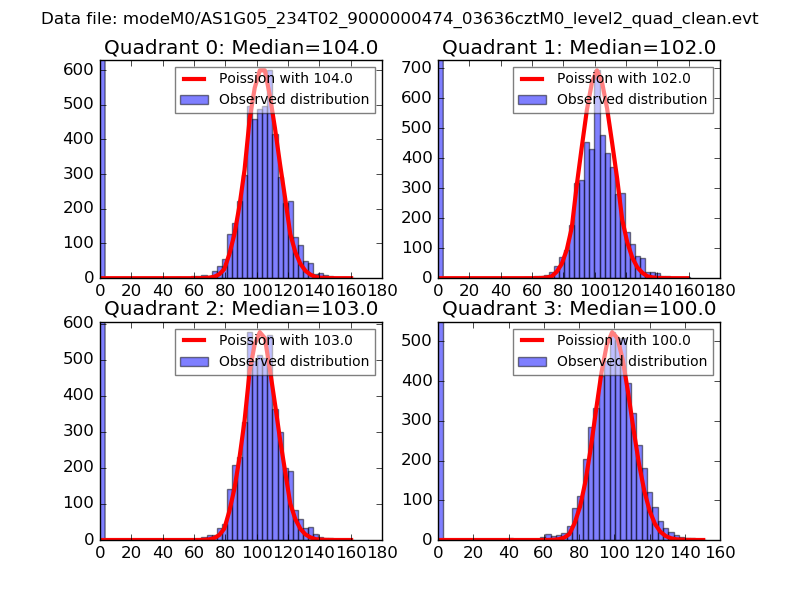 |
 |
| Quadrant-wise count rates Data is divided into 100 sec bins |
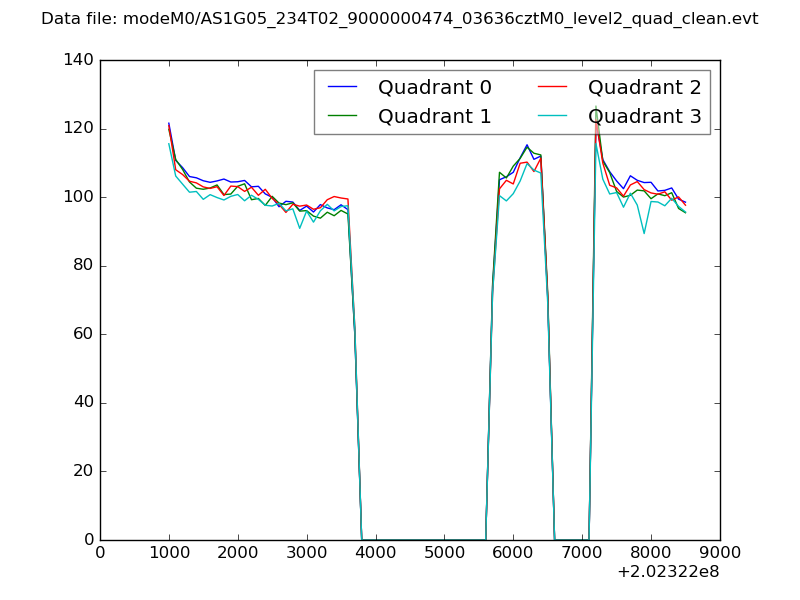 |
|
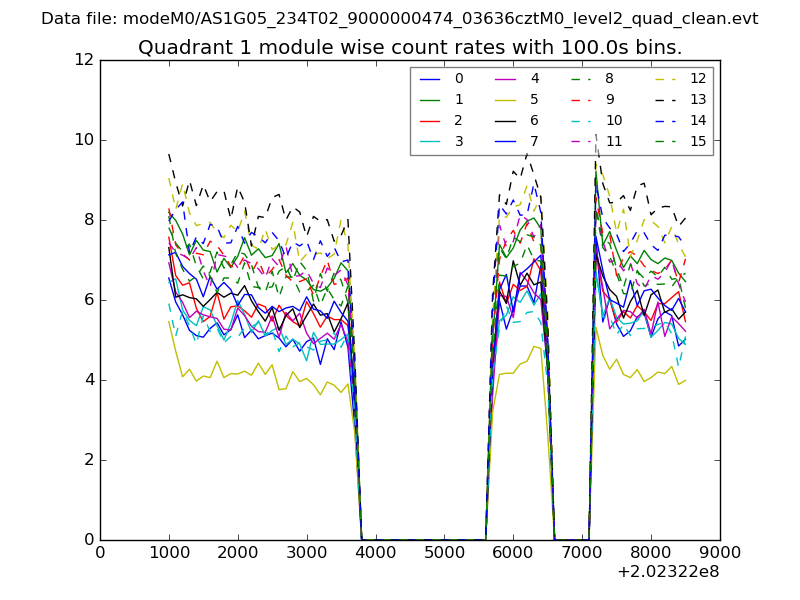
| Module-wise count rates for Quadrant A Data is divided into 100 sec bins |
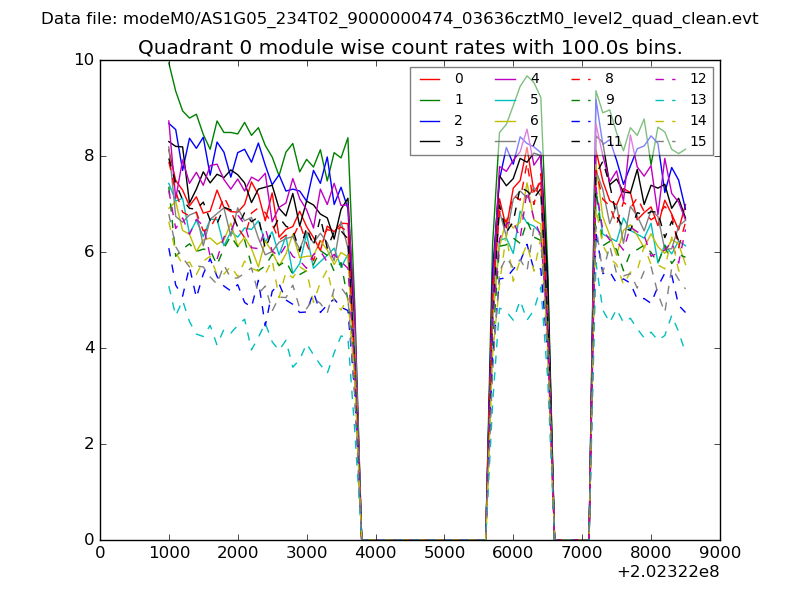 |
 |
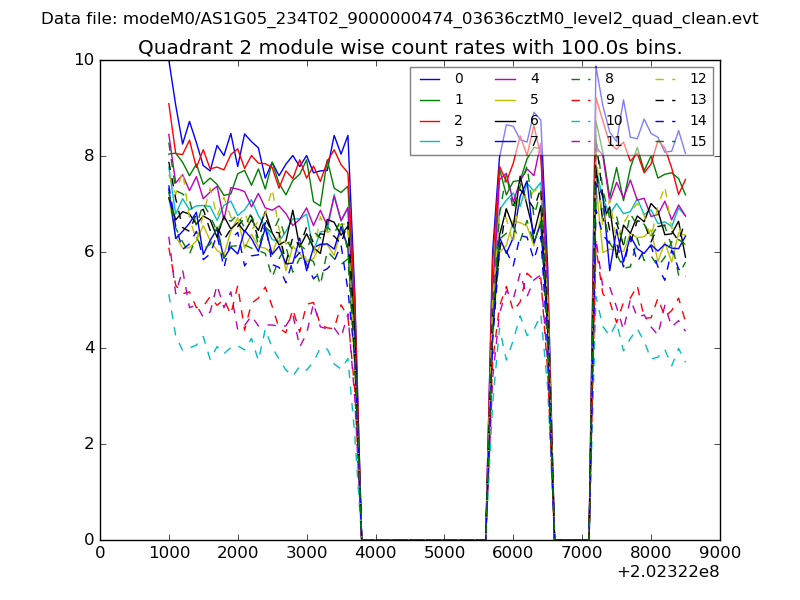
| Module-wise count rates for Quadrant B Data is divided into 100 sec bins |
 |
 |
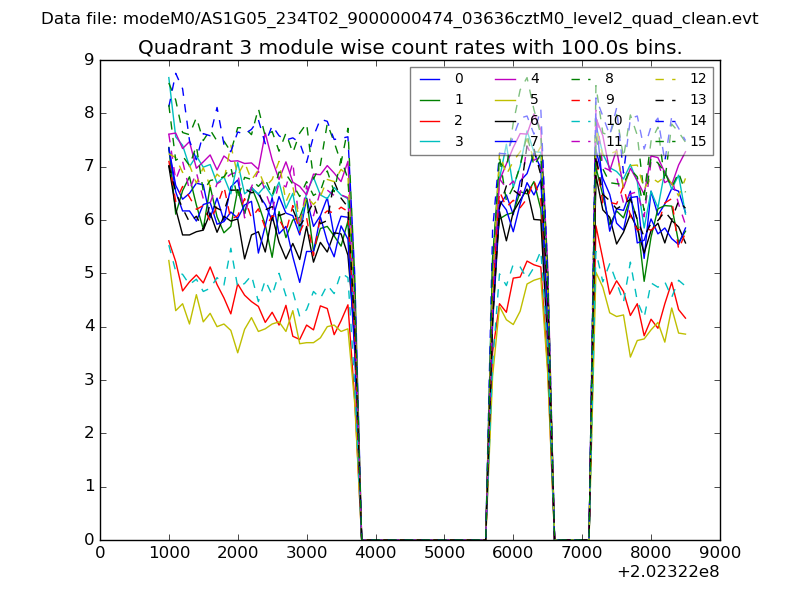
| Module-wise count rates for Quadrant C Data is divided into 100 sec bins |
 |
 |
| Module-wise count rates for Quadrant D Data is divided into 100 sec bins |
 |
 |
| Parameter | Plot |
|---|---|
| CZT HV Monitor | 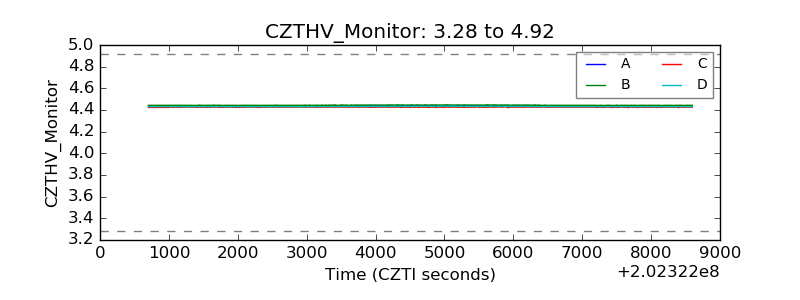 |
| D_VDD | 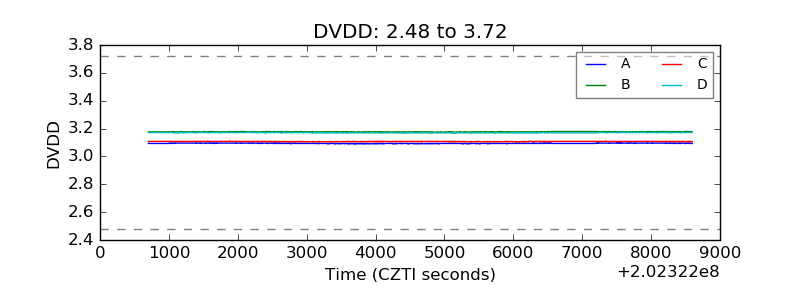 |
| Temperature 1 | 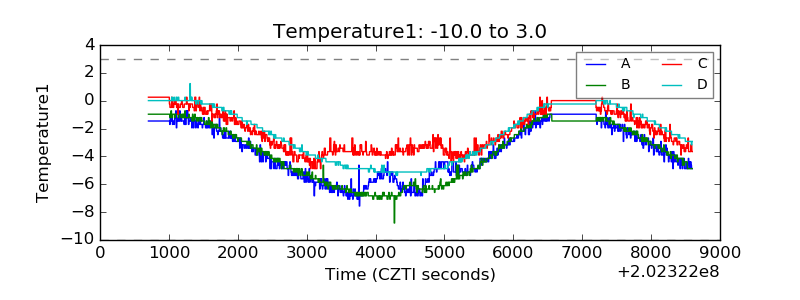 |
| Veto HV Monitor | 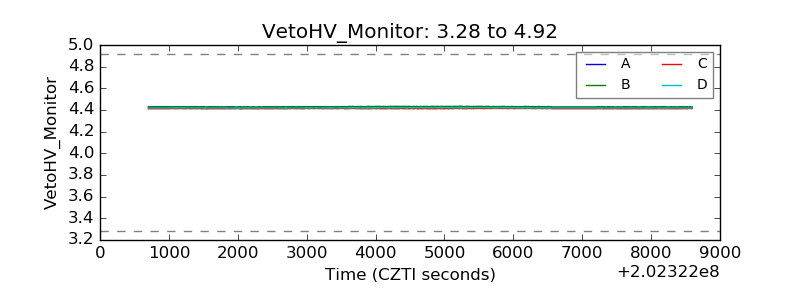 |
| Veto LLD | 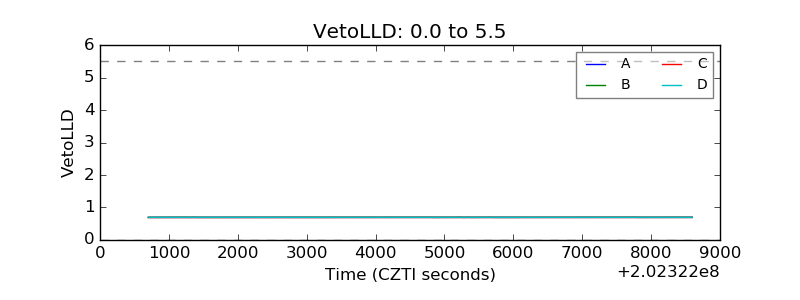 |
| Alpha Counter | 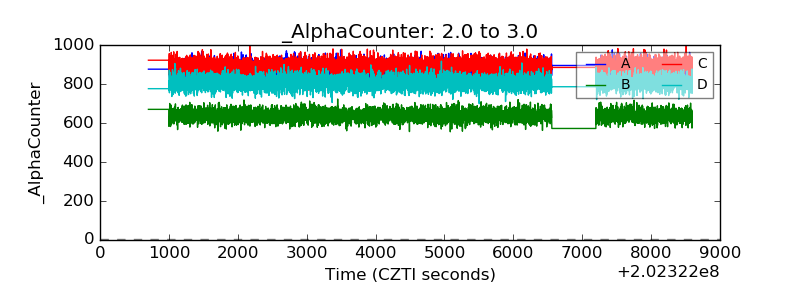 |
| _CPM_Rate | 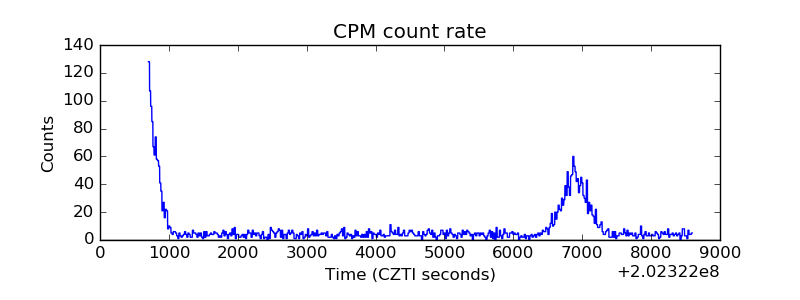 |
| CZT Counter | 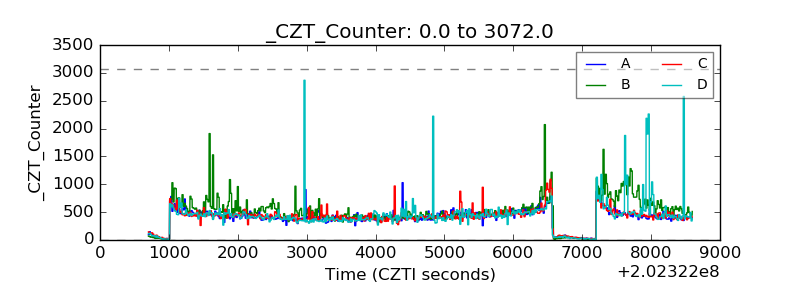 |
| +2.5 Volts monitor | 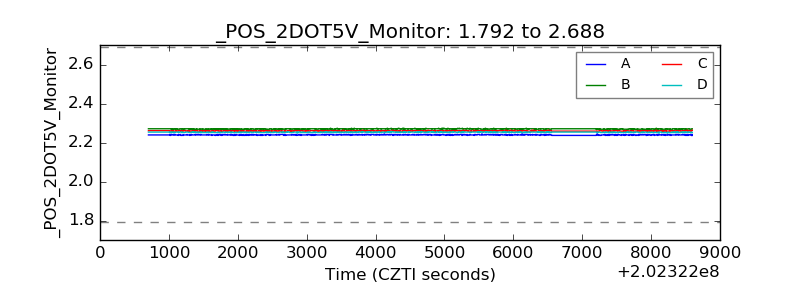 |
| +5 Volts monitor |  |
| Veto Counter | 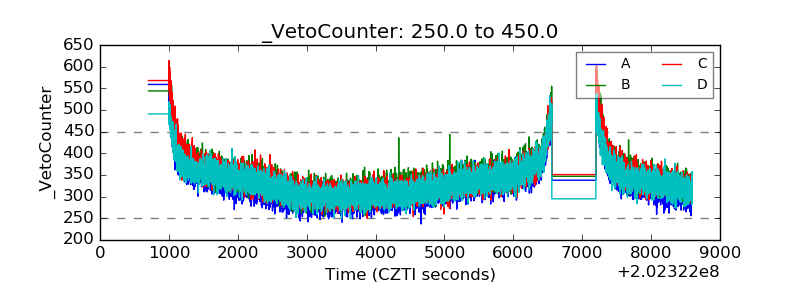 |