| Param | Original file | Final file |
|---|---|---|
| Filename | modeM0/AS1G05_234T02_9000000474_03637cztM0_level2.evt | modeM0/AS1G05_234T02_9000000474_03637cztM0_level2_quad_clean.evt |
| Size (bytes) | 509,978,880 | 89,821,440 |
| Size | 486.4 MB | 85.7 MB |
| Events in quadrant A | 3,418,973 | 557,122 |
| Events in quadrant B | 4,221,538 | 552,548 |
| Events in quadrant C | 3,762,927 | 551,518 |
| Events in quadrant D | 3,538,075 | 542,855 |
| Mode M9 | |||
|---|---|---|---|
| Quadrant | BADHDUFLAG | Total packets | Discarded packets |
| A | 0 | 3 | 0 |
| B | 0 | 3 | 0 |
| C | 0 | 3 | 0 |
| D | 0 | 3 | 0 |
| Mode SS | |||
|---|---|---|---|
| Quadrant | BADHDUFLAG | Total packets | Discarded packets |
| A | 0 | 150 | 0 |
| B | 0 | 150 | 0 |
| C | 0 | 150 | 0 |
| D | 0 | 150 | 0 |
| Mode M0 | |||
|---|---|---|---|
| Quadrant | BADHDUFLAG | Total packets | Discarded packets |
| A | 0 | 15683 | 2 |
| B | 0 | 17689 | 1 |
| C | 0 | 16565 | 1 |
| D | 0 | 16011 | 1 |
| Quadrant | Total seconds | Saturated seconds | Saturation percentage |
|---|---|---|---|
| A | 7414 | 98 | 1.321824% |
| B | 7414 | 80 | 1.079040% |
| C | 7414 | 53 | 0.714864% |
| D | 7414 | 62 | 0.836256% |
Noise dominated data is calculated using 1-second bins in cleaned event files. If a bin has >2000 counts, and if more than 50% of those come from <1% of pixels, then it is considered to be noise-dominated and hence unusable.
| Quadrant | # 1 sec bins | Bins with >0 counts | Bins with >2000 counts | High rate bins dominated by noise | Noise dominated (total time) | Noise dominated (detector-on time) | Marked lightcurve |
|---|---|---|---|---|---|---|---|
| A | 7689 | 7415 | 58 | 58 | 0.75% | 0.78% | 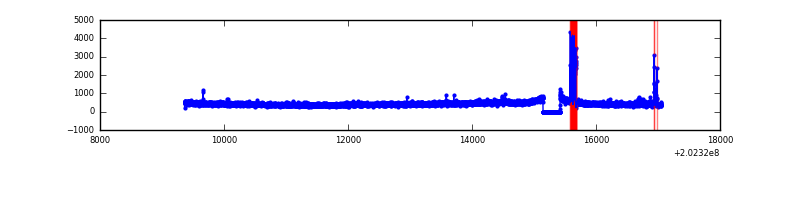 |
| B | 7689 | 7415 | 3 | 3 | 0.04% | 0.04% | 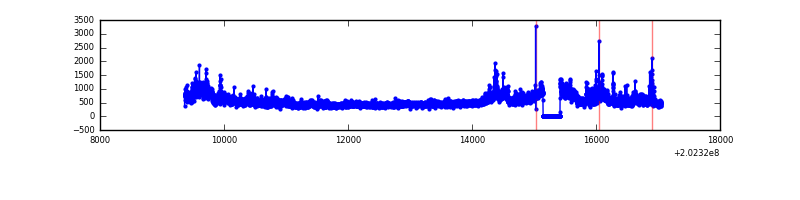 |
| C | 7689 | 7415 | 31 | 31 | 0.40% | 0.42% | 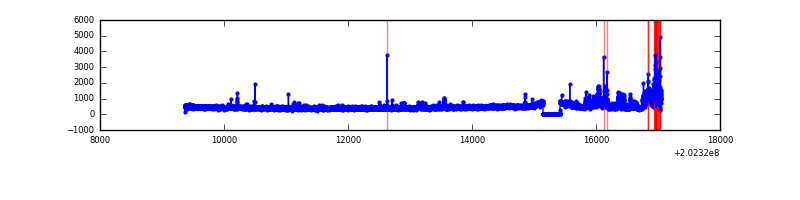 |
| D | 7689 | 7415 | 47 | 47 | 0.61% | 0.63% | 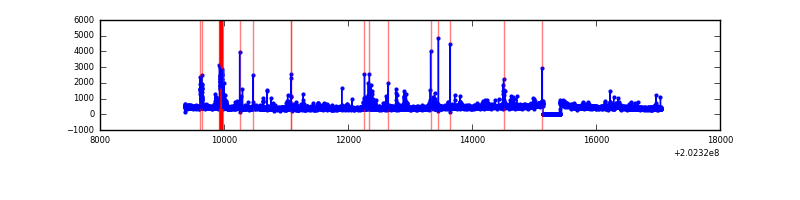 |
Top three noisy pixels from each quadrant. If the there are fewer than three noisy pixels in the level2.evt file, extra rows are filled as -1
| Pixel properties | Quadrant properties | ||||||
|---|---|---|---|---|---|---|---|
| Quadrant | DetID | PixID | Counts | Sigma | Mean | Median | Sigma |
| A | 0 | 149 | 157263 | 918.71 | 826 | 806 | 170.3 |
| A | 0 | 50 | 23342 | 132.33 | 826 | 806 | 170.3 |
| A | 0 | 226 | 23225 | 131.64 | 826 | 806 | 170.3 |
| B | 15 | 204 | 684804 | 4192.76 | 842 | 819 | 163.1 |
| B | 14 | 167 | 99338 | 603.91 | 842 | 819 | 163.1 |
| B | 3 | 0 | 34936 | 209.13 | 842 | 819 | 163.1 |
| C | 2 | 53 | 438194 | 2299.27 | 814 | 815 | 190.2 |
| C | 9 | 247 | 109106 | 569.28 | 814 | 815 | 190.2 |
| C | 1 | 0 | 9265 | 44.42 | 814 | 815 | 190.2 |
| D | 13 | 46 | 156010 | 782.44 | 812 | 785 | 198.4 |
| D | 13 | 239 | 59159 | 294.25 | 812 | 785 | 198.4 |
| D | 14 | 34 | 46330 | 229.58 | 812 | 785 | 198.4 |
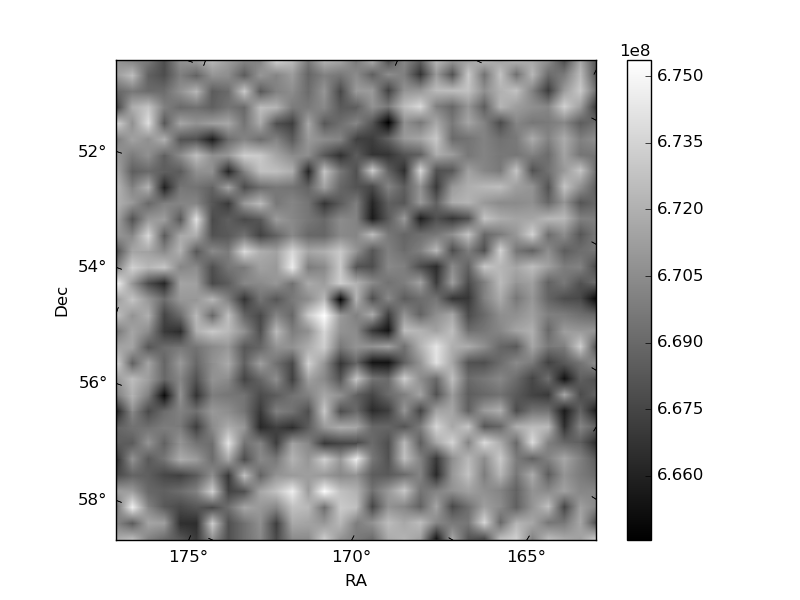
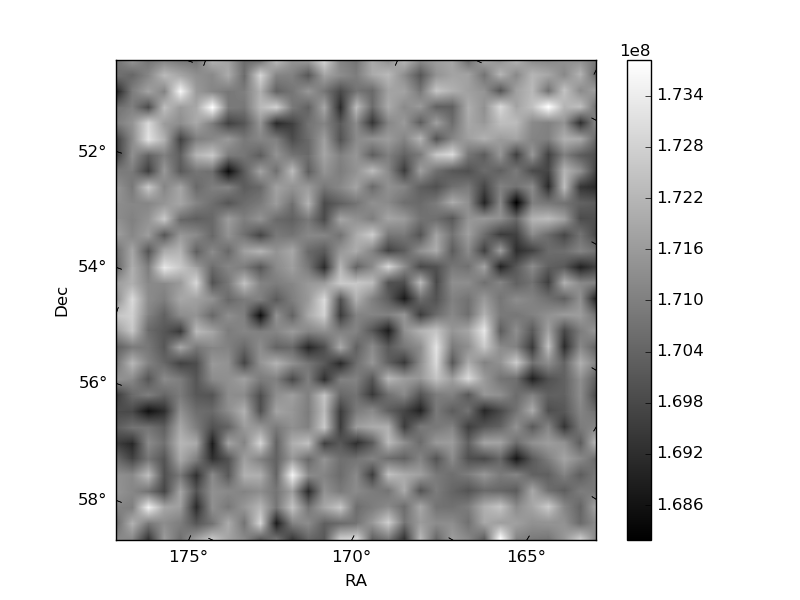
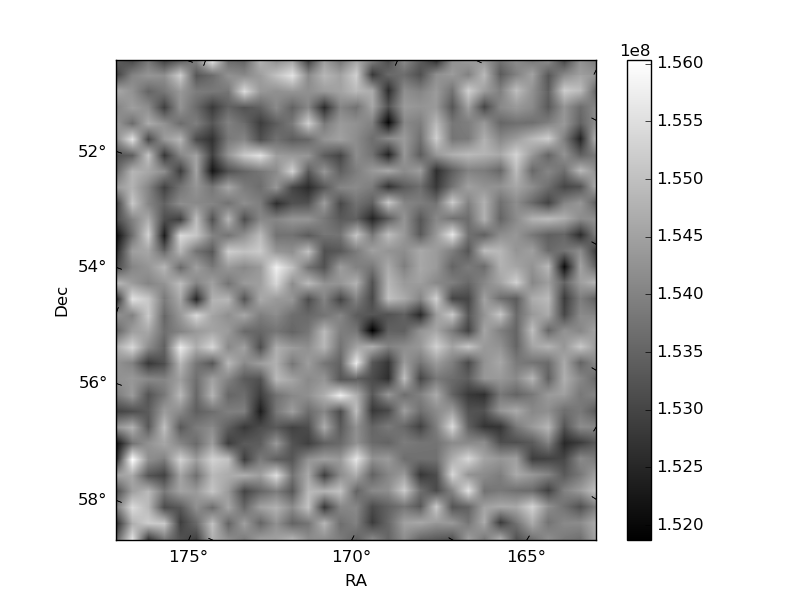
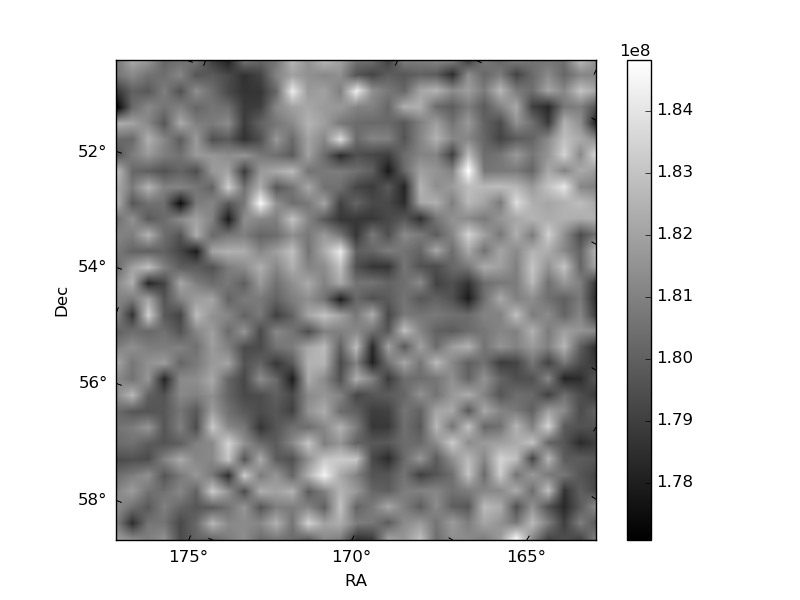
Histogram calculated using DETX and DETY for each event in the final _common_clean file
| Quadrant A | 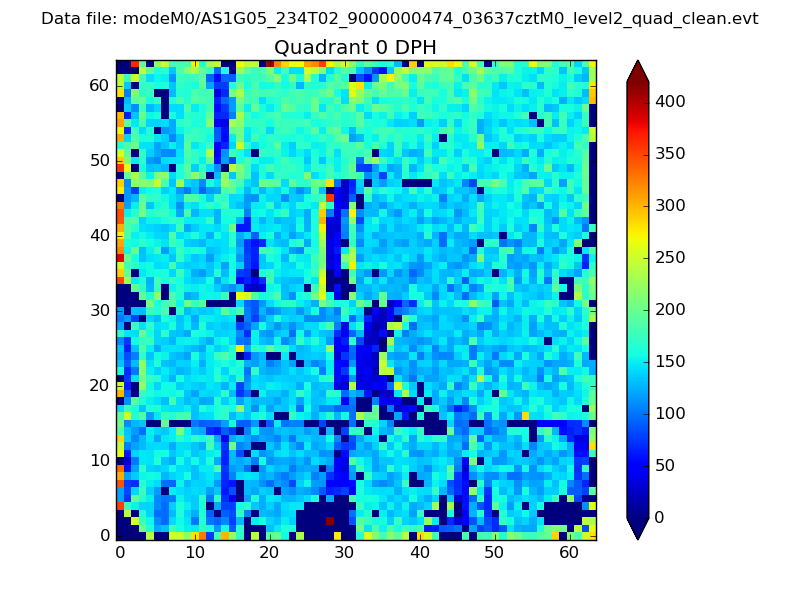 |
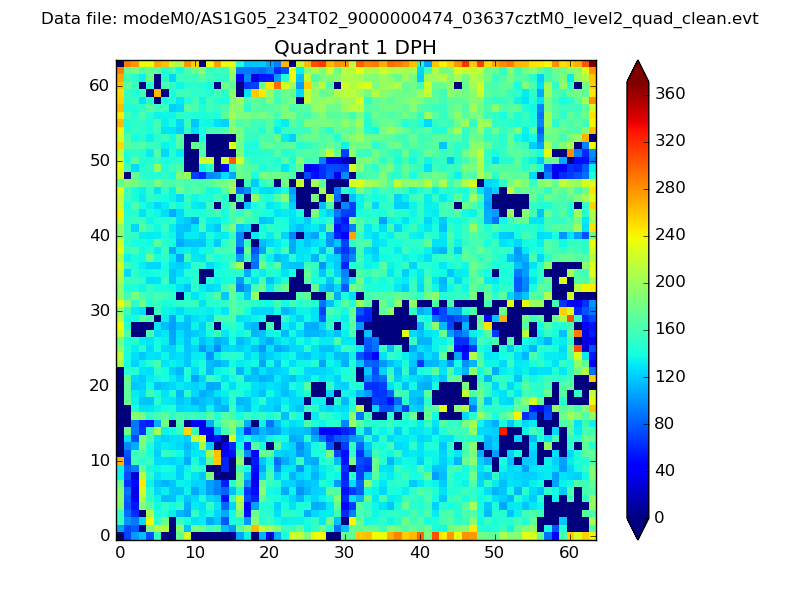 |
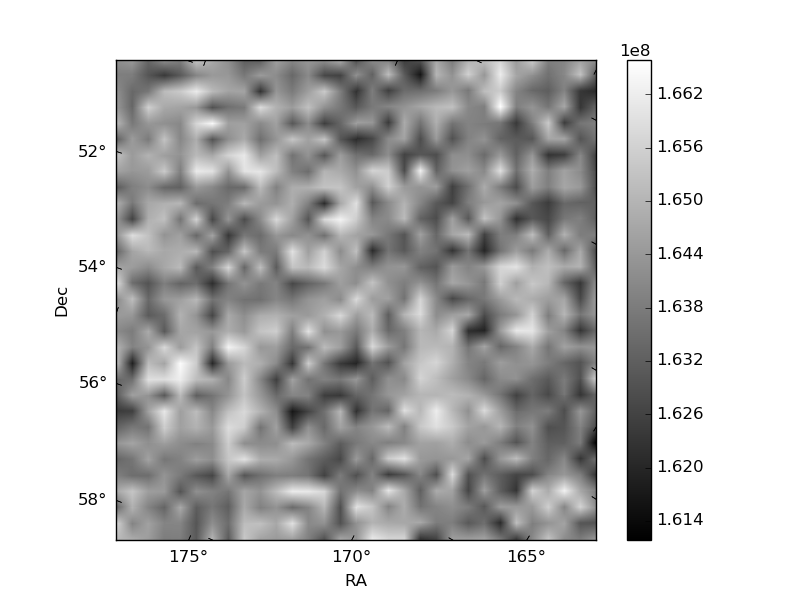
Quadrant B |
|---|---|---|---|
| Quadrant D | 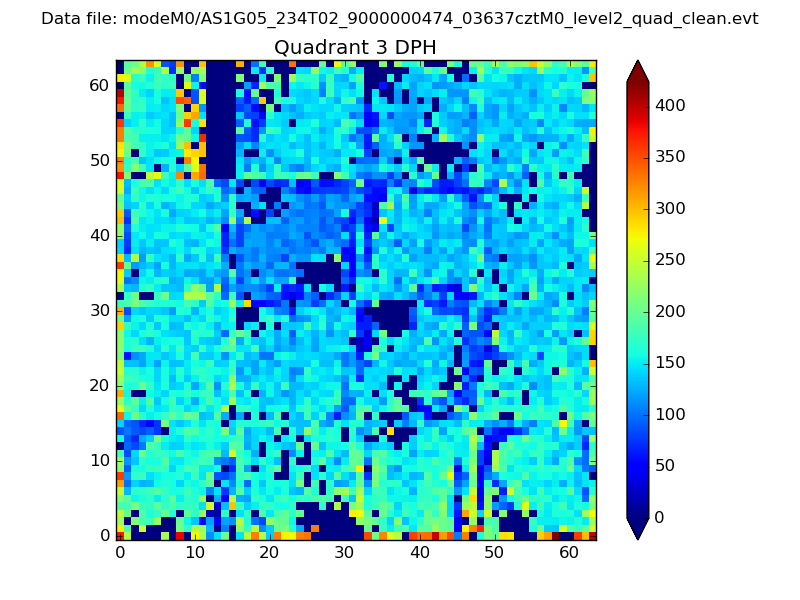 |
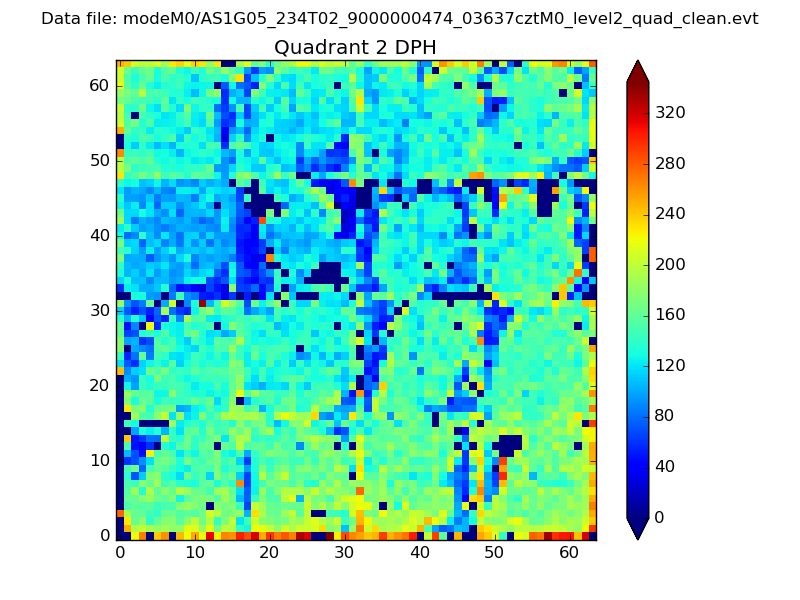 |
Quadrant C |
| Plot type | Count rate plots | Images |
|---|---|---|
| Comparison with Poisson distribution Blue bars denote a histogram of data divided into 1 sec bins. Red curve is a Poisson curve with rate = median count rate of data. |
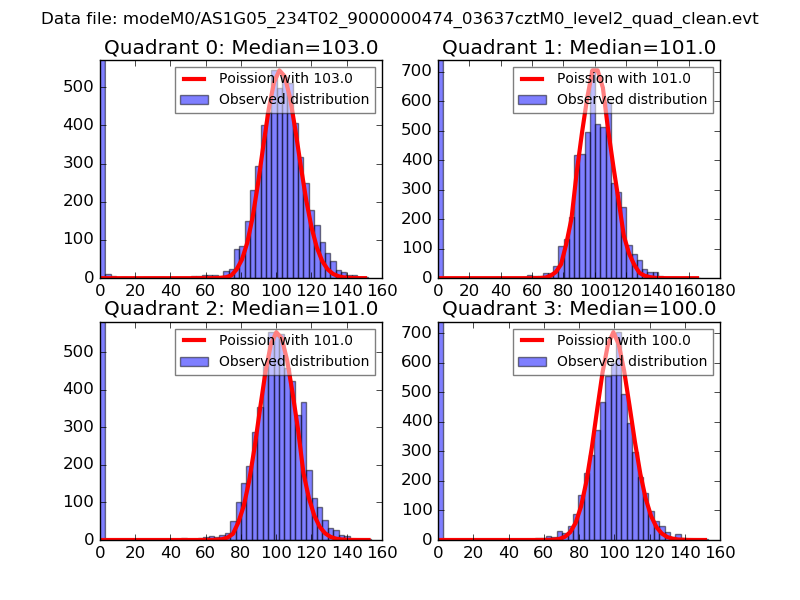 |
 |
| Quadrant-wise count rates Data is divided into 100 sec bins |
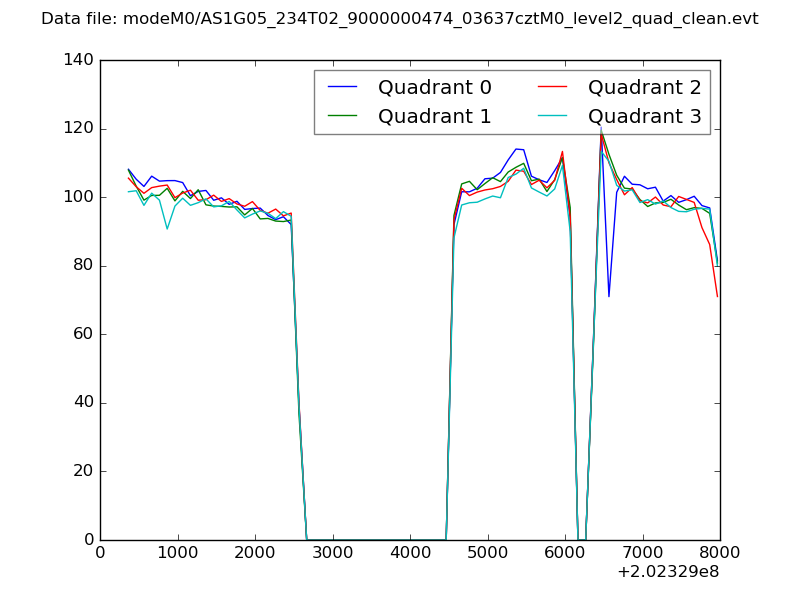 |
|
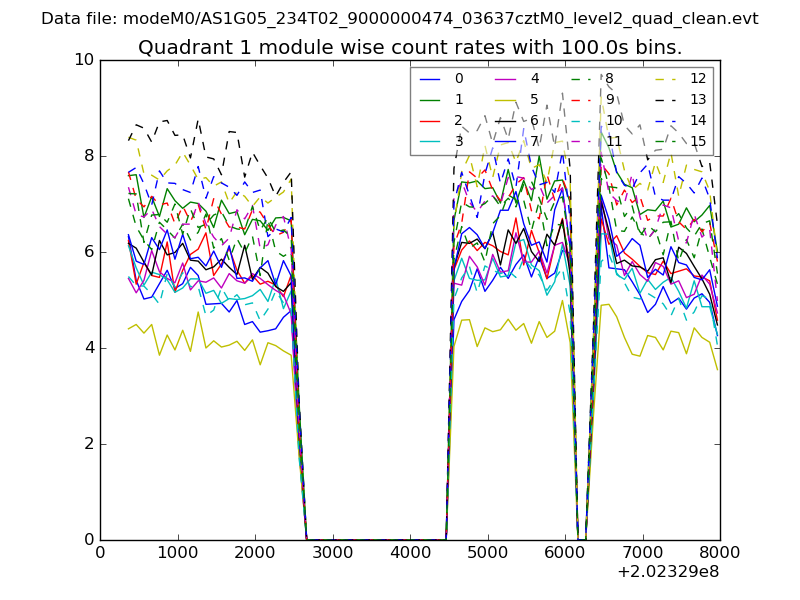
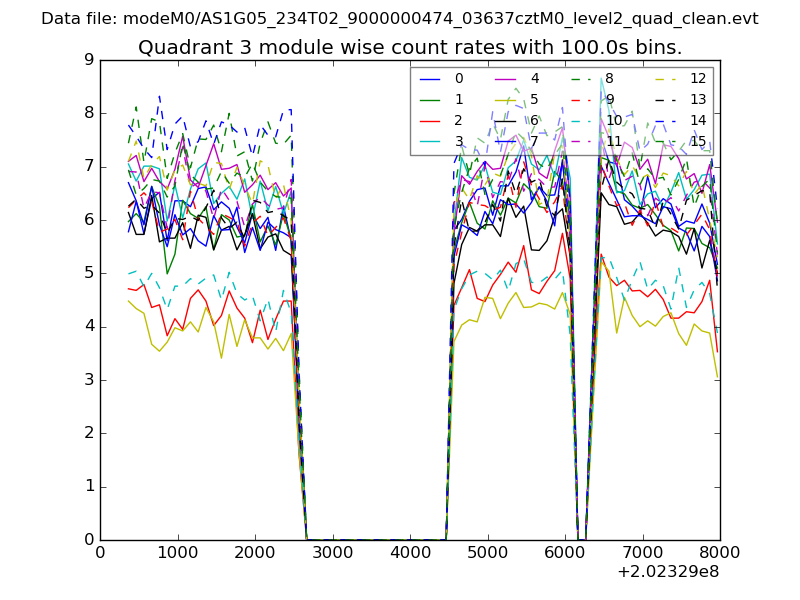
| Module-wise count rates for Quadrant A Data is divided into 100 sec bins |
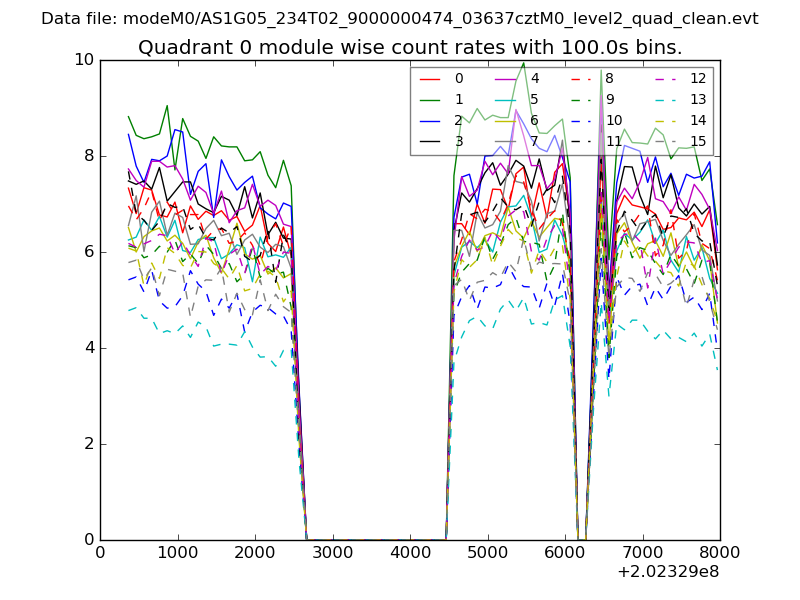 |
 |
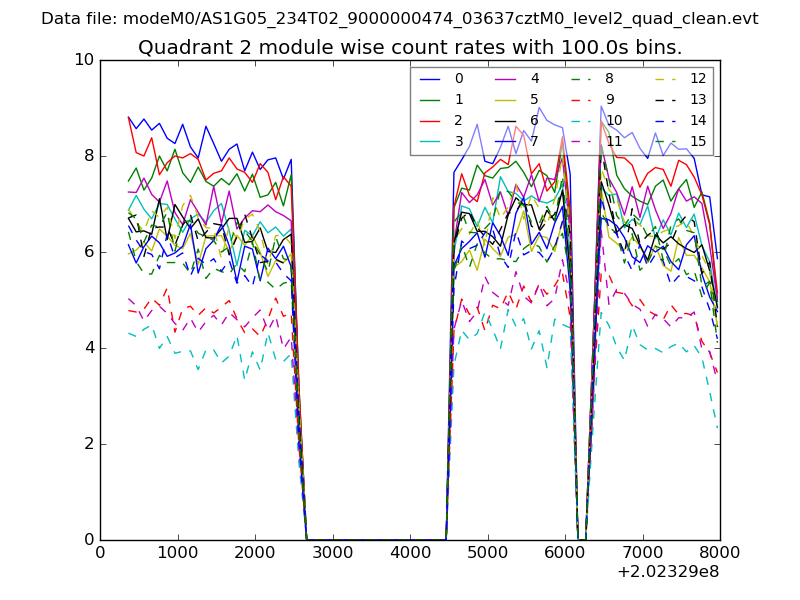
| Module-wise count rates for Quadrant B Data is divided into 100 sec bins |
 |
 |
| Module-wise count rates for Quadrant C Data is divided into 100 sec bins |
 |
 |
| Module-wise count rates for Quadrant D Data is divided into 100 sec bins |
 |
 |
| Parameter | Plot |
|---|---|
| CZT HV Monitor | 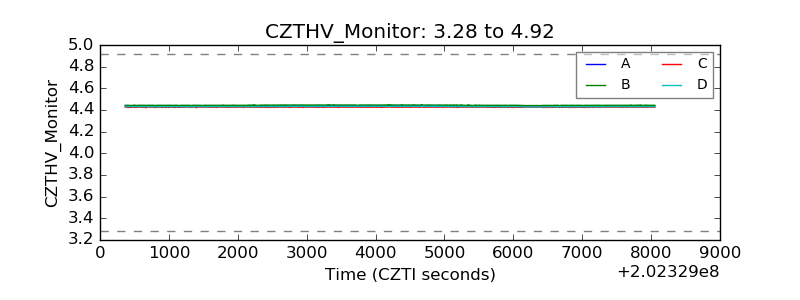 |
| D_VDD | 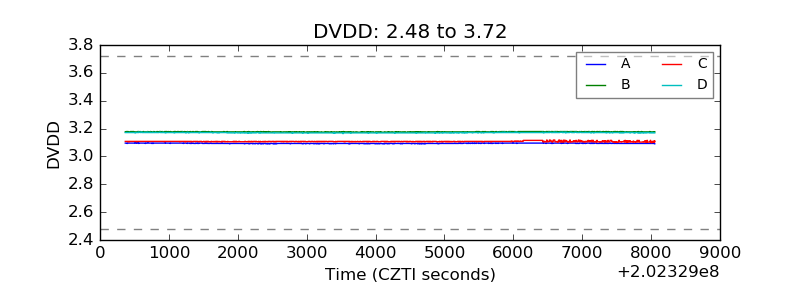 |
| Temperature 1 | 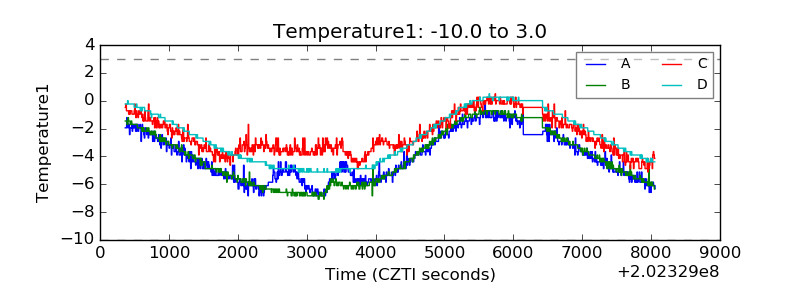 |
| Veto HV Monitor | 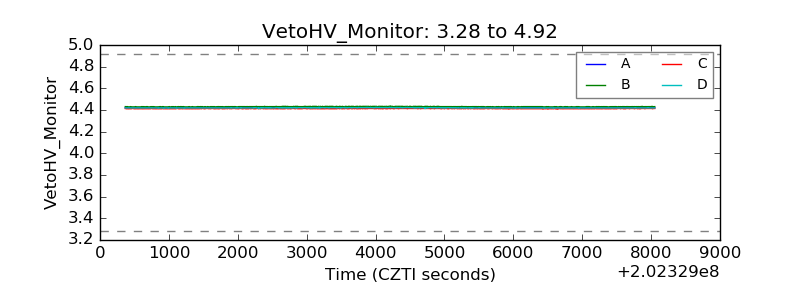 |
| Veto LLD | 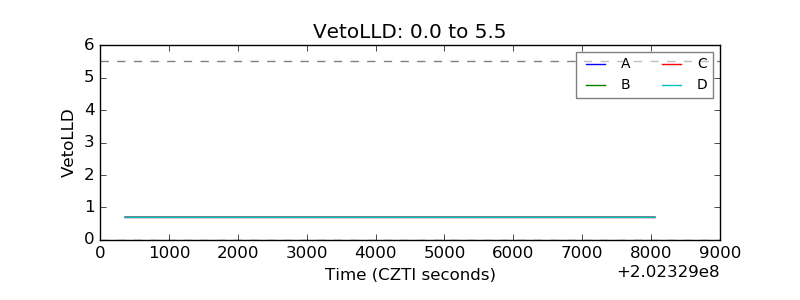 |
| Alpha Counter | 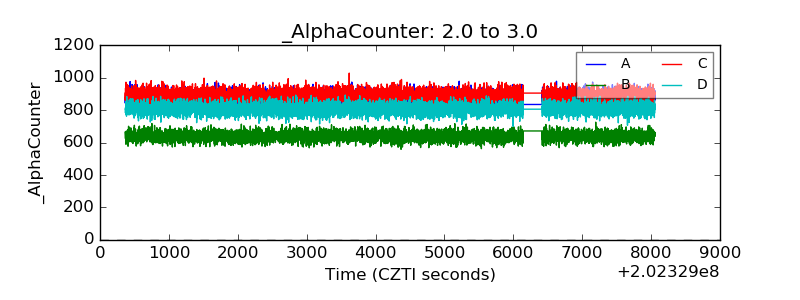 |
| _CPM_Rate | 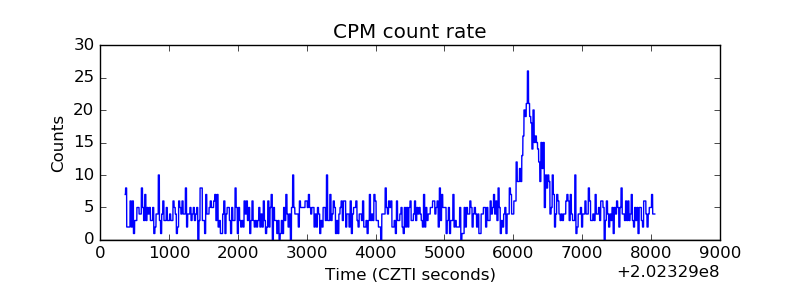 |
| CZT Counter | 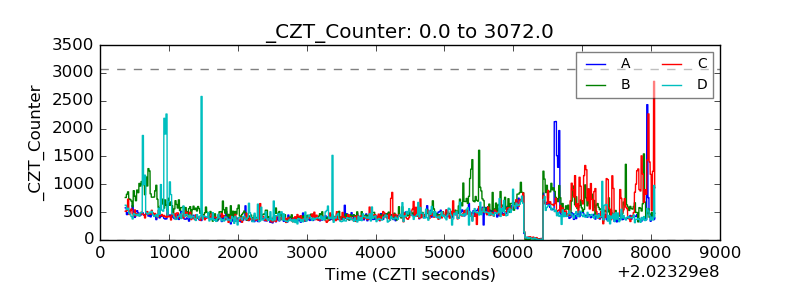 |
| +2.5 Volts monitor |  |
| +5 Volts monitor | 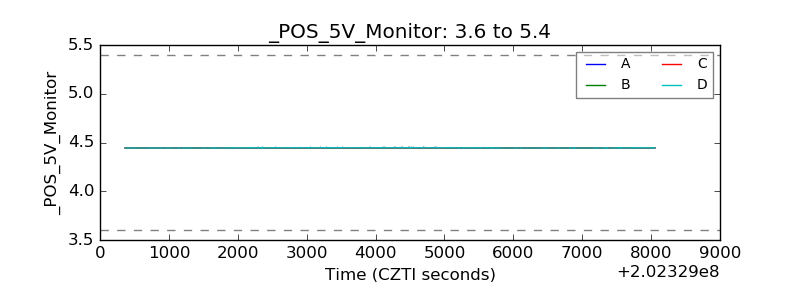 |
| Veto Counter | 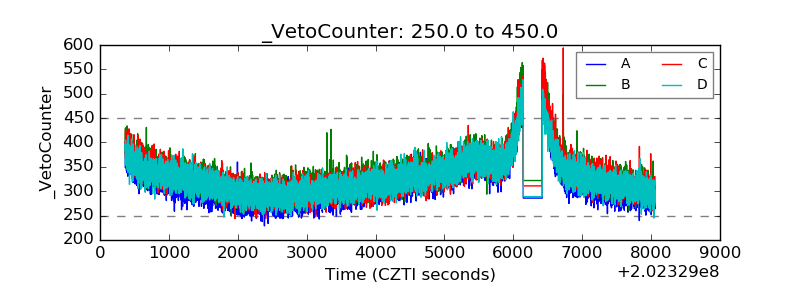 |