| Param | Original file | Final file |
|---|---|---|
| Filename | modeM0/AS1G05_234T02_9000000474_03641cztM0_level2.evt | modeM0/AS1G05_234T02_9000000474_03641cztM0_level2_quad_clean.evt |
| Size (bytes) | 1,123,853,760 | 161,876,160 |
| Size | 1.0 GB | 154.4 MB |
| Events in quadrant A | 7,156,443 | 970,851 |
| Events in quadrant B | 8,008,428 | 971,825 |
| Events in quadrant C | 10,682,784 | 950,603 |
| Events in quadrant D | 7,140,095 | 939,057 |
| Mode M9 | |||
|---|---|---|---|
| Quadrant | BADHDUFLAG | Total packets | Discarded packets |
| A | 0 | 11 | 0 |
| B | 0 | 11 | 0 |
| C | 0 | 11 | 0 |
| D | 0 | 11 | 0 |
| Mode SS | |||
|---|---|---|---|
| Quadrant | BADHDUFLAG | Total packets | Discarded packets |
| A | 0 | 312 | 0 |
| B | 0 | 312 | 0 |
| C | 0 | 312 | 0 |
| D | 0 | 312 | 0 |
| Mode M0 | |||
|---|---|---|---|
| Quadrant | BADHDUFLAG | Total packets | Discarded packets |
| A | 0 | 32463 | 6 |
| B | 0 | 34607 | 5 |
| C | 0 | 42834 | 3 |
| D | 0 | 33108 | 5 |
| Quadrant | Total seconds | Saturated seconds | Saturation percentage |
|---|---|---|---|
| A | 15507 | 95 | 0.612627% |
| B | 15507 | 105 | 0.677114% |
| C | 15508 | 1071 | 6.906113% |
| D | 15508 | 121 | 0.780242% |
Noise dominated data is calculated using 1-second bins in cleaned event files. If a bin has >2000 counts, and if more than 50% of those come from <1% of pixels, then it is considered to be noise-dominated and hence unusable.
| Quadrant | # 1 sec bins | Bins with >0 counts | Bins with >2000 counts | High rate bins dominated by noise | Noise dominated (total time) | Noise dominated (detector-on time) | Marked lightcurve |
|---|---|---|---|---|---|---|---|
| A | 16558 | 15511 | 37 | 37 | 0.22% | 0.24% | 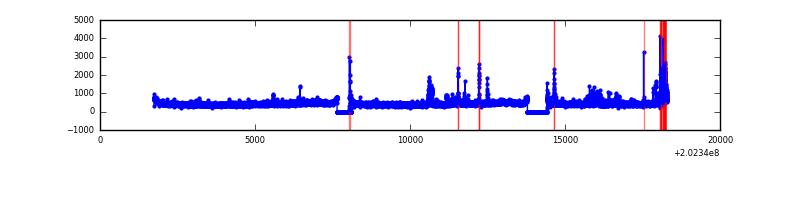 |
| B | 16558 | 15511 | 7 | 7 | 0.04% | 0.05% | 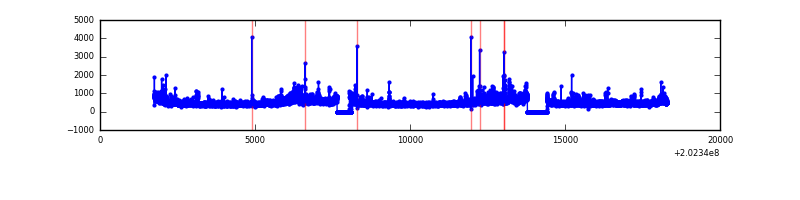 |
| C | 16558 | 15511 | 737 | 737 | 4.45% | 4.75% | 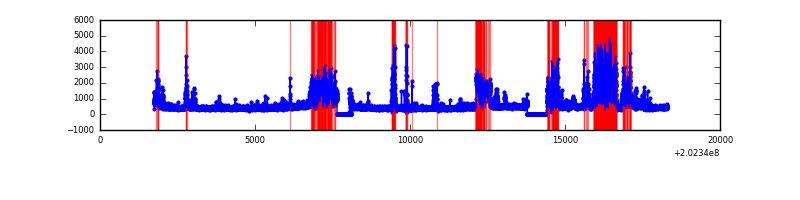 |
| D | 16559 | 15512 | 78 | 78 | 0.47% | 0.50% |  |
Top three noisy pixels from each quadrant. If the there are fewer than three noisy pixels in the level2.evt file, extra rows are filled as -1
| Pixel properties | Quadrant properties | ||||||
|---|---|---|---|---|---|---|---|
| Quadrant | DetID | PixID | Counts | Sigma | Mean | Median | Sigma |
| A | 13 | 251 | 277348 | 786.1 | 1713 | 1670 | 350.7 |
| A | 13 | 164 | 149098 | 420.39 | 1713 | 1670 | 350.7 |
| A | 0 | 50 | 35205 | 95.62 | 1713 | 1670 | 350.7 |
| B | 15 | 204 | 672281 | 2003.59 | 1740 | 1694 | 334.7 |
| B | 14 | 167 | 171553 | 507.51 | 1740 | 1694 | 334.7 |
| B | 4 | 81 | 123023 | 362.51 | 1740 | 1694 | 334.7 |
| C | 2 | 53 | 3901104 | 10211.9 | 1644 | 1649 | 381.9 |
| C | 9 | 247 | 301132 | 784.29 | 1644 | 1649 | 381.9 |
| C | 1 | 16 | 22106 | 53.57 | 1644 | 1649 | 381.9 |
| D | 13 | 223 | 274767 | 679.78 | 1664 | 1613 | 401.8 |
| D | 12 | 110 | 112156 | 275.1 | 1664 | 1613 | 401.8 |
| D | 13 | 239 | 111182 | 272.68 | 1664 | 1613 | 401.8 |
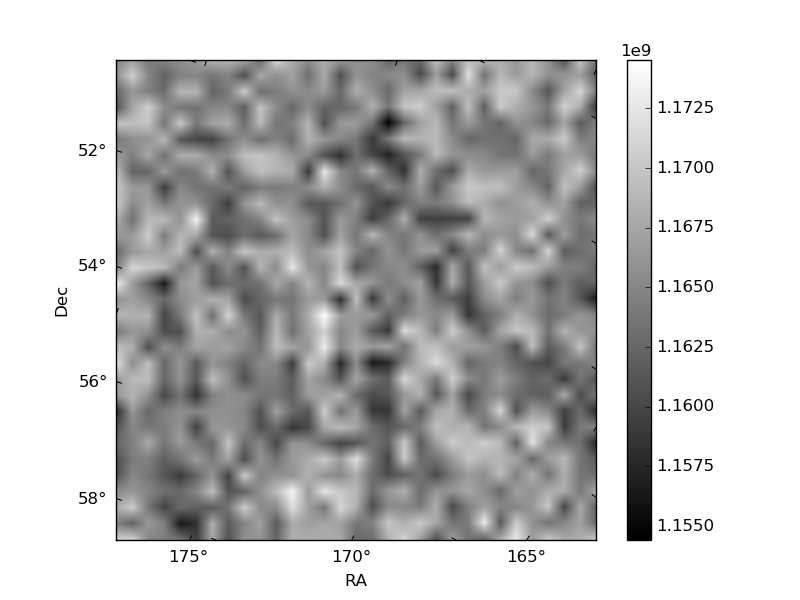
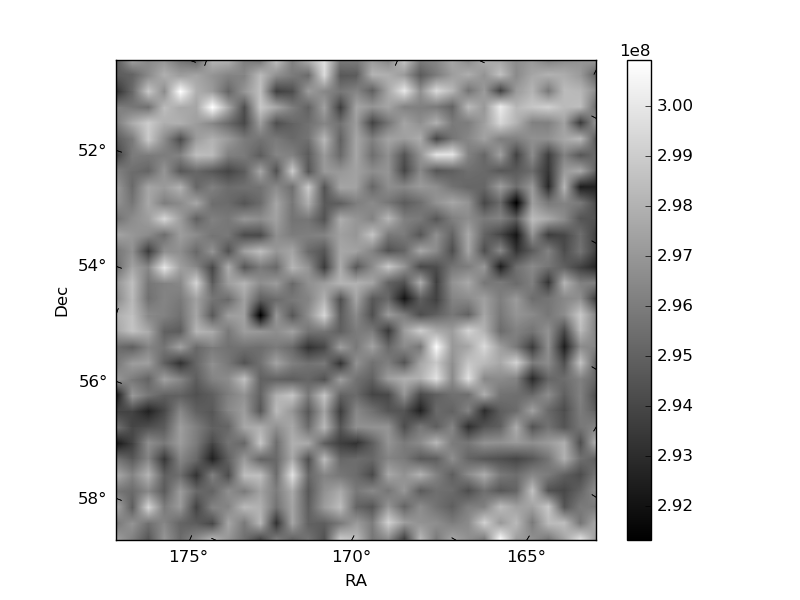
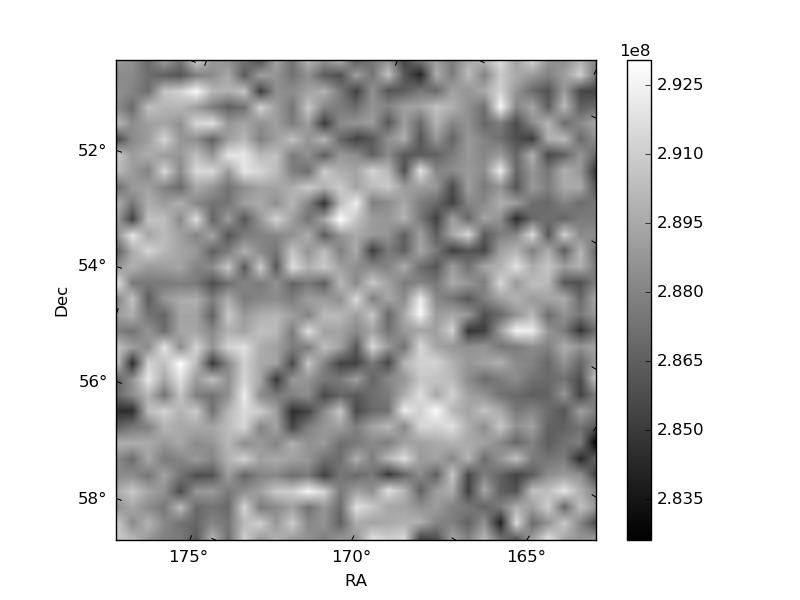
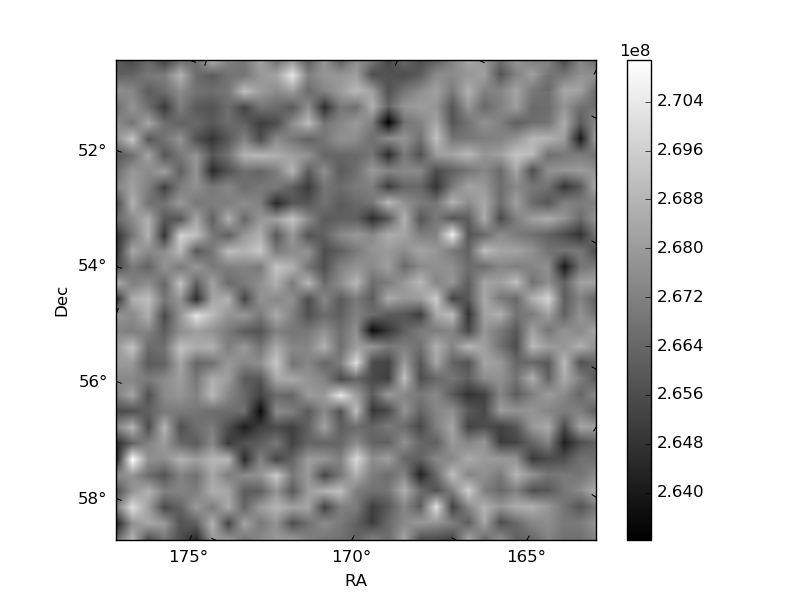
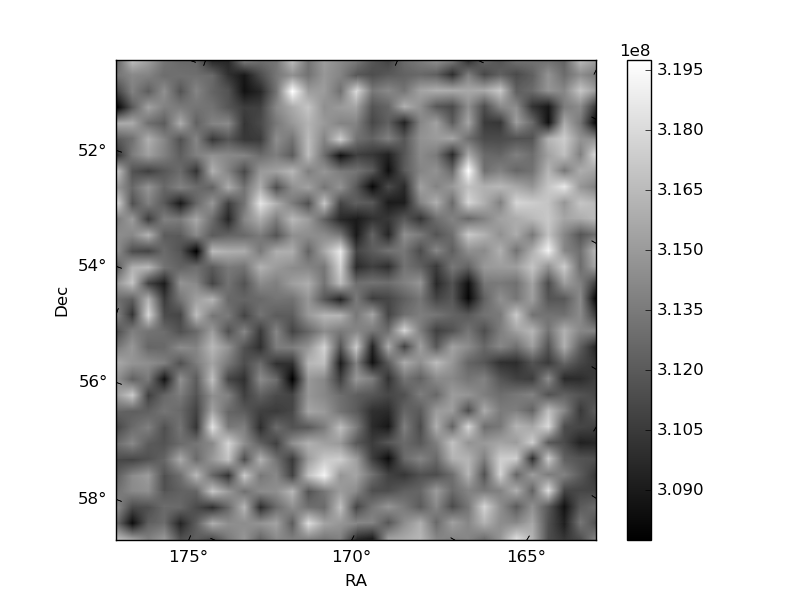
Histogram calculated using DETX and DETY for each event in the final _common_clean file
| Quadrant A | 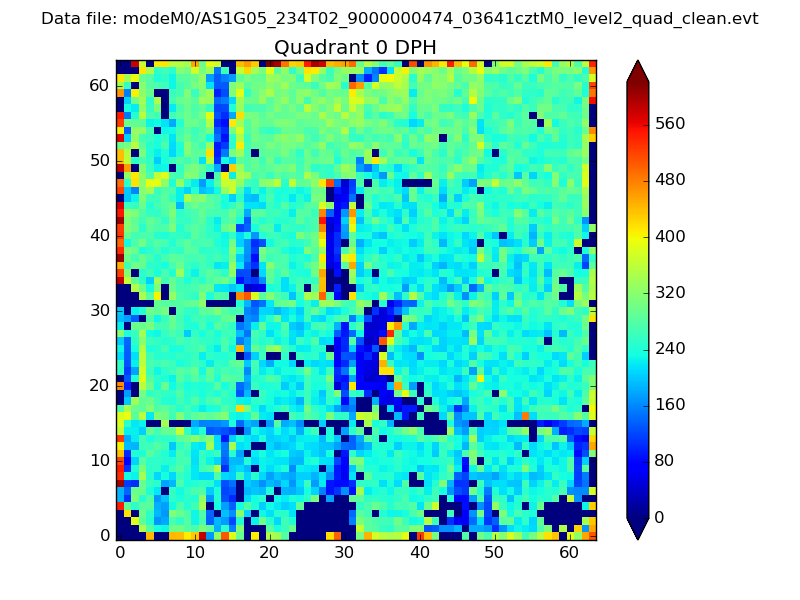 |
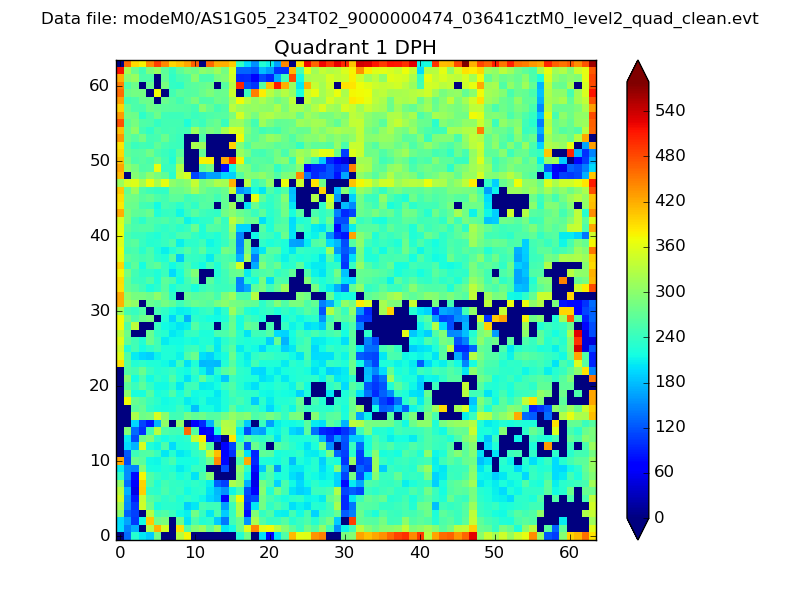 |
Quadrant B |
|---|---|---|---|
| Quadrant D | 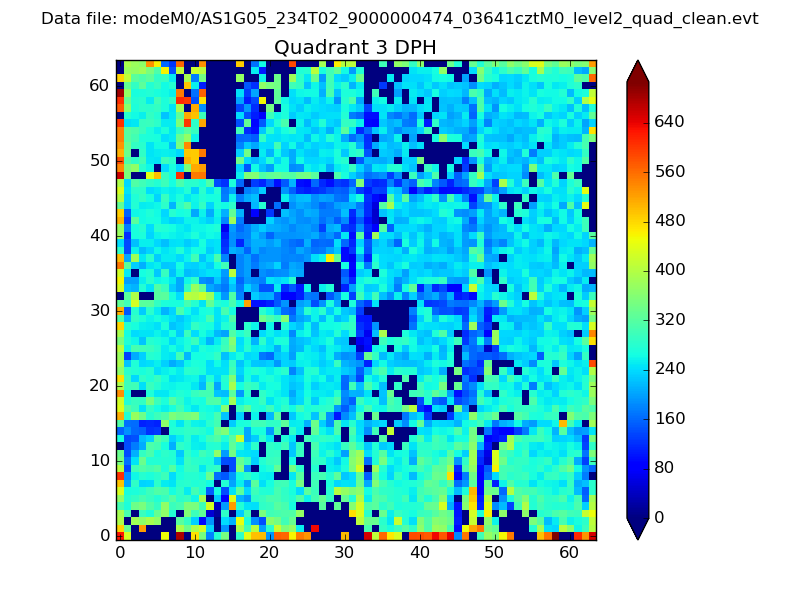 |
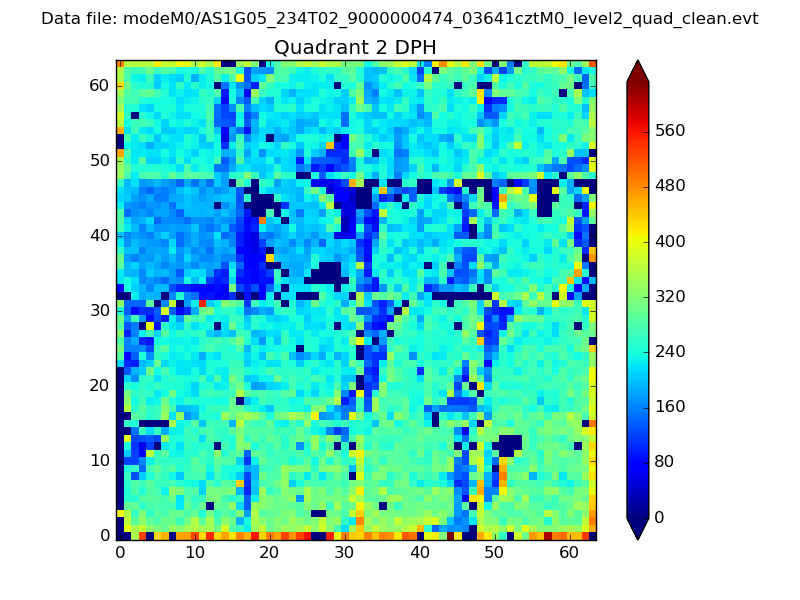 |
Quadrant C |
| Plot type | Count rate plots | Images |
|---|---|---|
| Comparison with Poisson distribution Blue bars denote a histogram of data divided into 1 sec bins. Red curve is a Poisson curve with rate = median count rate of data. |
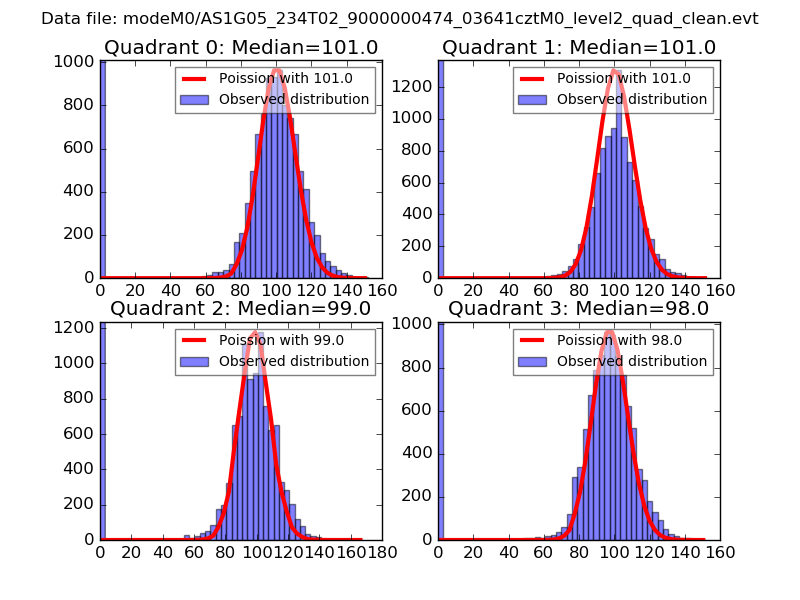 |
 |
| Quadrant-wise count rates Data is divided into 100 sec bins |
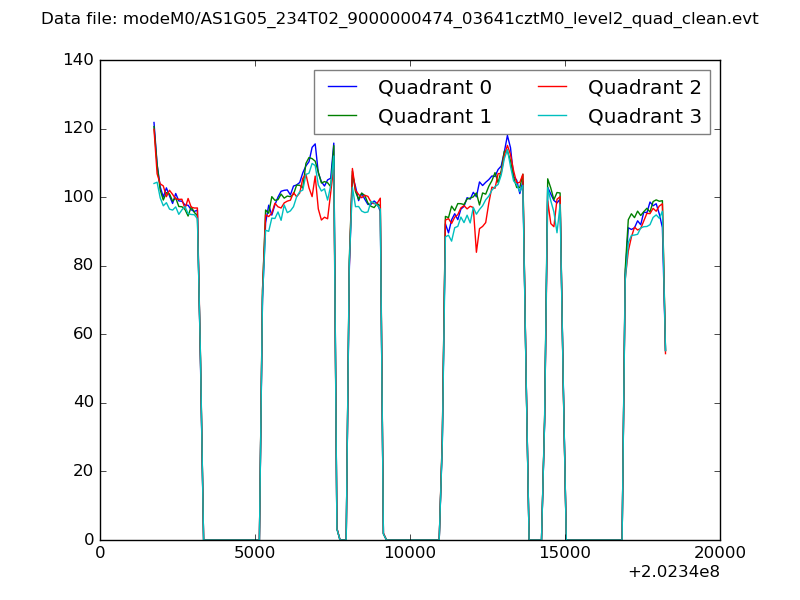 |
|
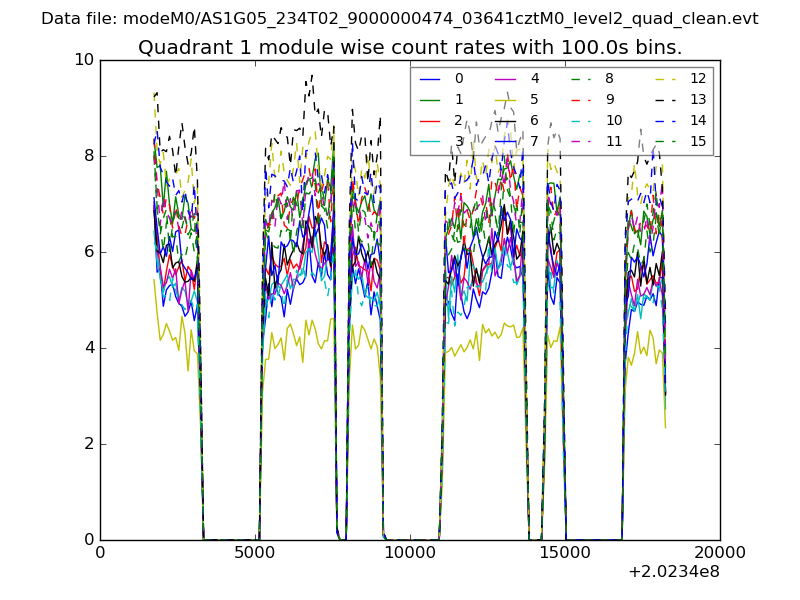
| Module-wise count rates for Quadrant A Data is divided into 100 sec bins |
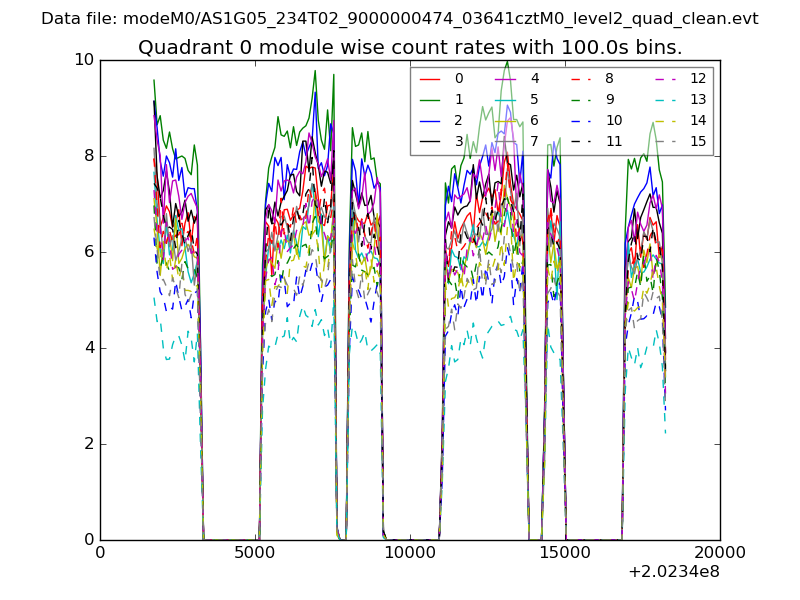 |
 |
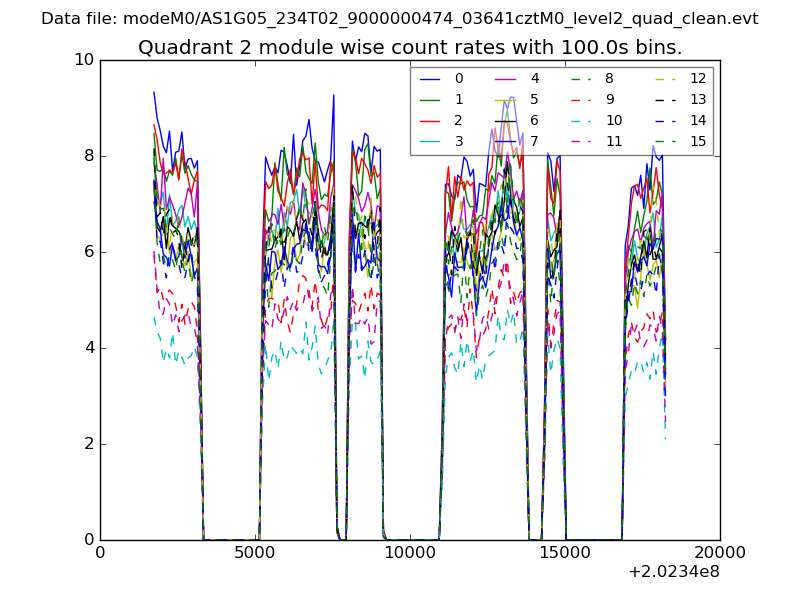
| Module-wise count rates for Quadrant B Data is divided into 100 sec bins |
 |
 |
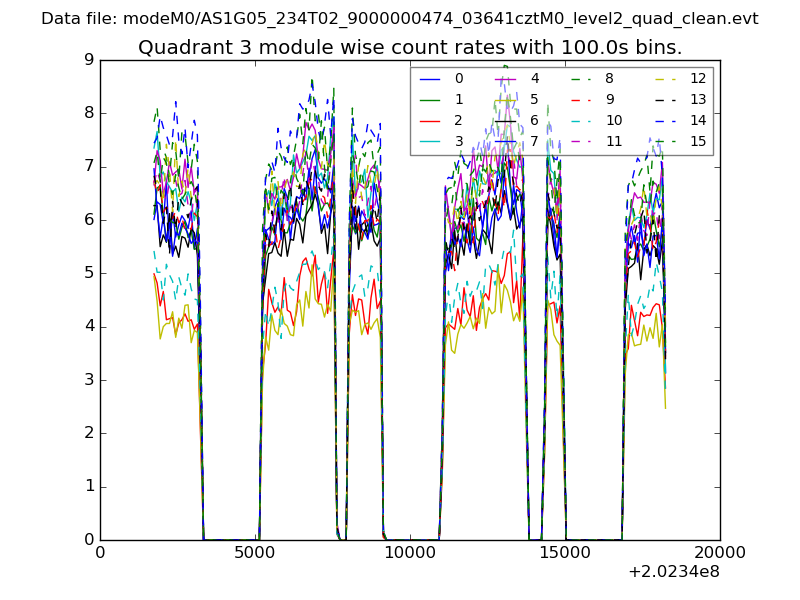
| Module-wise count rates for Quadrant C Data is divided into 100 sec bins |
 |
 |
| Module-wise count rates for Quadrant D Data is divided into 100 sec bins |
 |
 |
| Parameter | Plot |
|---|---|
| CZT HV Monitor | 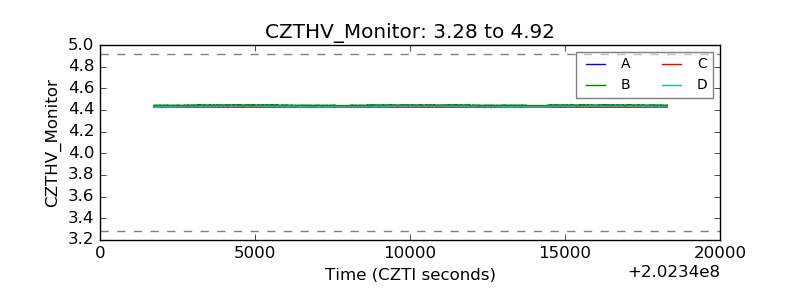 |
| D_VDD | 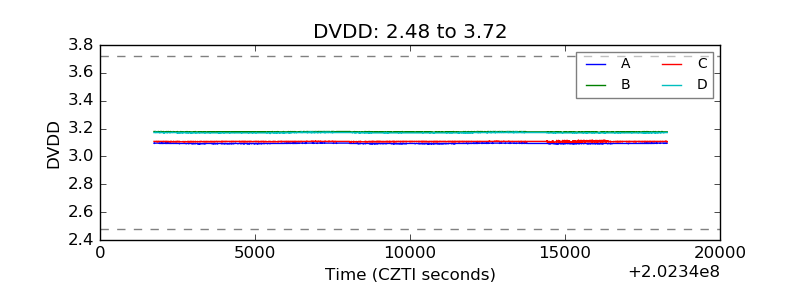 |
| Temperature 1 | 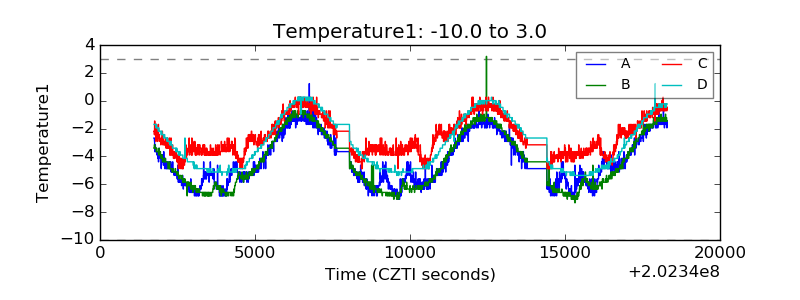 |
| Veto HV Monitor | 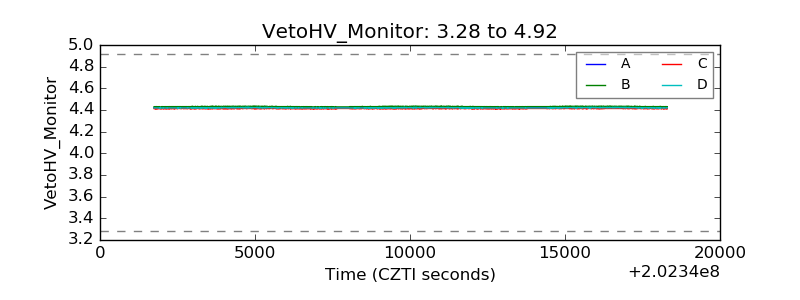 |
| Veto LLD | 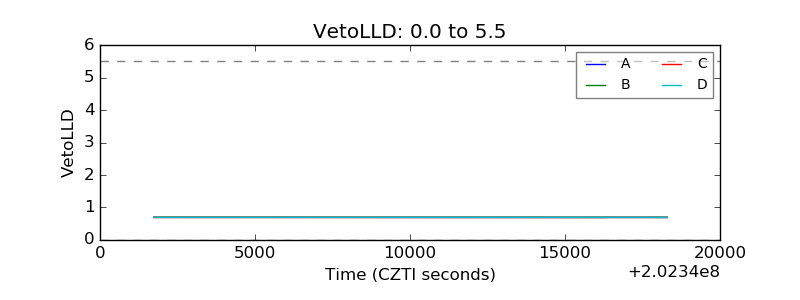 |
| Alpha Counter | 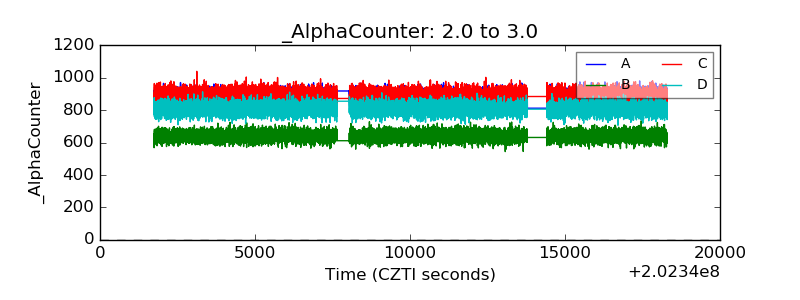 |
| _CPM_Rate | 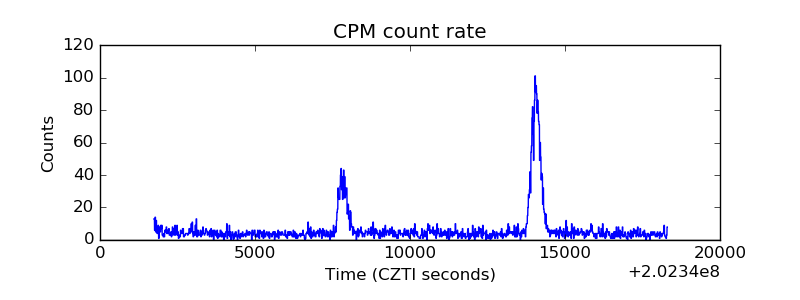 |
| CZT Counter | 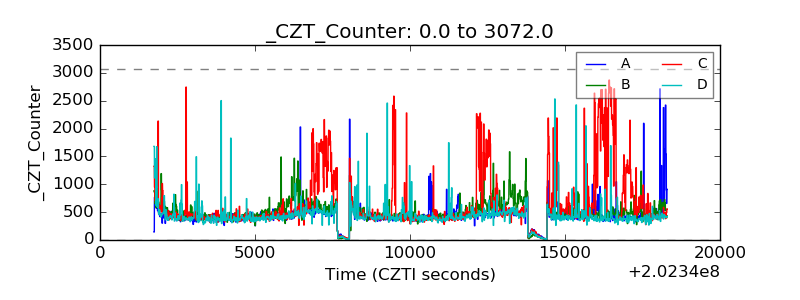 |
| +2.5 Volts monitor | 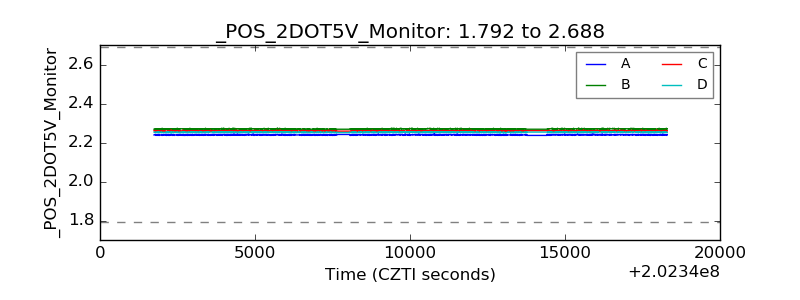 |
| +5 Volts monitor | 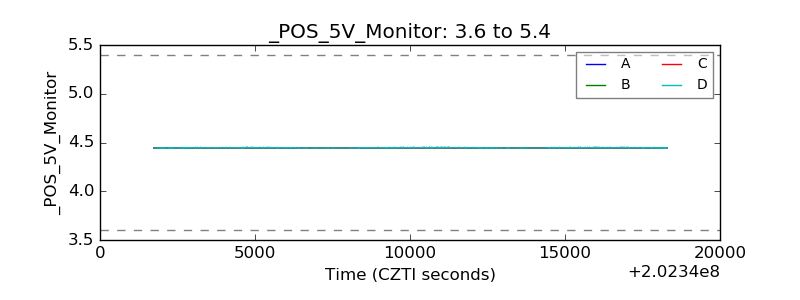 |
| Veto Counter | 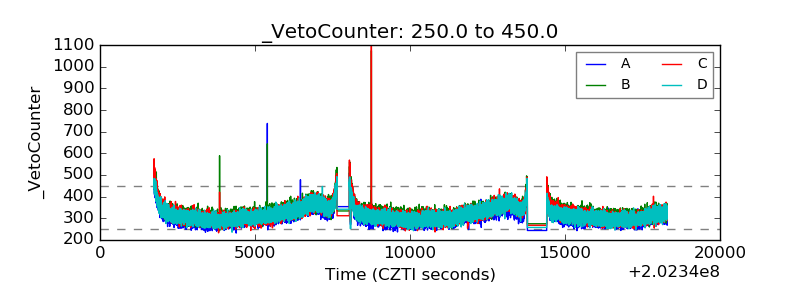 |