| Param | Original file | Final file |
|---|---|---|
| Filename | modeM0/AS1G05_234T02_9000000474_03642cztM0_level2.evt | modeM0/AS1G05_234T02_9000000474_03642cztM0_level2_quad_clean.evt |
| Size (bytes) | 2,173,824,000 | 302,857,920 |
| Size | 2.0 GB | 288.8 MB |
| Events in quadrant A | 15,818,264 | 1,805,541 |
| Events in quadrant B | 15,681,838 | 1,812,665 |
| Events in quadrant C | 18,700,228 | 1,785,111 |
| Events in quadrant D | 13,659,524 | 1,756,919 |
| Mode M9 | |||
|---|---|---|---|
| Quadrant | BADHDUFLAG | Total packets | Discarded packets |
| A | 0 | 30 | 0 |
| B | 0 | 30 | 0 |
| C | 0 | 30 | 0 |
| D | 0 | 30 | 0 |
| Mode SS | |||
|---|---|---|---|
| Quadrant | BADHDUFLAG | Total packets | Discarded packets |
| A | 0 | 596 | 0 |
| B | 0 | 596 | 0 |
| C | 0 | 596 | 0 |
| D | 0 | 596 | 0 |
| Mode M0 | |||
|---|---|---|---|
| Quadrant | BADHDUFLAG | Total packets | Discarded packets |
| A | 0 | 67931 | 6 |
| B | 0 | 66618 | 5 |
| C | 0 | 76117 | 5 |
| D | 0 | 62710 | 8 |
| Quadrant | Total seconds | Saturated seconds | Saturation percentage |
|---|---|---|---|
| A | 29262 | 541 | 1.848814% |
| B | 29262 | 276 | 0.943203% |
| C | 29262 | 1310 | 4.476796% |
| D | 29261 | 249 | 0.850962% |
Noise dominated data is calculated using 1-second bins in cleaned event files. If a bin has >2000 counts, and if more than 50% of those come from <1% of pixels, then it is considered to be noise-dominated and hence unusable.
| Quadrant | # 1 sec bins | Bins with >0 counts | Bins with >2000 counts | High rate bins dominated by noise | Noise dominated (total time) | Noise dominated (detector-on time) | Marked lightcurve |
|---|---|---|---|---|---|---|---|
| A | 32233 | 29269 | 278 | 278 | 0.86% | 0.95% | 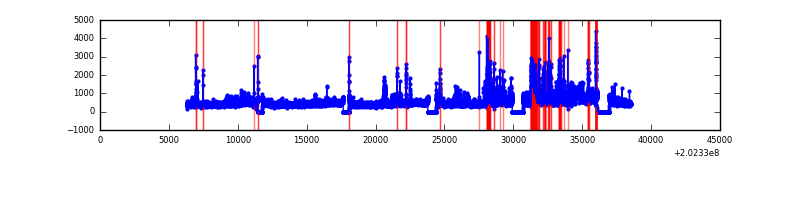 |
| B | 32233 | 29269 | 36 | 36 | 0.11% | 0.12% | 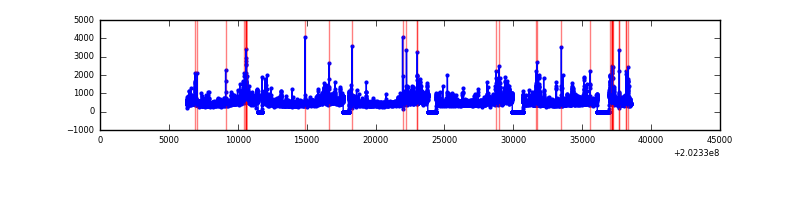 |
| C | 32233 | 29269 | 929 | 929 | 2.88% | 3.17% | 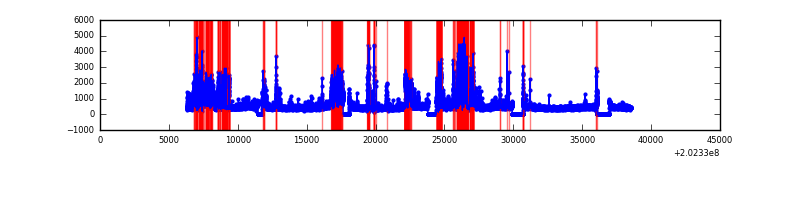 |
| D | 32232 | 29268 | 130 | 130 | 0.40% | 0.44% | 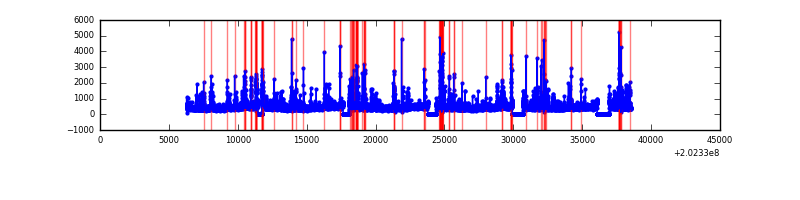 |
Top three noisy pixels from each quadrant. If the there are fewer than three noisy pixels in the level2.evt file, extra rows are filled as -1
| Pixel properties | Quadrant properties | ||||||
|---|---|---|---|---|---|---|---|
| Quadrant | DetID | PixID | Counts | Sigma | Mean | Median | Sigma |
| A | 13 | 251 | 2178419 | 3259.09 | 3270 | 3195 | 667.4 |
| A | 8 | 192 | 554832 | 826.5 | 3270 | 3195 | 667.4 |
| A | 13 | 164 | 207939 | 306.76 | 3270 | 3195 | 667.4 |
| B | 15 | 204 | 1455221 | 2286.82 | 3328 | 3245 | 634.9 |
| B | 4 | 81 | 365831 | 571.06 | 3328 | 3245 | 634.9 |
| B | 14 | 167 | 296773 | 462.3 | 3328 | 3245 | 634.9 |
| C | 2 | 53 | 5648735 | 7702.79 | 3167 | 3181 | 732.9 |
| C | 9 | 247 | 534545 | 724.99 | 3167 | 3181 | 732.9 |
| C | 12 | 4 | 39379 | 49.39 | 3167 | 3181 | 732.9 |
| D | 13 | 223 | 373743 | 482.72 | 3187 | 3093 | 767.8 |
| D | 13 | 239 | 361278 | 466.48 | 3187 | 3093 | 767.8 |
| D | 1 | 84 | 286966 | 369.7 | 3187 | 3093 | 767.8 |
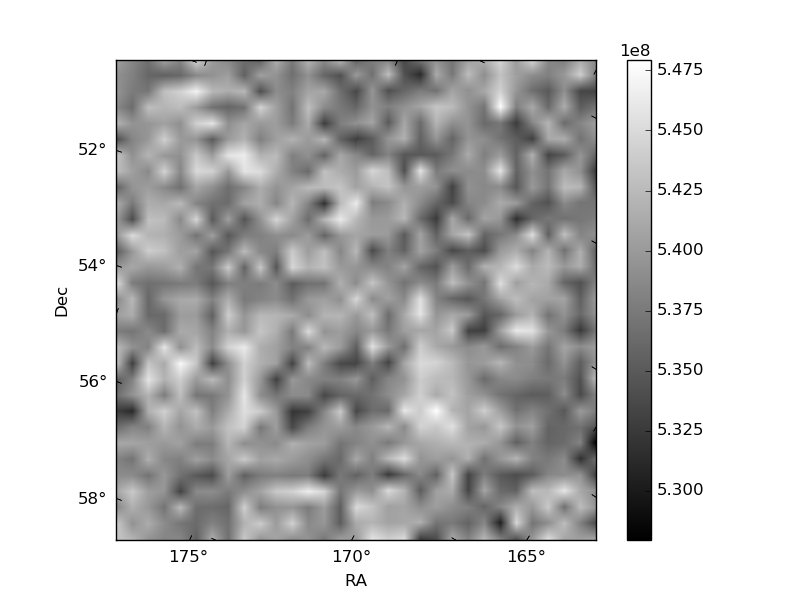
Histogram calculated using DETX and DETY for each event in the final _common_clean file
| Quadrant A |  |
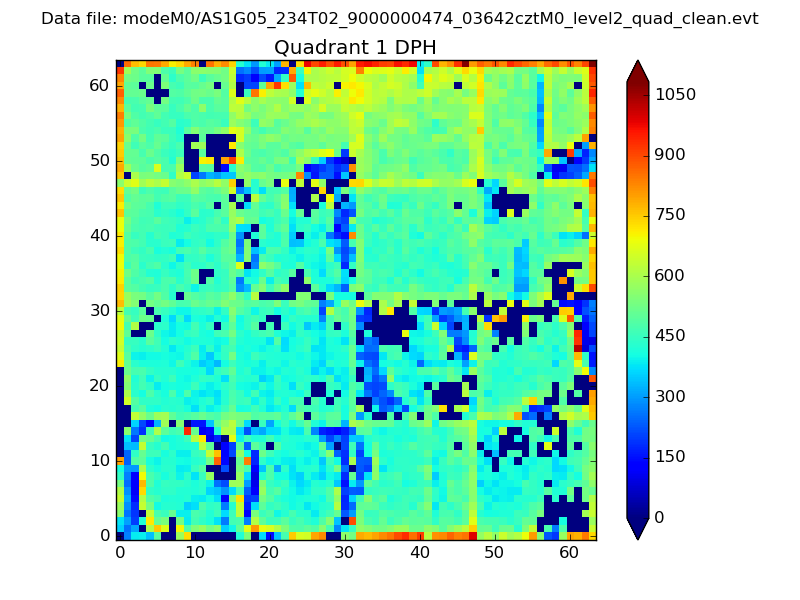 |
Quadrant B |
|---|---|---|---|
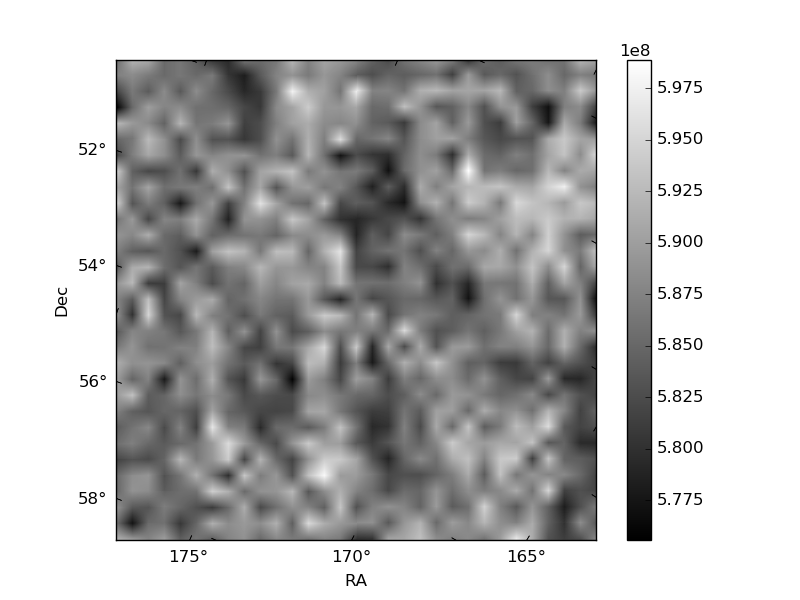
| Quadrant D |  |
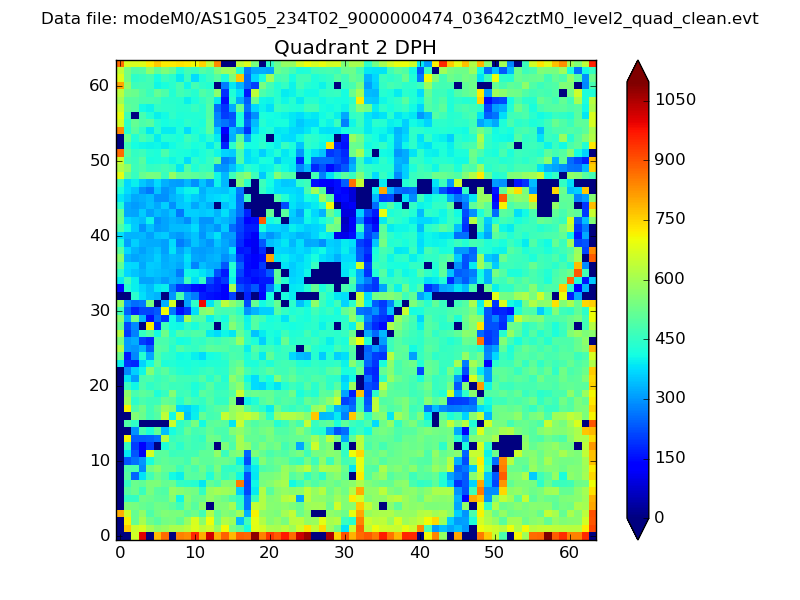 |
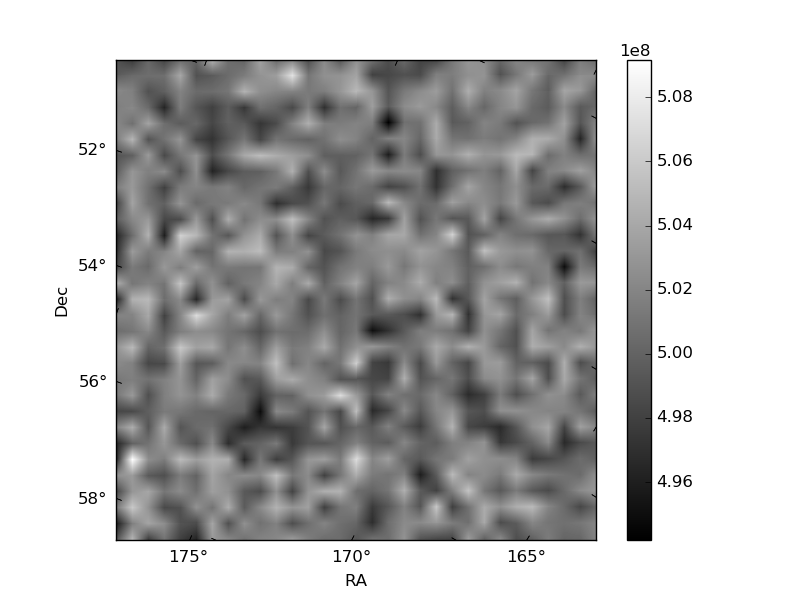
Quadrant C |
| Plot type | Count rate plots | Images |
|---|---|---|
| Comparison with Poisson distribution Blue bars denote a histogram of data divided into 1 sec bins. Red curve is a Poisson curve with rate = median count rate of data. |
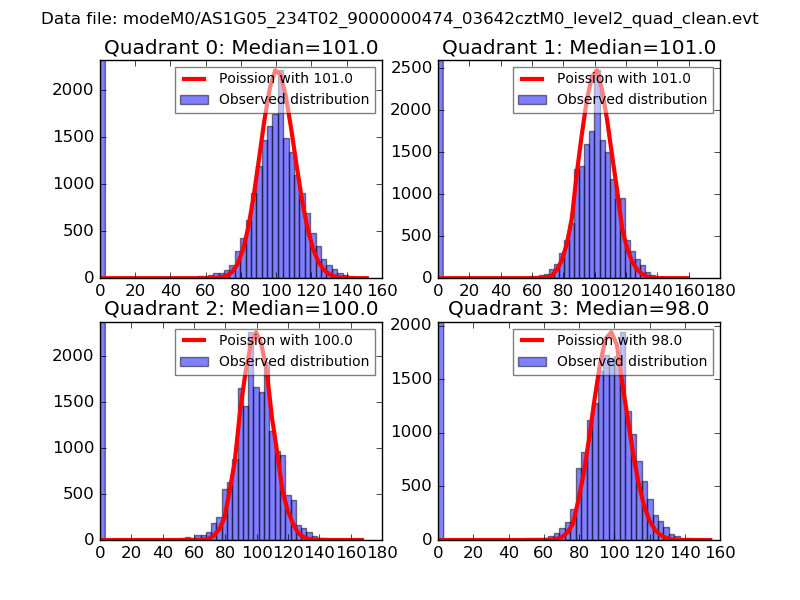 |
 |
| Quadrant-wise count rates Data is divided into 100 sec bins |
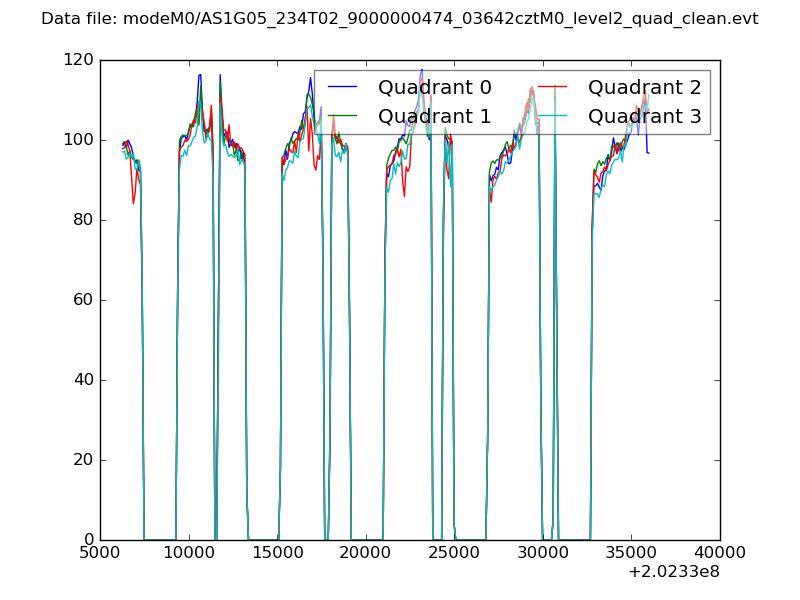 |
|
| Module-wise count rates for Quadrant A Data is divided into 100 sec bins |
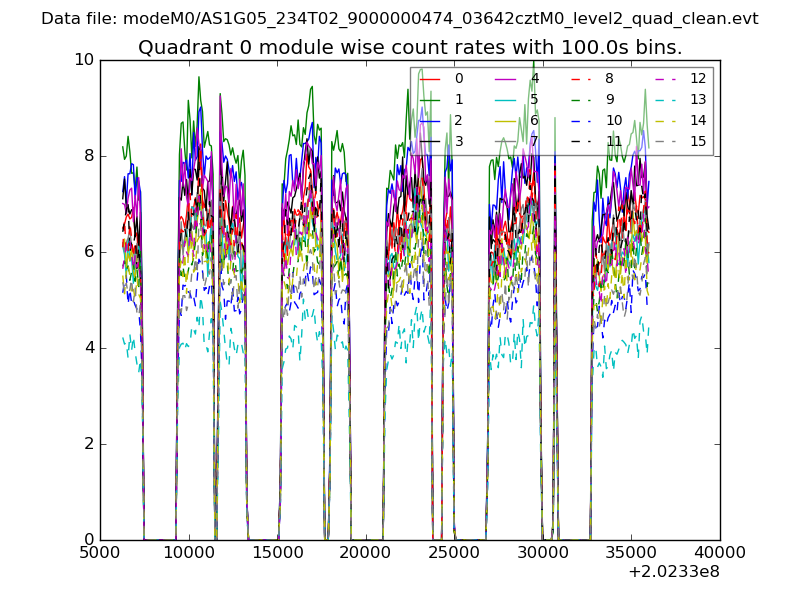 |
 |
| Module-wise count rates for Quadrant B Data is divided into 100 sec bins |
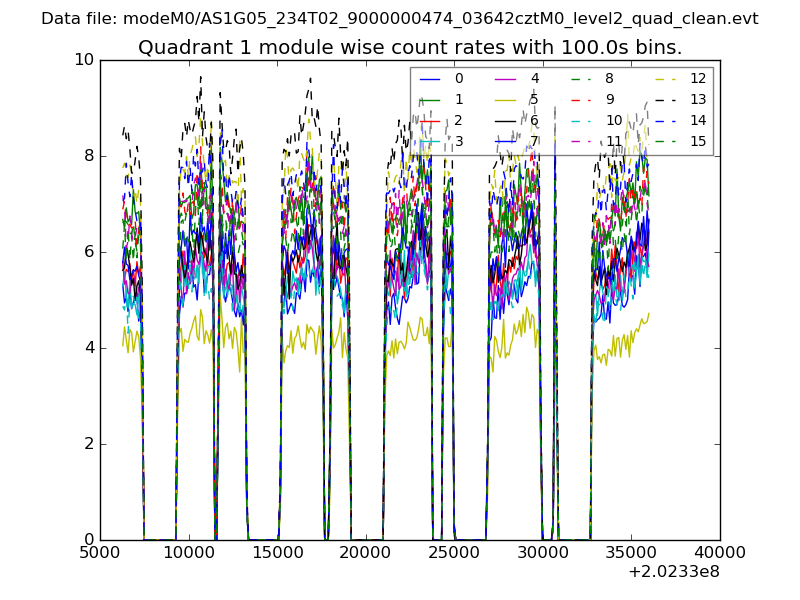 |
 |
| Module-wise count rates for Quadrant C Data is divided into 100 sec bins |
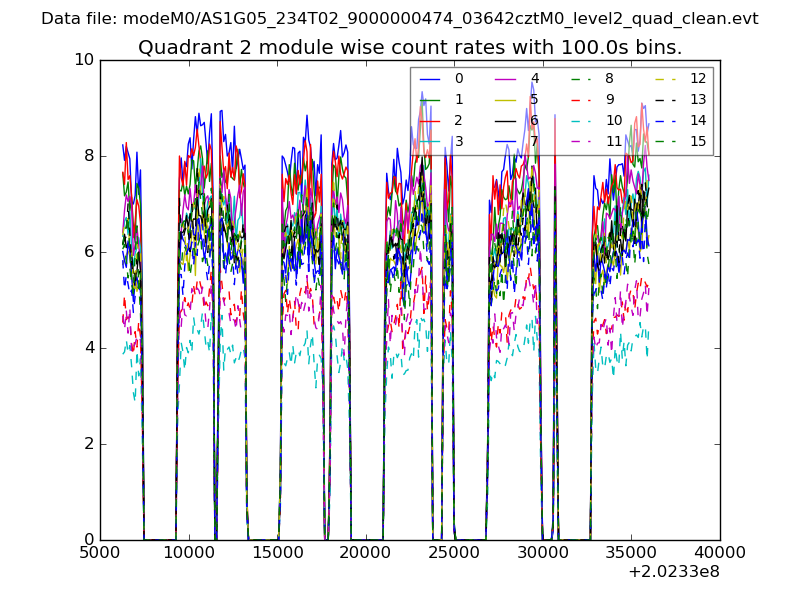 |
 |
| Module-wise count rates for Quadrant D Data is divided into 100 sec bins |
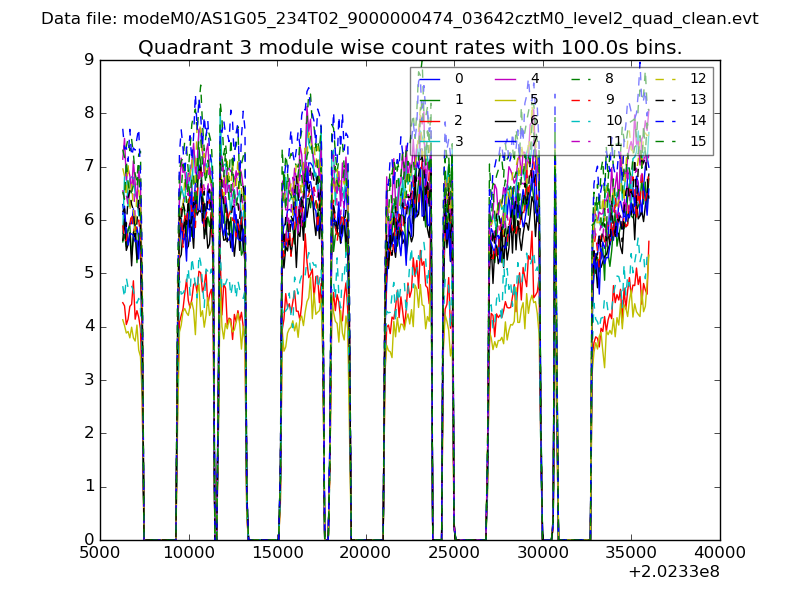 |
 |
| Parameter | Plot |
|---|---|
| CZT HV Monitor | 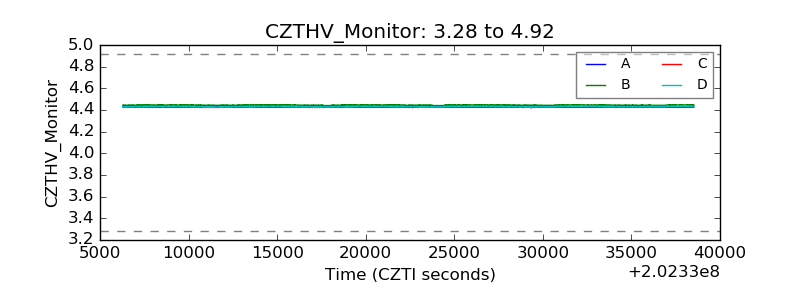 |
| D_VDD | 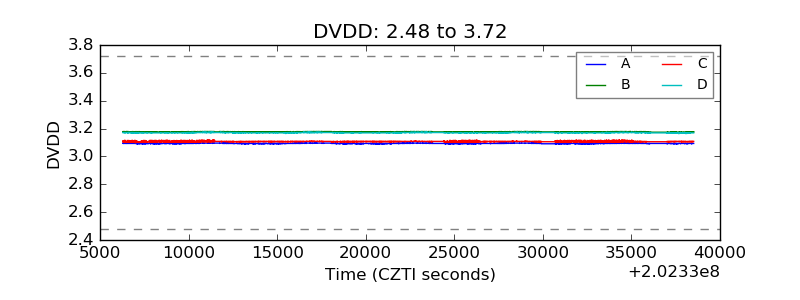 |
| Temperature 1 | 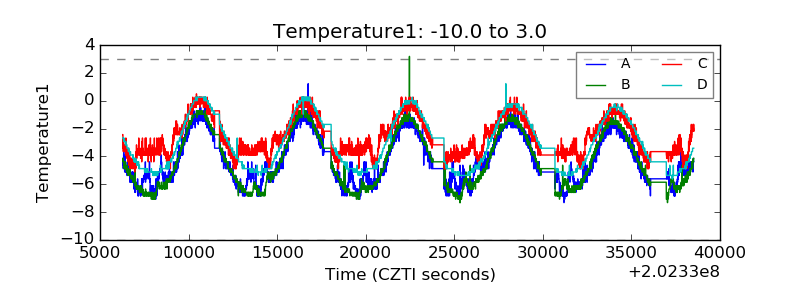 |
| Veto HV Monitor | 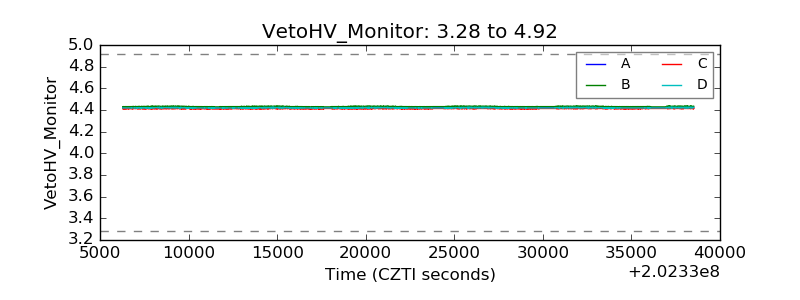 |
| Veto LLD | 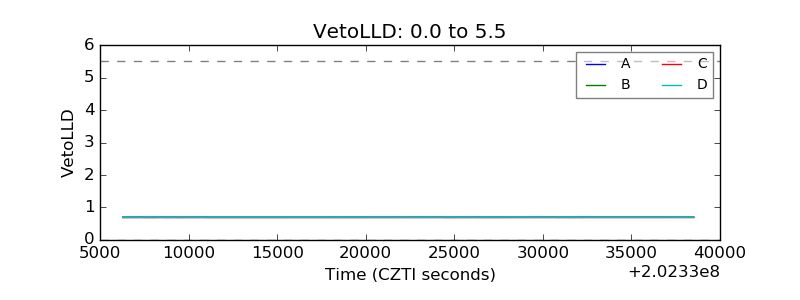 |
| Alpha Counter | 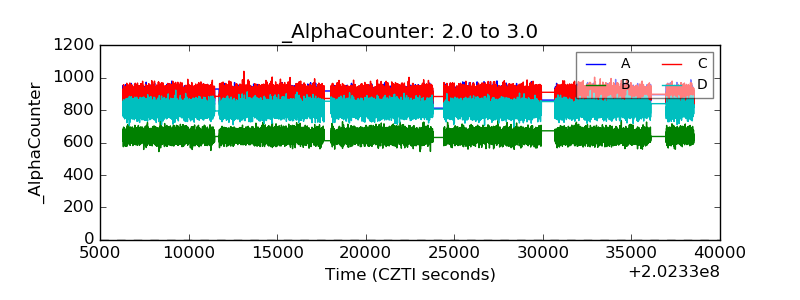 |
| _CPM_Rate | 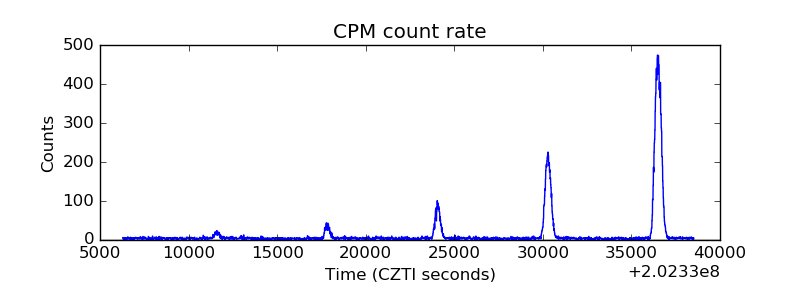 |
| CZT Counter | 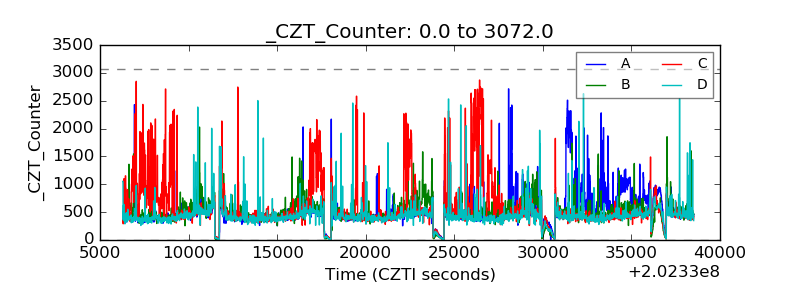 |
| +2.5 Volts monitor |  |
| +5 Volts monitor |  |
| Veto Counter | 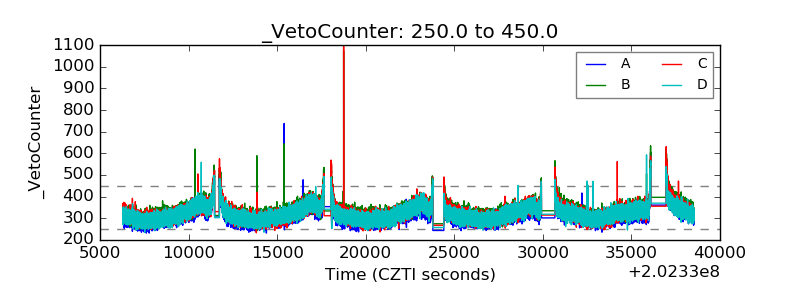 |