| Param | Original file | Final file |
|---|---|---|
| Filename | modeM0/AS1G05_234T02_9000000474_03644cztM0_level2.evt | modeM0/AS1G05_234T02_9000000474_03644cztM0_level2_quad_clean.evt |
| Size (bytes) | 501,327,360 | 70,925,760 |
| Size | 478.1 MB | 67.6 MB |
| Events in quadrant A | 3,682,562 | 417,131 |
| Events in quadrant B | 4,024,607 | 418,586 |
| Events in quadrant C | 3,307,879 | 415,473 |
| Events in quadrant D | 3,688,058 | 404,292 |
| Mode M9 | |||
|---|---|---|---|
| Quadrant | BADHDUFLAG | Total packets | Discarded packets |
| A | 0 | 19 | 0 |
| B | 0 | 19 | 0 |
| C | 0 | 19 | 0 |
| D | 0 | 19 | 0 |
| Mode SS | |||
|---|---|---|---|
| Quadrant | BADHDUFLAG | Total packets | Discarded packets |
| A | 0 | 144 | 0 |
| B | 0 | 144 | 0 |
| C | 0 | 144 | 0 |
| D | 0 | 144 | 0 |
| Mode M0 | |||
|---|---|---|---|
| Quadrant | BADHDUFLAG | Total packets | Discarded packets |
| A | 0 | 15467 | 3 |
| B | 0 | 16357 | 2 |
| C | 0 | 14793 | 2 |
| D | 0 | 16081 | 2 |
| Quadrant | Total seconds | Saturated seconds | Saturation percentage |
|---|---|---|---|
| A | 7064 | 192 | 2.718007% |
| B | 7064 | 231 | 3.270102% |
| C | 7064 | 131 | 1.854473% |
| D | 7064 | 225 | 3.185164% |
Noise dominated data is calculated using 1-second bins in cleaned event files. If a bin has >2000 counts, and if more than 50% of those come from <1% of pixels, then it is considered to be noise-dominated and hence unusable.
| Quadrant | # 1 sec bins | Bins with >0 counts | Bins with >2000 counts | High rate bins dominated by noise | Noise dominated (total time) | Noise dominated (detector-on time) | Marked lightcurve |
|---|---|---|---|---|---|---|---|
| A | 8929 | 7065 | 23 | 23 | 0.26% | 0.33% | 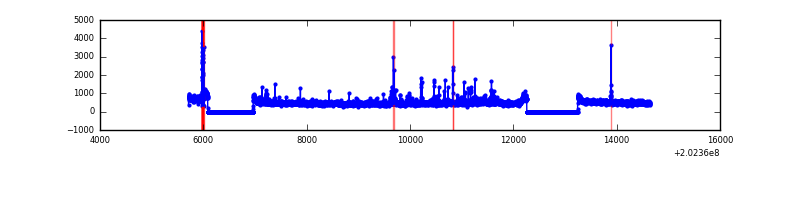 |
| B | 8929 | 7065 | 44 | 44 | 0.49% | 0.62% |  |
| C | 8929 | 7066 | 17 | 17 | 0.19% | 0.24% | 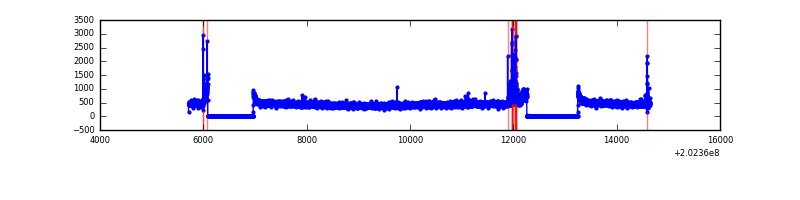 |
| D | 8929 | 7065 | 111 | 111 | 1.24% | 1.57% | 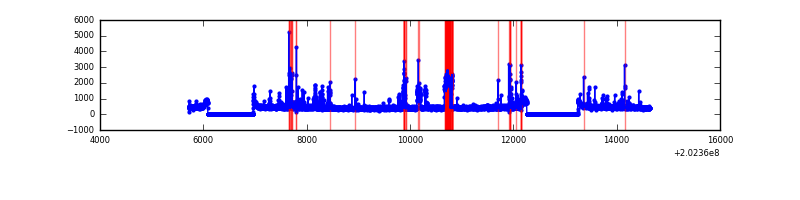 |
Top three noisy pixels from each quadrant. If the there are fewer than three noisy pixels in the level2.evt file, extra rows are filled as -1
| Pixel properties | Quadrant properties | ||||||
|---|---|---|---|---|---|---|---|
| Quadrant | DetID | PixID | Counts | Sigma | Mean | Median | Sigma |
| A | 13 | 251 | 328868 | 1926.83 | 832 | 813 | 170.3 |
| A | 8 | 192 | 66882 | 388.06 | 832 | 813 | 170.3 |
| A | 13 | 164 | 30977 | 177.17 | 832 | 813 | 170.3 |
| B | 4 | 81 | 319076 | 1940.37 | 841 | 817 | 164.0 |
| B | 15 | 204 | 184031 | 1117.02 | 841 | 817 | 164.0 |
| B | 5 | 172 | 85853 | 518.45 | 841 | 817 | 164.0 |
| C | 9 | 247 | 119279 | 627.99 | 808 | 809 | 188.6 |
| C | 1 | 16 | 10401 | 50.85 | 808 | 809 | 188.6 |
| C | 13 | 61 | 6977 | 32.7 | 808 | 809 | 188.6 |
| D | 1 | 84 | 295658 | 1518.8 | 806 | 782 | 194.2 |
| D | 13 | 239 | 143113 | 733.1 | 806 | 782 | 194.2 |
| D | 13 | 223 | 115090 | 588.76 | 806 | 782 | 194.2 |
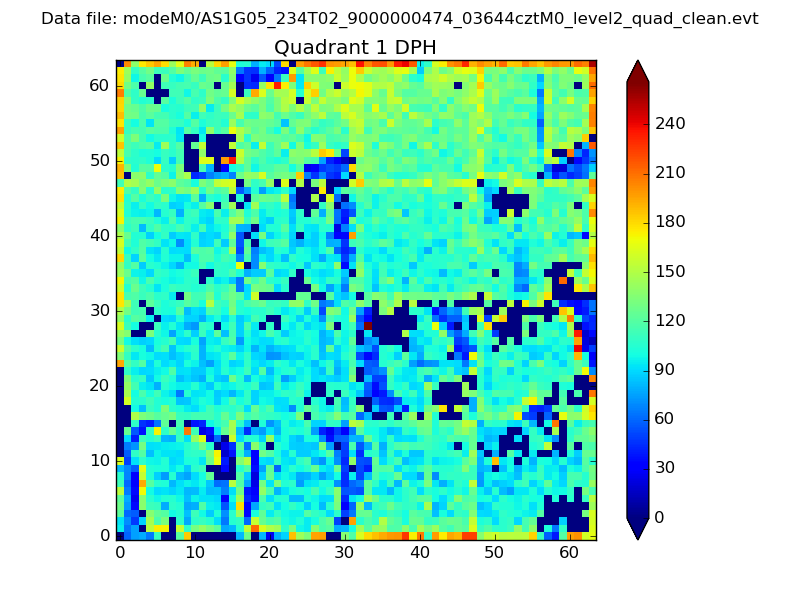
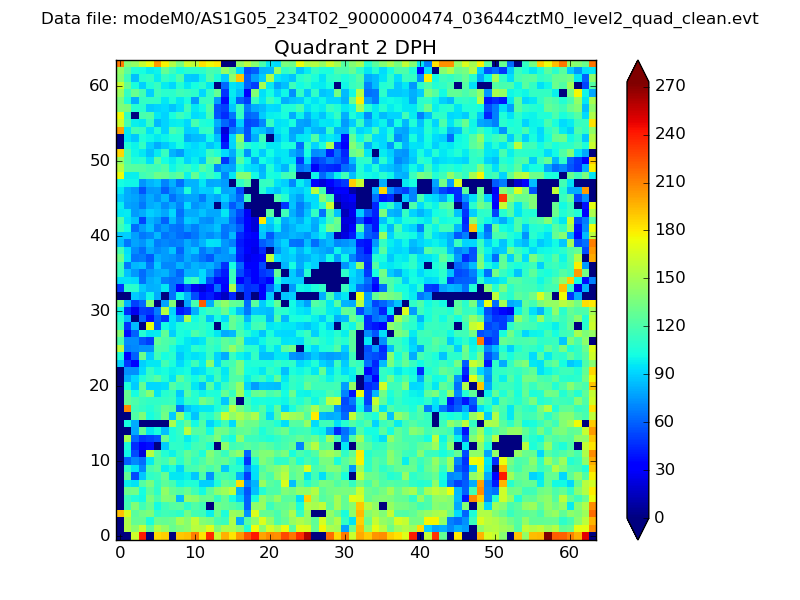
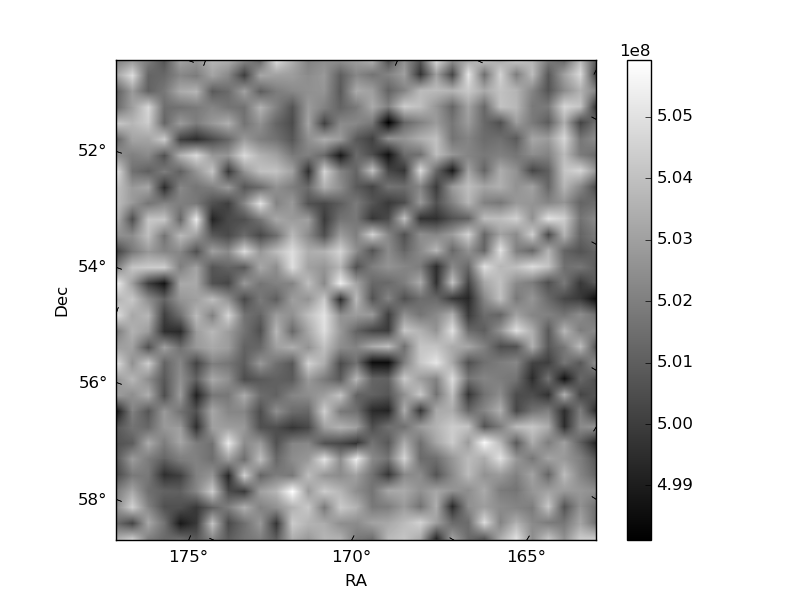
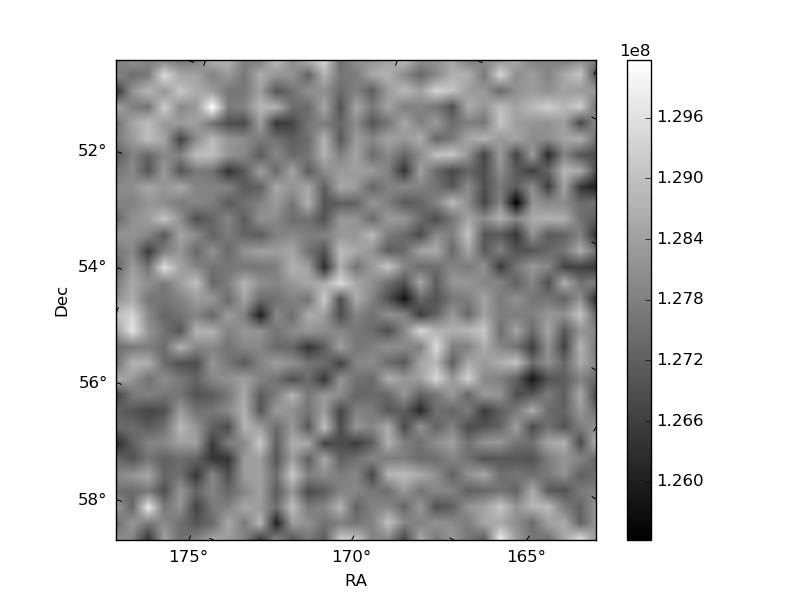
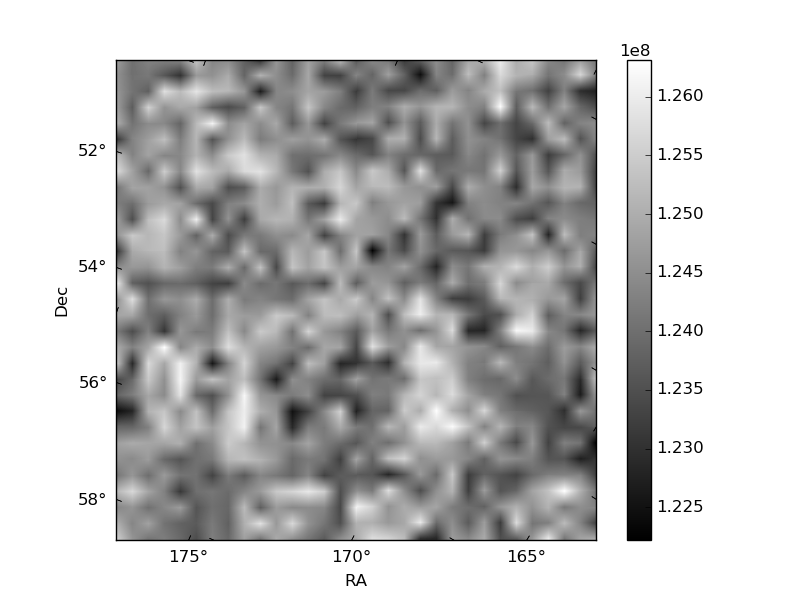
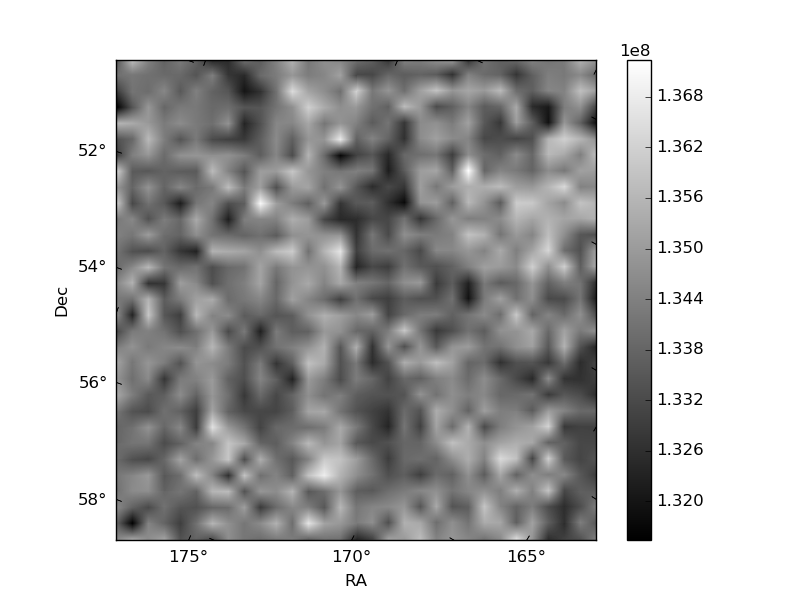
Histogram calculated using DETX and DETY for each event in the final _common_clean file
| Quadrant A | 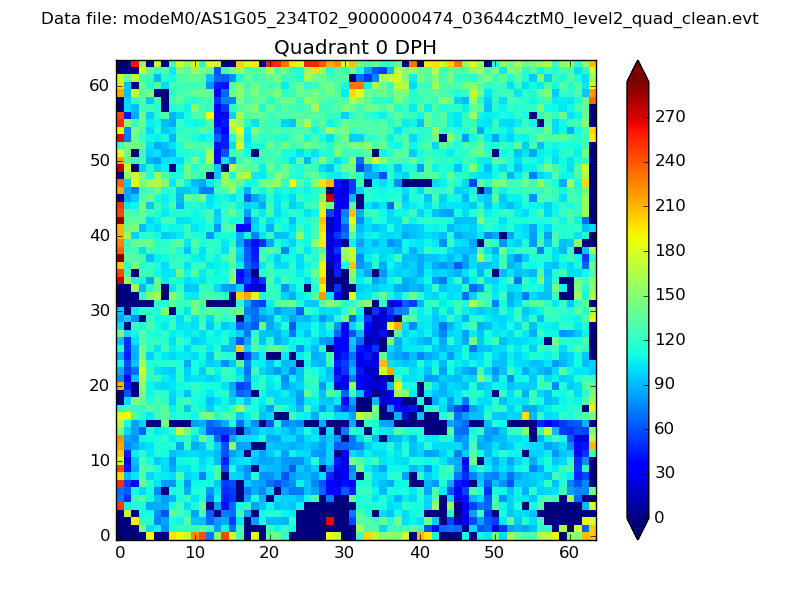 |
 |
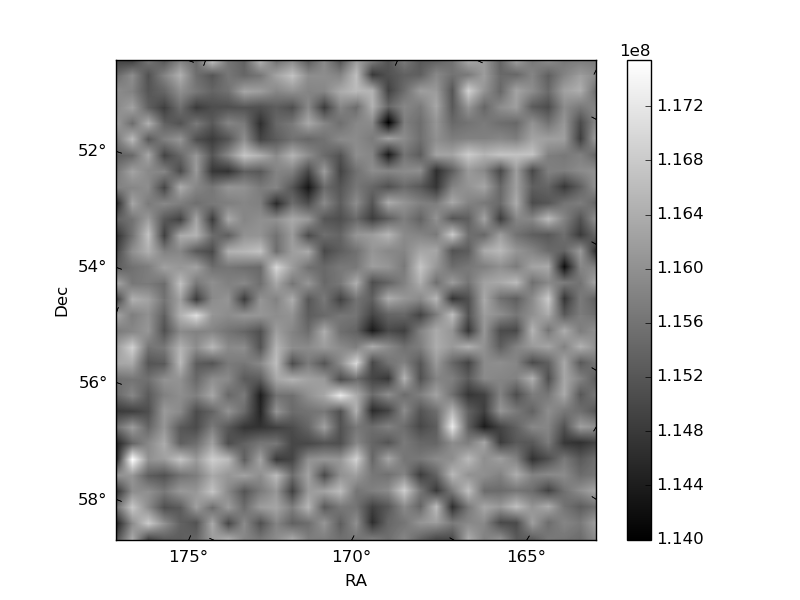
Quadrant B |
|---|---|---|---|
| Quadrant D | 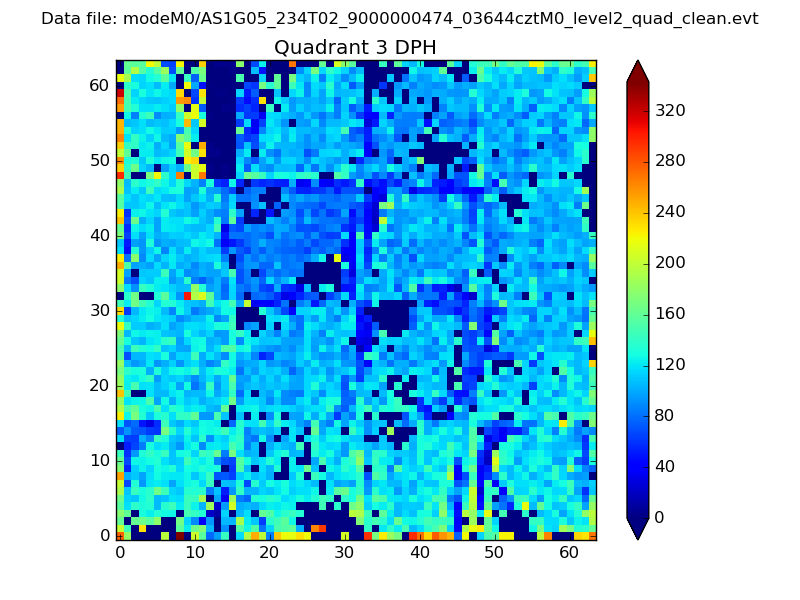 |
 |
Quadrant C |
| Plot type | Count rate plots | Images |
|---|---|---|
| Comparison with Poisson distribution Blue bars denote a histogram of data divided into 1 sec bins. Red curve is a Poisson curve with rate = median count rate of data. |
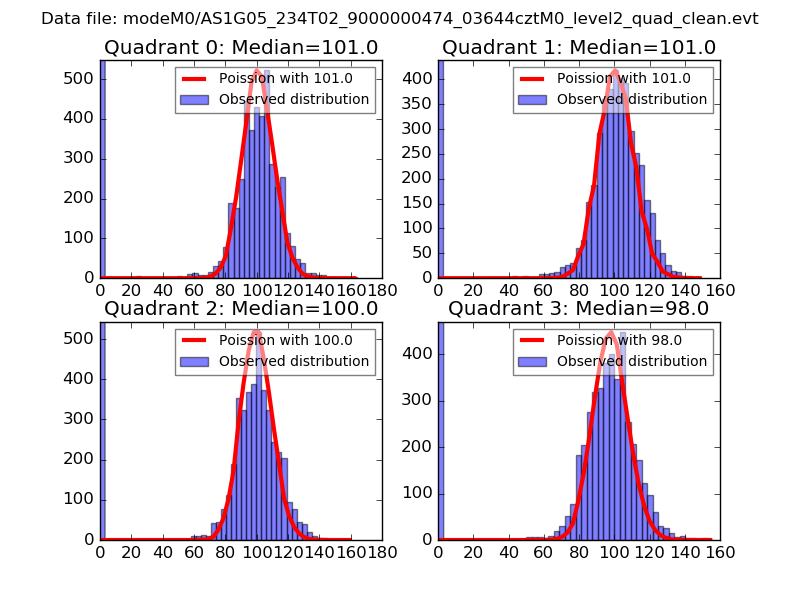 |
 |
| Quadrant-wise count rates Data is divided into 100 sec bins |
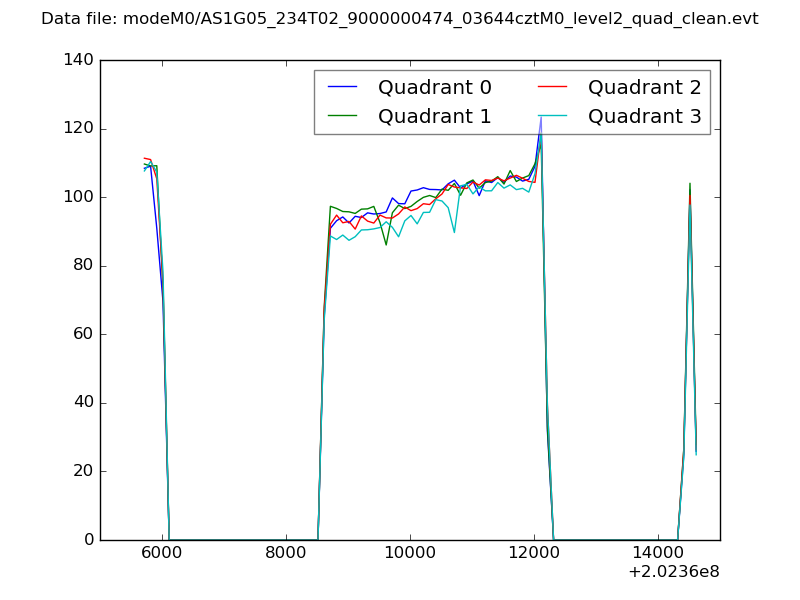 |
|
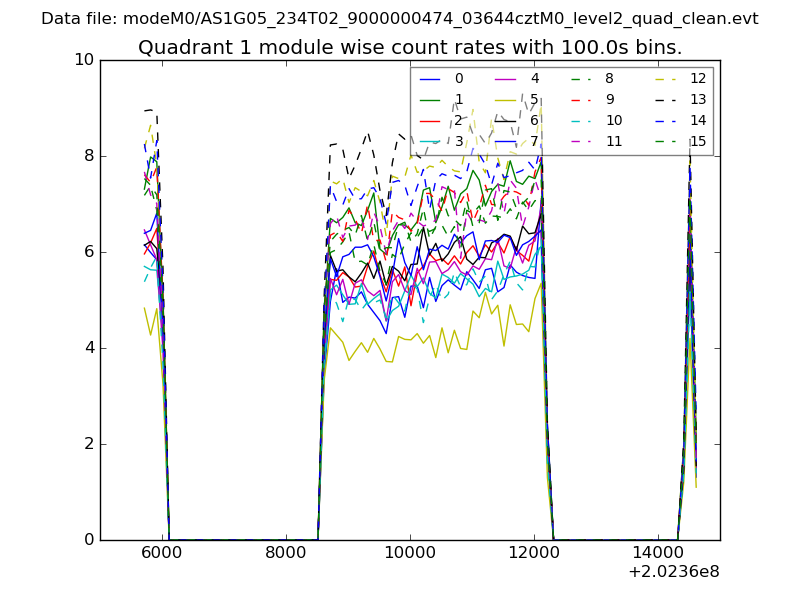
| Module-wise count rates for Quadrant A Data is divided into 100 sec bins |
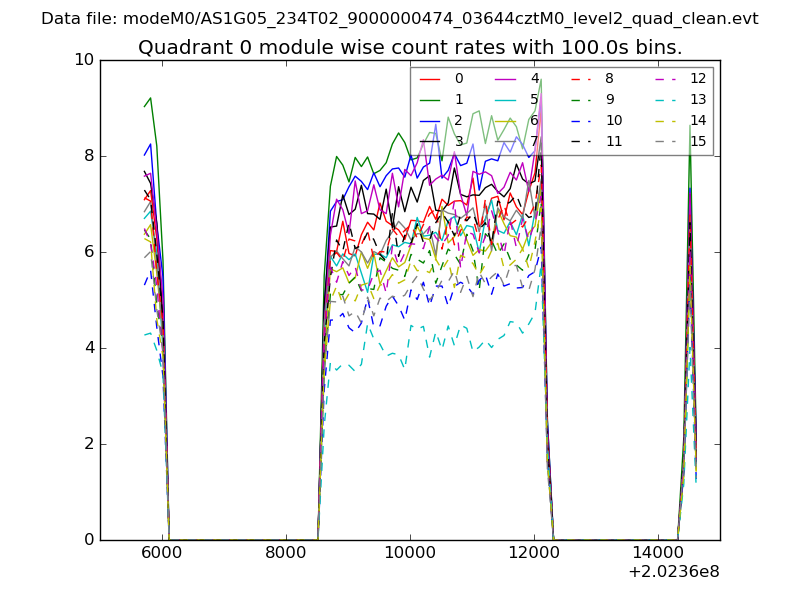 |
 |
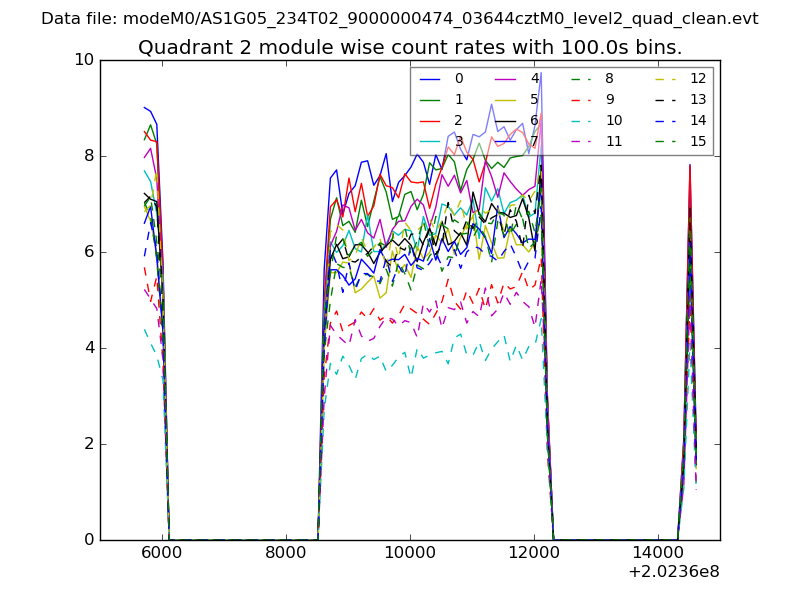
| Module-wise count rates for Quadrant B Data is divided into 100 sec bins |
 |
 |
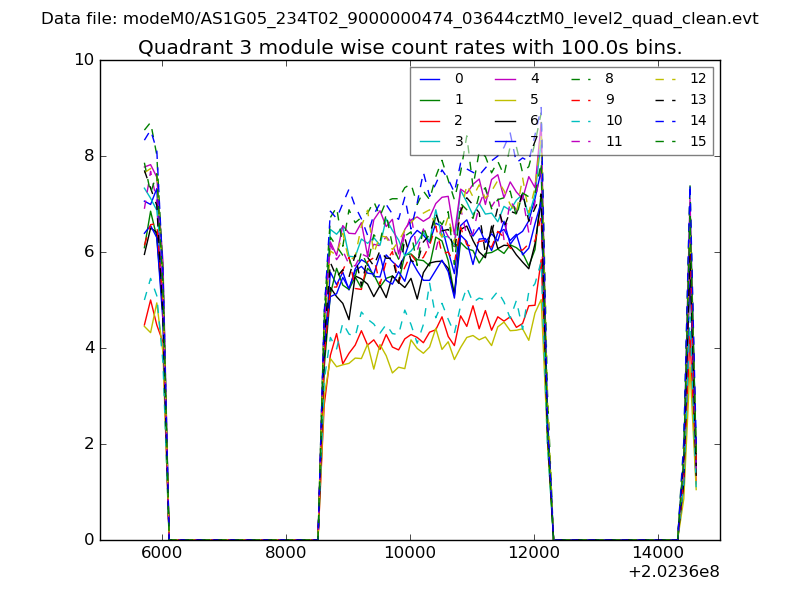
| Module-wise count rates for Quadrant C Data is divided into 100 sec bins |
 |
 |
| Module-wise count rates for Quadrant D Data is divided into 100 sec bins |
 |
 |
| Parameter | Plot |
|---|---|
| CZT HV Monitor | 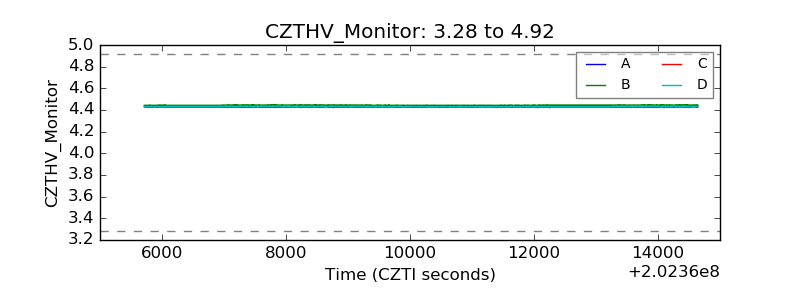 |
| D_VDD | 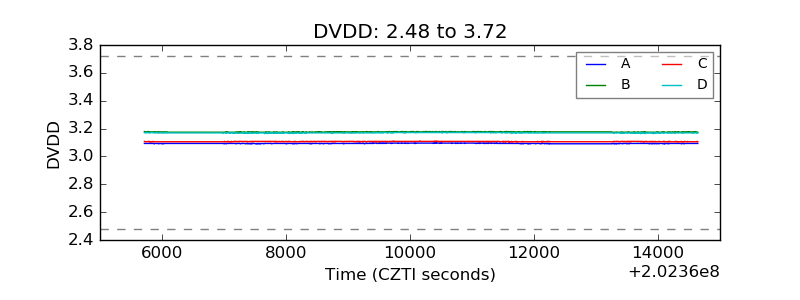 |
| Temperature 1 |  |
| Veto HV Monitor | 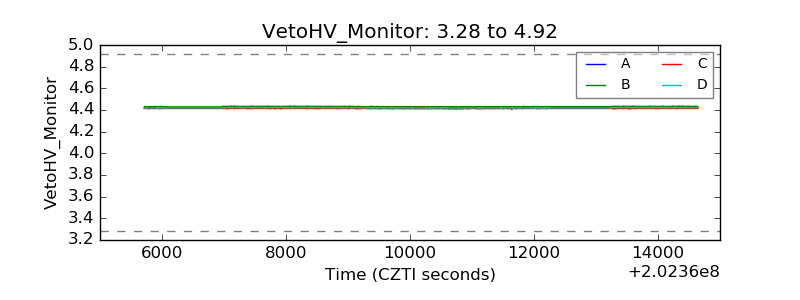 |
| Veto LLD |  |
| Alpha Counter | 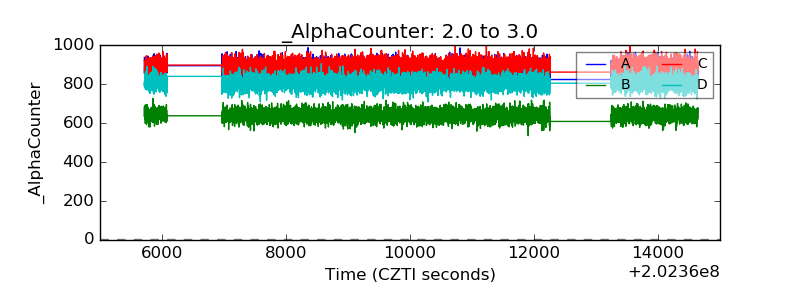 |
| _CPM_Rate | 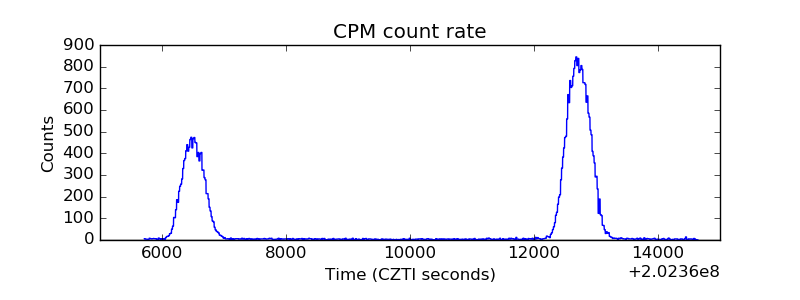 |
| CZT Counter | 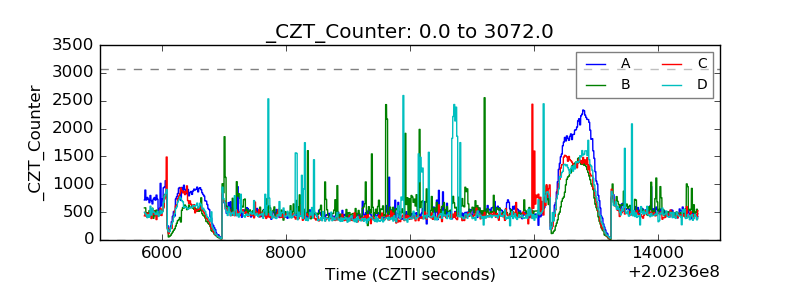 |
| +2.5 Volts monitor | 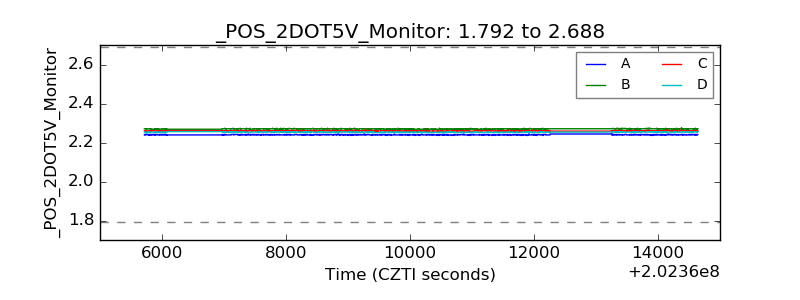 |
| +5 Volts monitor |  |
| Veto Counter | 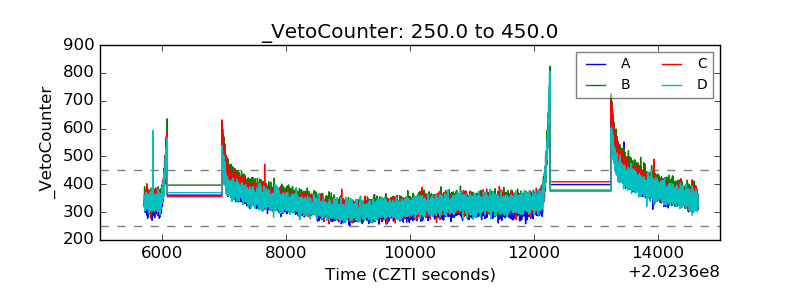 |