| Param | Original file | Final file |
|---|---|---|
| Filename | modeM0/AS1G05_234T02_9000000474_03645cztM0_level2.evt | modeM0/AS1G05_234T02_9000000474_03645cztM0_level2_quad_clean.evt |
| Size (bytes) | 457,591,680 | 75,911,040 |
| Size | 436.4 MB | 72.4 MB |
| Events in quadrant A | 3,259,030 | 466,964 |
| Events in quadrant B | 3,954,201 | 465,708 |
| Events in quadrant C | 3,088,804 | 459,452 |
| Events in quadrant D | 3,110,163 | 448,781 |
| Mode M9 | |||
|---|---|---|---|
| Quadrant | BADHDUFLAG | Total packets | Discarded packets |
| A | 0 | 13 | 0 |
| B | 0 | 13 | 0 |
| C | 0 | 13 | 0 |
| D | 0 | 14 | 0 |
| Mode SS | |||
|---|---|---|---|
| Quadrant | BADHDUFLAG | Total packets | Discarded packets |
| A | 0 | 132 | 0 |
| B | 0 | 132 | 0 |
| C | 0 | 132 | 0 |
| D | 0 | 132 | 0 |
| Mode M0 | |||
|---|---|---|---|
| Quadrant | BADHDUFLAG | Total packets | Discarded packets |
| A | 0 | 14041 | 3 |
| B | 0 | 16009 | 2 |
| C | 0 | 13576 | 2 |
| D | 0 | 13843 | 2 |
| Quadrant | Total seconds | Saturated seconds | Saturation percentage |
|---|---|---|---|
| A | 6567 | 142 | 2.162327% |
| B | 6567 | 109 | 1.659814% |
| C | 6567 | 65 | 0.989797% |
| D | 6567 | 79 | 1.202985% |
Noise dominated data is calculated using 1-second bins in cleaned event files. If a bin has >2000 counts, and if more than 50% of those come from <1% of pixels, then it is considered to be noise-dominated and hence unusable.
| Quadrant | # 1 sec bins | Bins with >0 counts | Bins with >2000 counts | High rate bins dominated by noise | Noise dominated (total time) | Noise dominated (detector-on time) | Marked lightcurve |
|---|---|---|---|---|---|---|---|
| A | 7682 | 6568 | 17 | 17 | 0.22% | 0.26% | 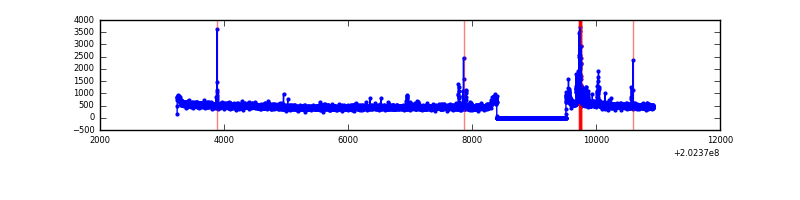 |
| B | 7682 | 6568 | 9 | 9 | 0.12% | 0.14% | 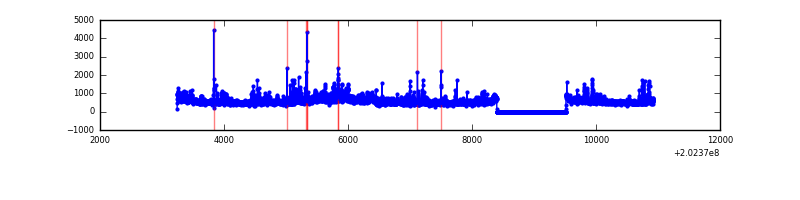 |
| C | 7682 | 6568 | 1 | 1 | 0.01% | 0.02% | 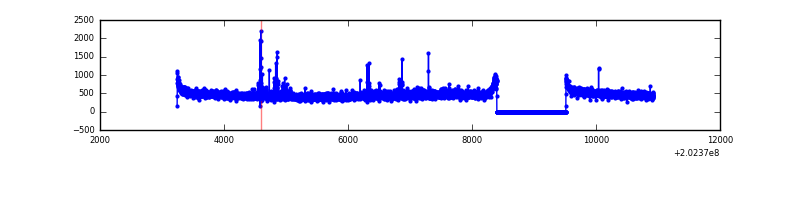 |
| D | 7682 | 6568 | 14 | 14 | 0.18% | 0.21% | 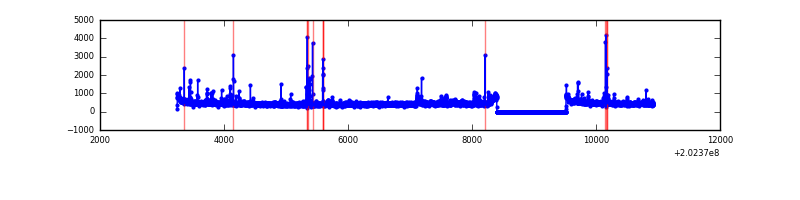 |
Top three noisy pixels from each quadrant. If the there are fewer than three noisy pixels in the level2.evt file, extra rows are filled as -1
| Pixel properties | Quadrant properties | ||||||
|---|---|---|---|---|---|---|---|
| Quadrant | DetID | PixID | Counts | Sigma | Mean | Median | Sigma |
| A | 13 | 251 | 132636 | 817.1 | 790 | 773 | 161.4 |
| A | 13 | 164 | 39309 | 238.79 | 790 | 773 | 161.4 |
| A | 0 | 50 | 19612 | 116.74 | 790 | 773 | 161.4 |
| B | 15 | 204 | 357671 | 2313.9 | 796 | 776 | 154.2 |
| B | 4 | 81 | 204066 | 1318.02 | 796 | 776 | 154.2 |
| B | 3 | 0 | 124962 | 805.15 | 796 | 776 | 154.2 |
| C | 2 | 53 | 57216 | 320.48 | 760 | 762 | 176.2 |
| C | 9 | 247 | 41065 | 228.79 | 760 | 762 | 176.2 |
| C | 12 | 4 | 8984 | 46.67 | 760 | 762 | 176.2 |
| D | 2 | 37 | 69251 | 375.0 | 761 | 739 | 182.7 |
| D | 13 | 239 | 48245 | 260.02 | 761 | 739 | 182.7 |
| D | 13 | 223 | 29802 | 159.08 | 761 | 739 | 182.7 |
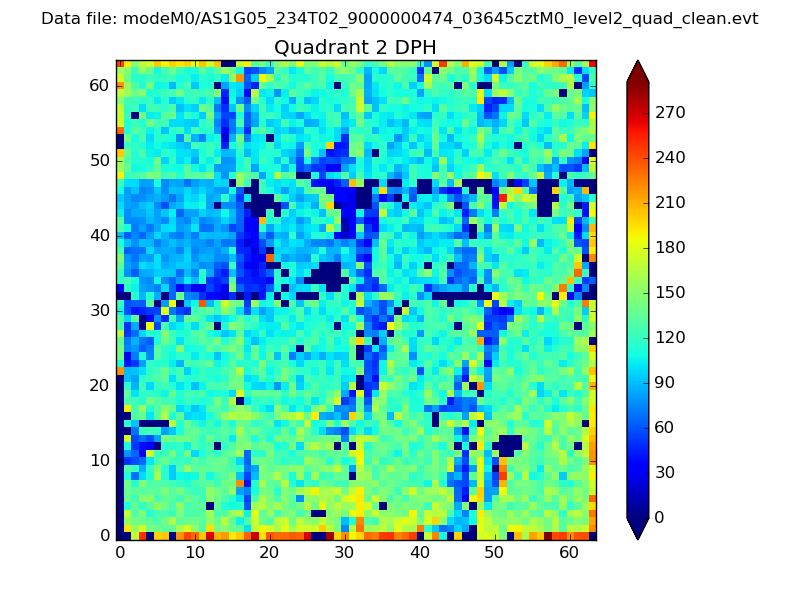
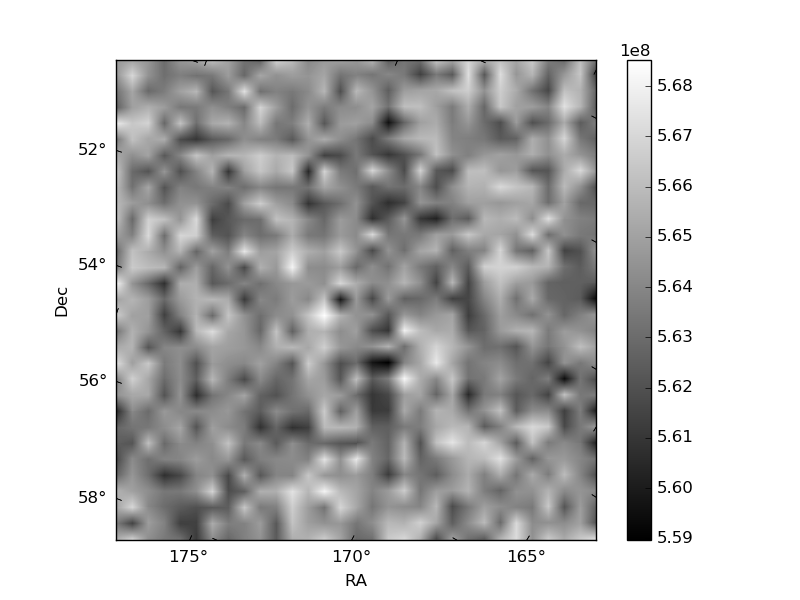
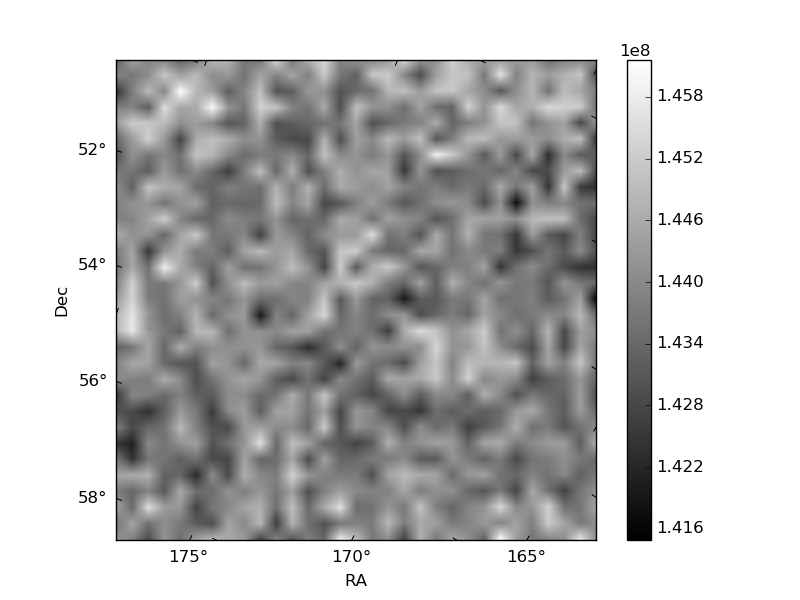
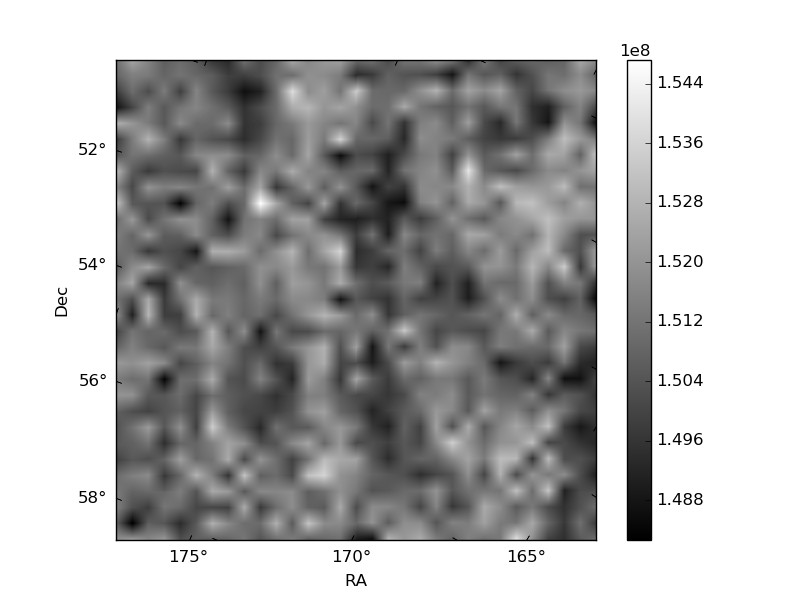
Histogram calculated using DETX and DETY for each event in the final _common_clean file
| Quadrant A | 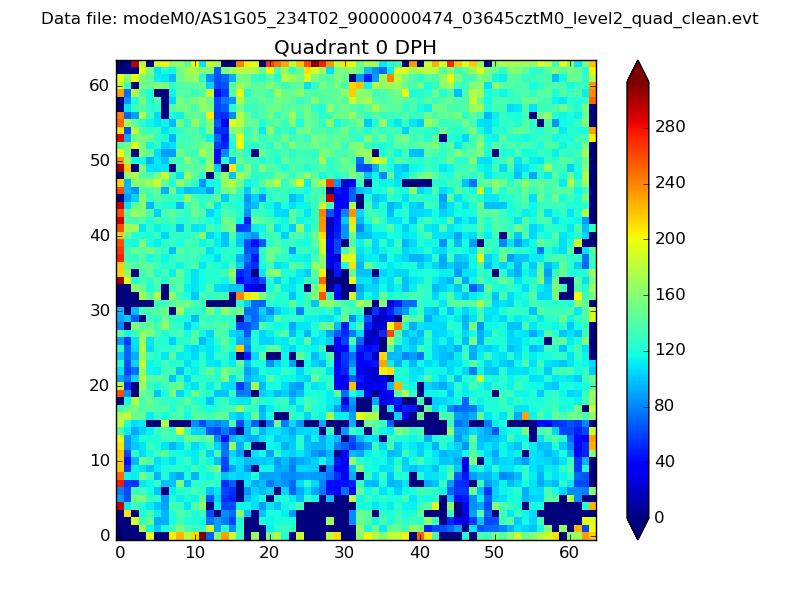 |
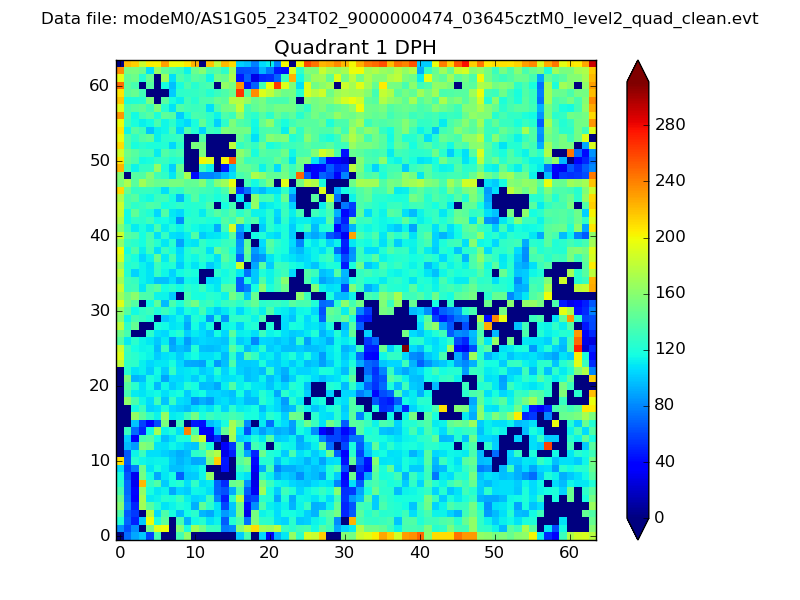 |
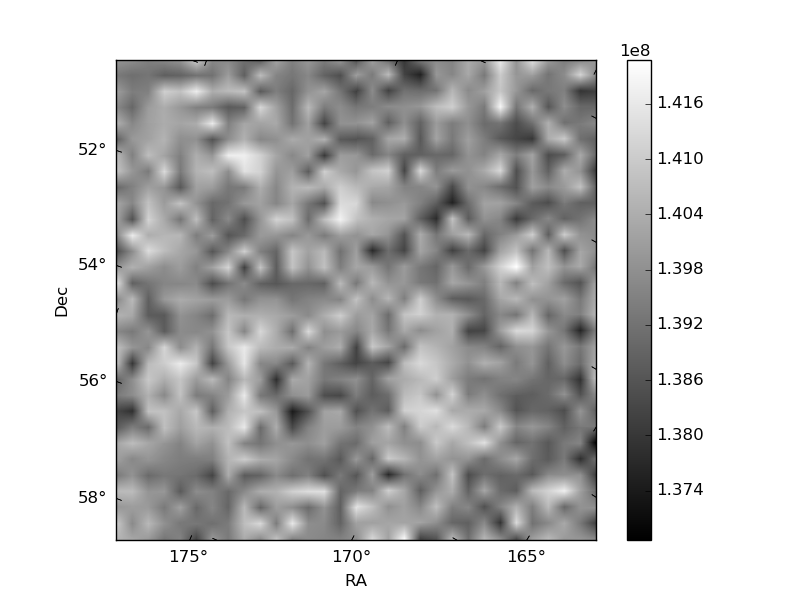
Quadrant B |
|---|---|---|---|
| Quadrant D | 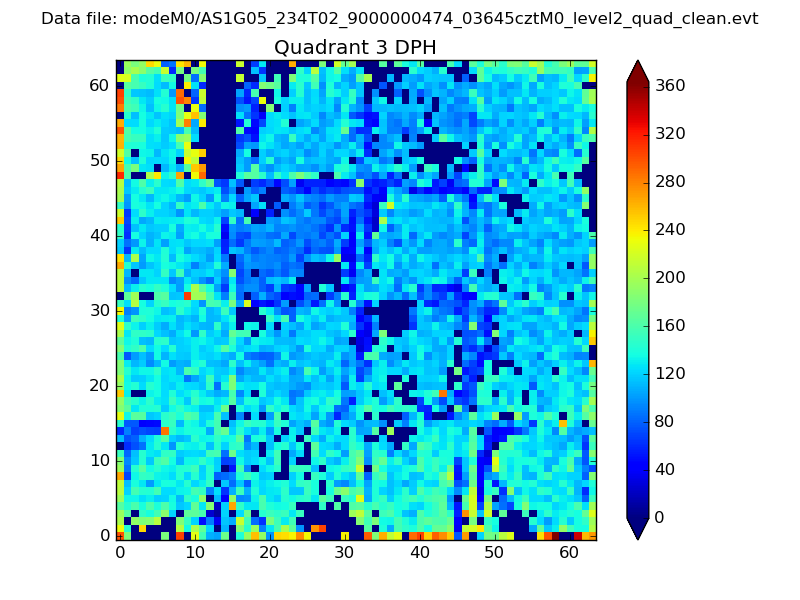 |
 |
Quadrant C |
| Plot type | Count rate plots | Images |
|---|---|---|
| Comparison with Poisson distribution Blue bars denote a histogram of data divided into 1 sec bins. Red curve is a Poisson curve with rate = median count rate of data. |
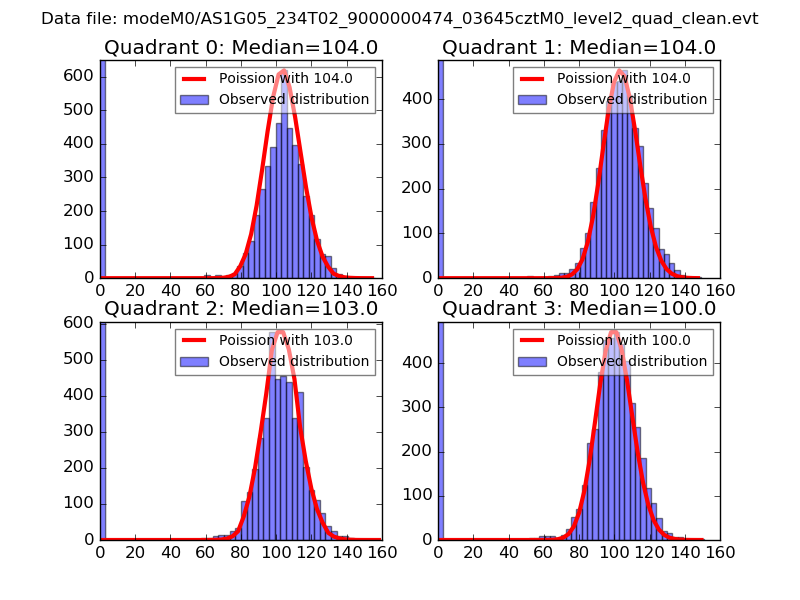 |
 |
| Quadrant-wise count rates Data is divided into 100 sec bins |
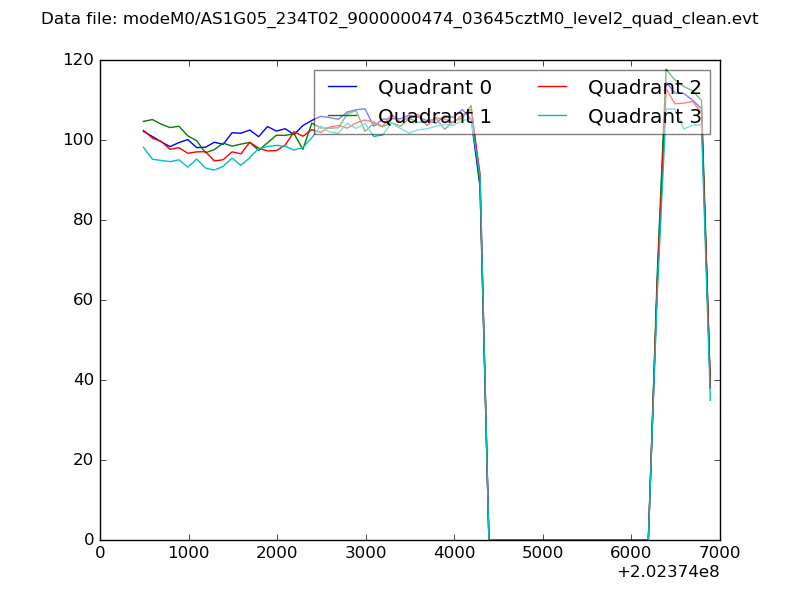 |
|
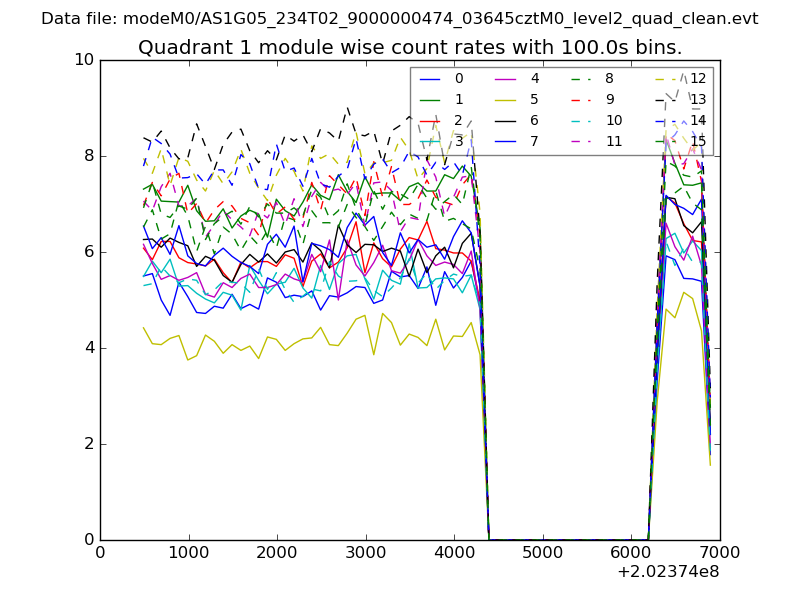
| Module-wise count rates for Quadrant A Data is divided into 100 sec bins |
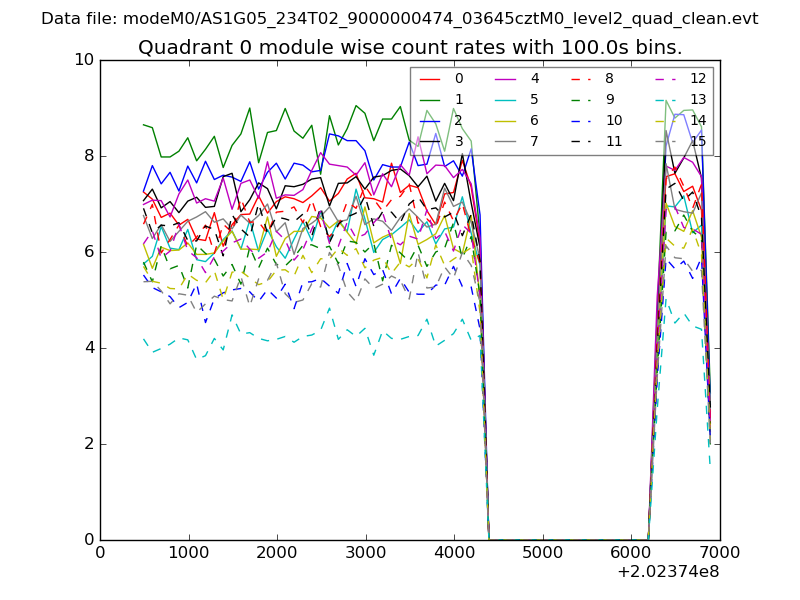 |
 |
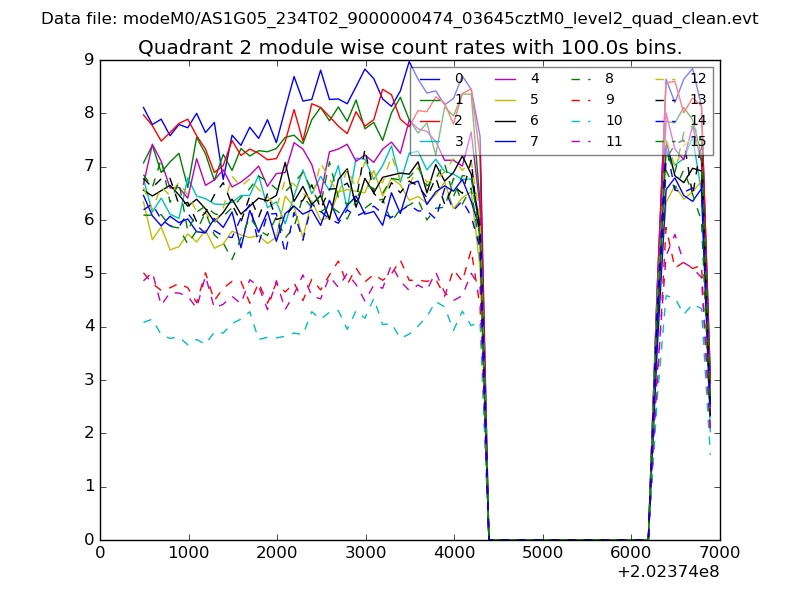
| Module-wise count rates for Quadrant B Data is divided into 100 sec bins |
 |
 |
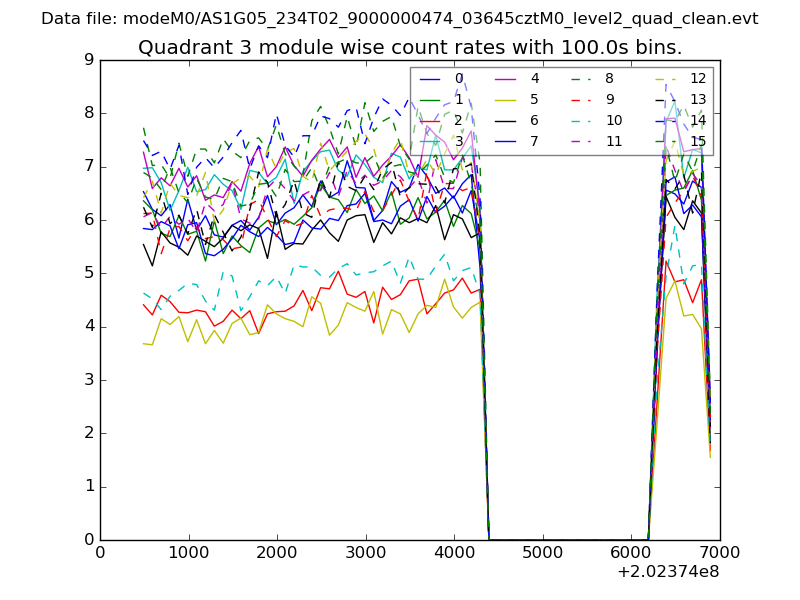
| Module-wise count rates for Quadrant C Data is divided into 100 sec bins |
 |
 |
| Module-wise count rates for Quadrant D Data is divided into 100 sec bins |
 |
 |
| Parameter | Plot |
|---|---|
| CZT HV Monitor | 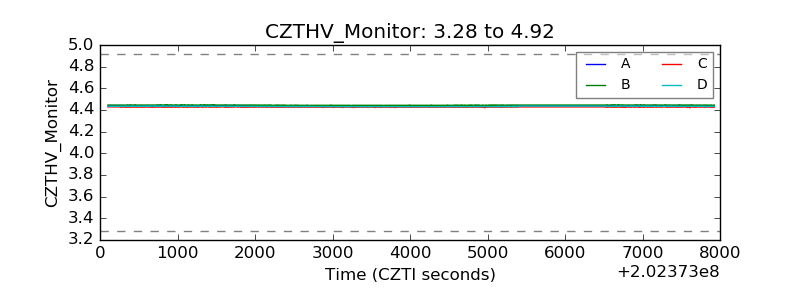 |
| D_VDD | 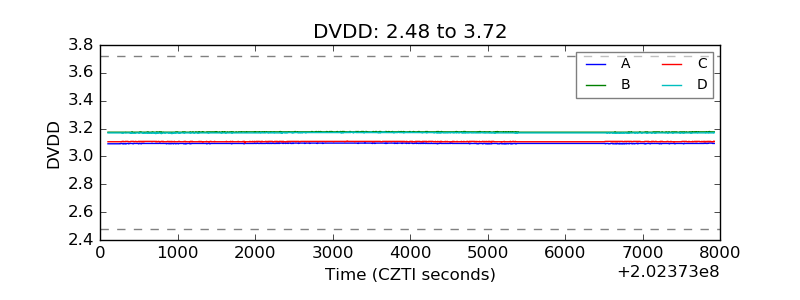 |
| Temperature 1 | 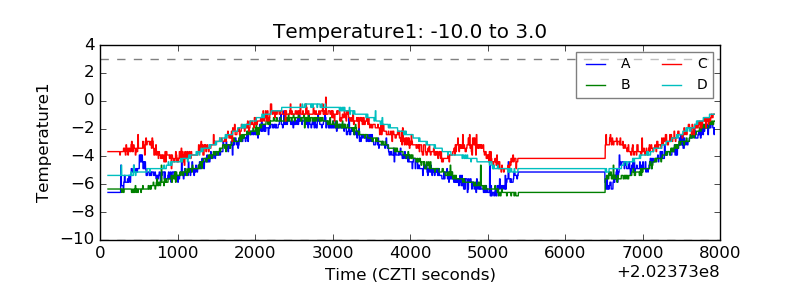 |
| Veto HV Monitor |  |
| Veto LLD | 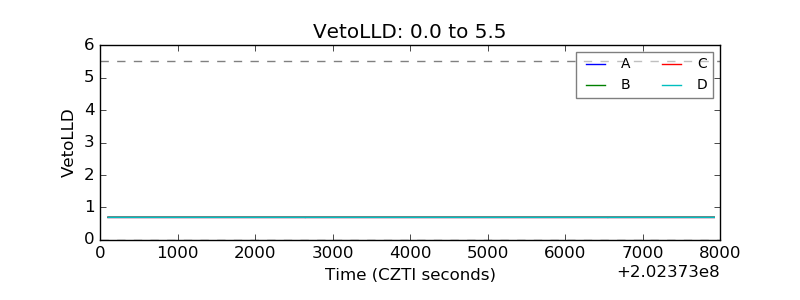 |
| Alpha Counter | 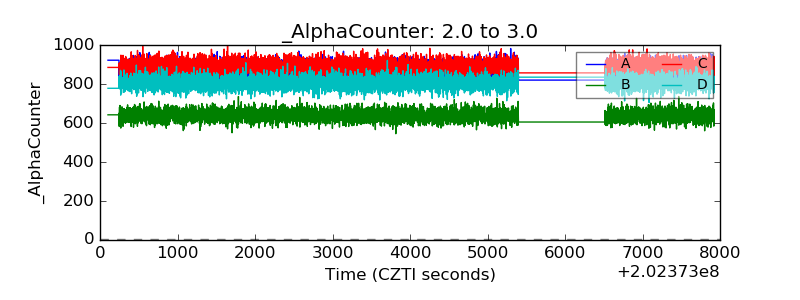 |
| _CPM_Rate | 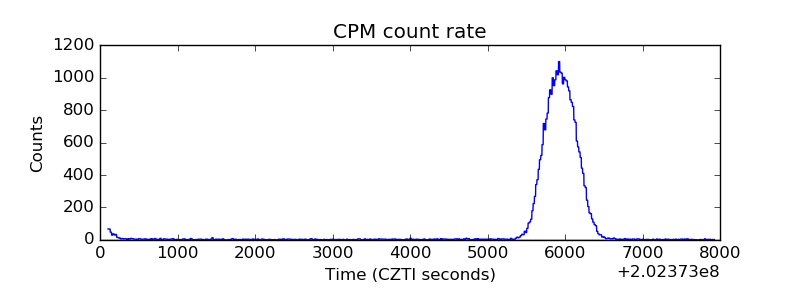 |
| CZT Counter | 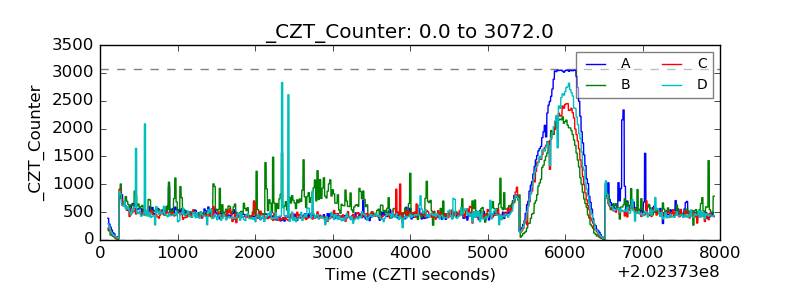 |
| +2.5 Volts monitor |  |
| +5 Volts monitor | 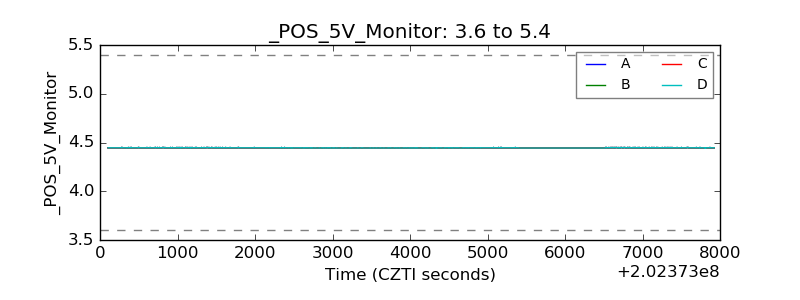 |
| Veto Counter | 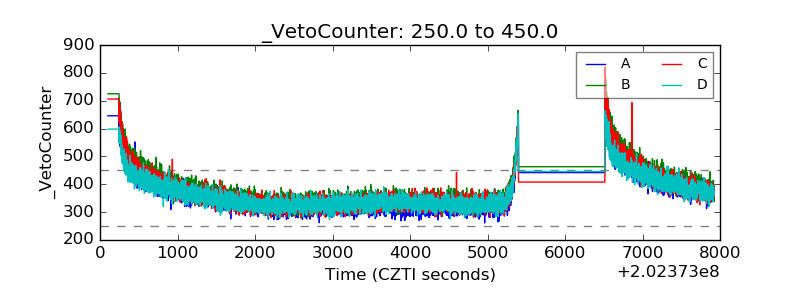 |