| Param | Original file | Final file |
|---|---|---|
| Filename | modeM0/AS1G05_234T02_9000000474_03646cztM0_level2.evt | modeM0/AS1G05_234T02_9000000474_03646cztM0_level2_quad_clean.evt |
| Size (bytes) | 489,657,600 | 83,687,040 |
| Size | 467.0 MB | 79.8 MB |
| Events in quadrant A | 3,385,035 | 532,907 |
| Events in quadrant B | 4,680,314 | 526,211 |
| Events in quadrant C | 3,143,016 | 519,994 |
| Events in quadrant D | 3,184,939 | 507,206 |
| Mode M9 | |||
|---|---|---|---|
| Quadrant | BADHDUFLAG | Total packets | Discarded packets |
| A | 0 | 18 | 0 |
| B | 0 | 18 | 0 |
| C | 0 | 18 | 0 |
| D | 0 | 19 | 0 |
| Mode SS | |||
|---|---|---|---|
| Quadrant | BADHDUFLAG | Total packets | Discarded packets |
| A | 0 | 130 | 0 |
| B | 0 | 130 | 0 |
| C | 0 | 130 | 0 |
| D | 0 | 130 | 0 |
| Mode M0 | |||
|---|---|---|---|
| Quadrant | BADHDUFLAG | Total packets | Discarded packets |
| A | 0 | 14217 | 3 |
| B | 0 | 18137 | 2 |
| C | 0 | 13723 | 2 |
| D | 0 | 13894 | 2 |
| Quadrant | Total seconds | Saturated seconds | Saturation percentage |
|---|---|---|---|
| A | 6421 | 137 | 2.133624% |
| B | 6421 | 483 | 7.522193% |
| C | 6421 | 88 | 1.370503% |
| D | 6421 | 75 | 1.168042% |
Noise dominated data is calculated using 1-second bins in cleaned event files. If a bin has >2000 counts, and if more than 50% of those come from <1% of pixels, then it is considered to be noise-dominated and hence unusable.
| Quadrant | # 1 sec bins | Bins with >0 counts | Bins with >2000 counts | High rate bins dominated by noise | Noise dominated (total time) | Noise dominated (detector-on time) | Marked lightcurve |
|---|---|---|---|---|---|---|---|
| A | 7626 | 6422 | 26 | 26 | 0.34% | 0.40% | 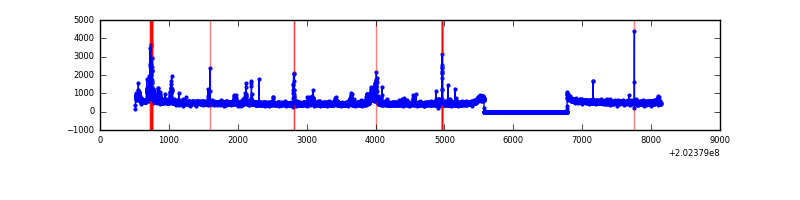 |
| B | 7626 | 6422 | 216 | 216 | 2.83% | 3.36% | 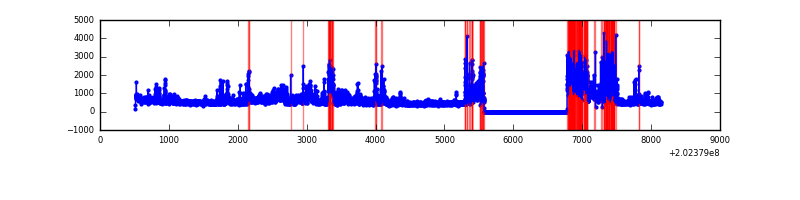 |
| C | 7626 | 6422 | 10 | 10 | 0.13% | 0.16% | 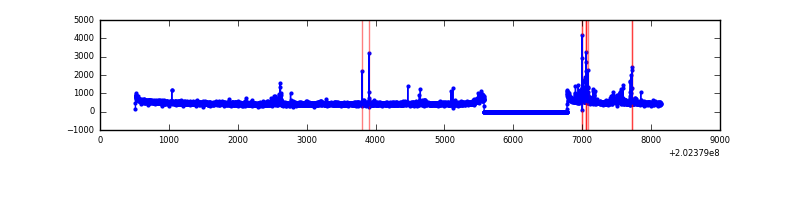 |
| D | 7626 | 6422 | 11 | 11 | 0.14% | 0.17% | 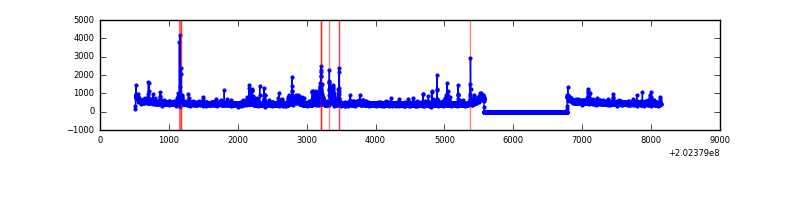 |
Top three noisy pixels from each quadrant. If the there are fewer than three noisy pixels in the level2.evt file, extra rows are filled as -1
| Pixel properties | Quadrant properties | ||||||
|---|---|---|---|---|---|---|---|
| Quadrant | DetID | PixID | Counts | Sigma | Mean | Median | Sigma |
| A | 13 | 251 | 269022 | 1675.09 | 790 | 772 | 160.1 |
| A | 0 | 50 | 29571 | 179.84 | 790 | 772 | 160.1 |
| A | 15 | 174 | 13862 | 81.74 | 790 | 772 | 160.1 |
| B | 5 | 172 | 902841 | 6086.95 | 769 | 750 | 148.2 |
| B | 15 | 204 | 354725 | 2388.48 | 769 | 750 | 148.2 |
| B | 4 | 81 | 191175 | 1284.91 | 769 | 750 | 148.2 |
| C | 2 | 53 | 80285 | 452.49 | 758 | 762 | 175.7 |
| C | 9 | 247 | 60729 | 341.22 | 758 | 762 | 175.7 |
| C | 12 | 4 | 17271 | 93.94 | 758 | 762 | 175.7 |
| D | 1 | 84 | 112576 | 622.38 | 762 | 742 | 179.7 |
| D | 12 | 110 | 62495 | 343.67 | 762 | 742 | 179.7 |
| D | 13 | 223 | 28115 | 152.34 | 762 | 742 | 179.7 |
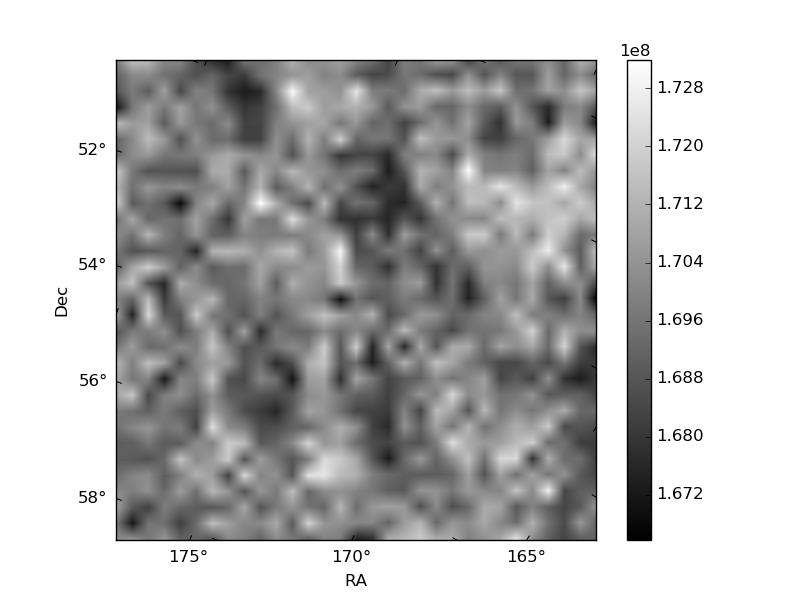
Histogram calculated using DETX and DETY for each event in the final _common_clean file
| Quadrant A |  |
 |
Quadrant B |
|---|---|---|---|
| Quadrant D |  |
 |
Quadrant C |
| Plot type | Count rate plots | Images |
|---|---|---|
| Comparison with Poisson distribution Blue bars denote a histogram of data divided into 1 sec bins. Red curve is a Poisson curve with rate = median count rate of data. |
 |
 |
| Quadrant-wise count rates Data is divided into 100 sec bins |
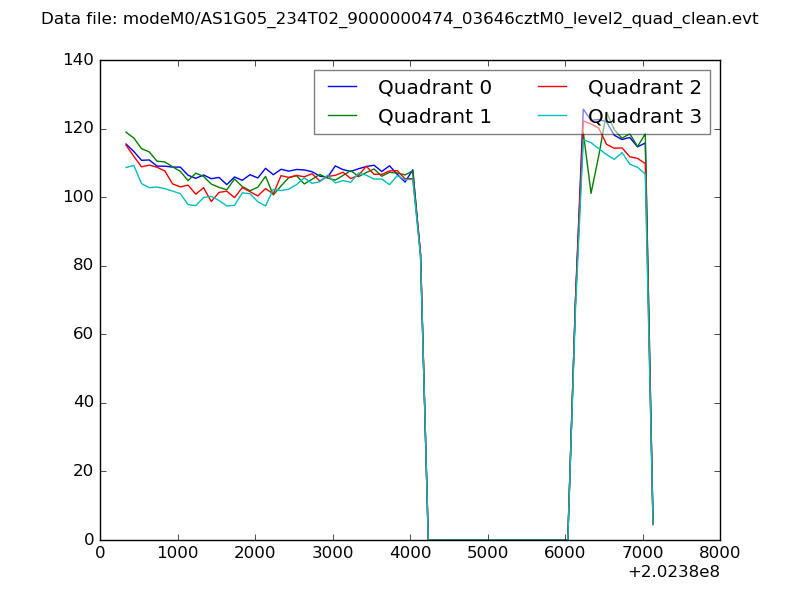 |
|
| Module-wise count rates for Quadrant A Data is divided into 100 sec bins |
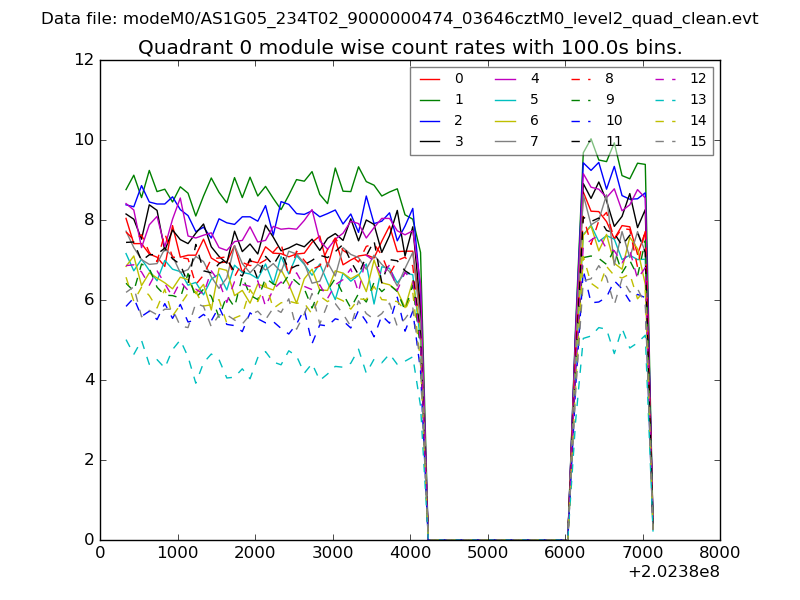 |
 |
| Module-wise count rates for Quadrant B Data is divided into 100 sec bins |
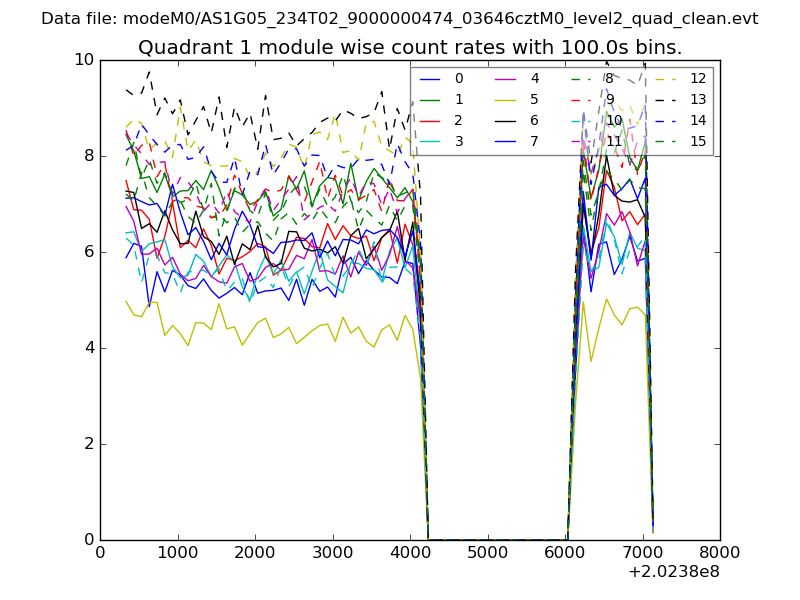 |
 |
| Module-wise count rates for Quadrant C Data is divided into 100 sec bins |
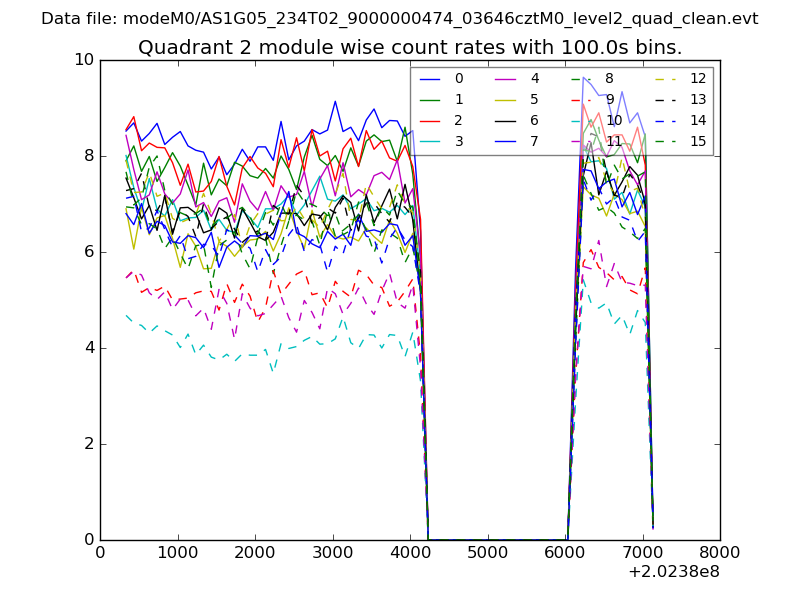 |
 |
| Module-wise count rates for Quadrant D Data is divided into 100 sec bins |
 |
 |
| Parameter | Plot |
|---|---|
| CZT HV Monitor | 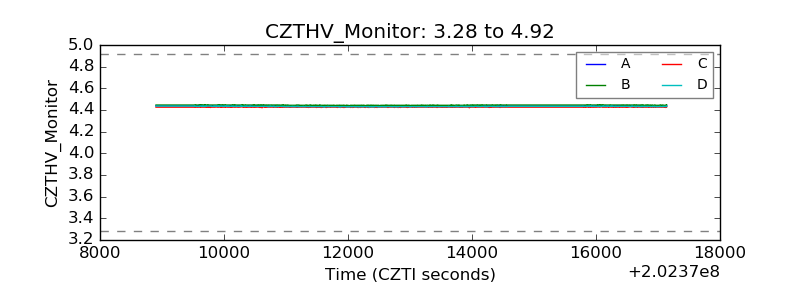 |
| D_VDD |  |
| Temperature 1 |  |
| Veto HV Monitor |  |
| Veto LLD |  |
| Alpha Counter | 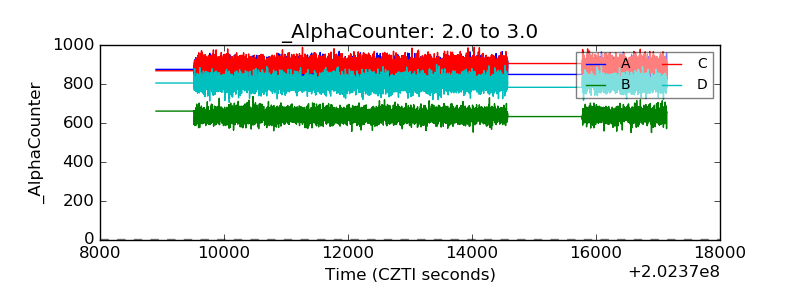 |
| _CPM_Rate | 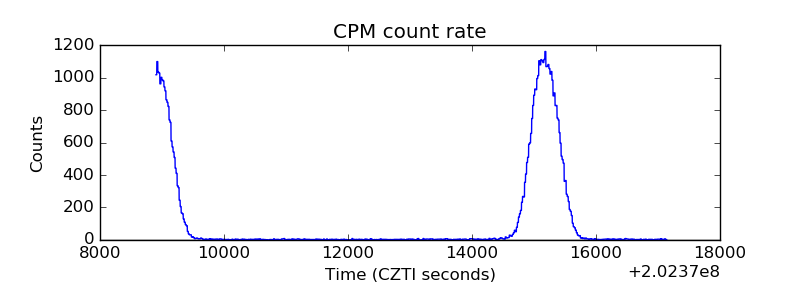 |
| CZT Counter |  |
| +2.5 Volts monitor |  |
| +5 Volts monitor |  |
| Veto Counter | 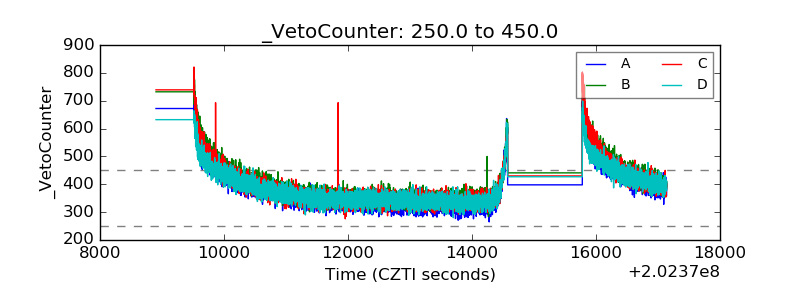 |