| Param | Original file | Final file |
|---|---|---|
| Filename | modeM0/AS1G05_234T02_9000000474_03649cztM0_level2.evt | modeM0/AS1G05_234T02_9000000474_03649cztM0_level2_quad_clean.evt |
| Size (bytes) | 436,962,240 | 73,506,240 |
| Size | 416.7 MB | 70.1 MB |
| Events in quadrant A | 2,905,842 | 457,858 |
| Events in quadrant B | 4,173,549 | 451,881 |
| Events in quadrant C | 2,772,934 | 453,491 |
| Events in quadrant D | 2,972,503 | 442,492 |
| Mode M9 | |||
|---|---|---|---|
| Quadrant | BADHDUFLAG | Total packets | Discarded packets |
| A | 0 | 11 | 0 |
| B | 0 | 11 | 0 |
| C | 0 | 11 | 0 |
| D | 0 | 11 | 0 |
| Mode SS | |||
|---|---|---|---|
| Quadrant | BADHDUFLAG | Total packets | Discarded packets |
| A | 0 | 120 | 0 |
| B | 0 | 120 | 0 |
| C | 0 | 120 | 0 |
| D | 0 | 120 | 0 |
| Mode M0 | |||
|---|---|---|---|
| Quadrant | BADHDUFLAG | Total packets | Discarded packets |
| A | 0 | 12917 | 2 |
| B | 0 | 16569 | 1 |
| C | 0 | 12569 | 1 |
| D | 0 | 13078 | 1 |
| Quadrant | Total seconds | Saturated seconds | Saturation percentage |
|---|---|---|---|
| A | 6021 | 114 | 1.893373% |
| B | 6021 | 169 | 2.806843% |
| C | 6021 | 80 | 1.328683% |
| D | 6021 | 68 | 1.129381% |
Noise dominated data is calculated using 1-second bins in cleaned event files. If a bin has >2000 counts, and if more than 50% of those come from <1% of pixels, then it is considered to be noise-dominated and hence unusable.
| Quadrant | # 1 sec bins | Bins with >0 counts | Bins with >2000 counts | High rate bins dominated by noise | Noise dominated (total time) | Noise dominated (detector-on time) | Marked lightcurve |
|---|---|---|---|---|---|---|---|
| A | 7081 | 6022 | 31 | 31 | 0.44% | 0.51% | 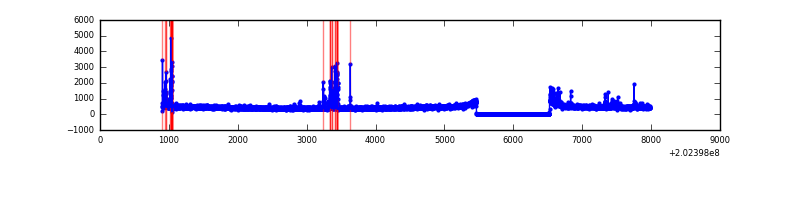 |
| B | 7081 | 6022 | 46 | 46 | 0.65% | 0.76% | 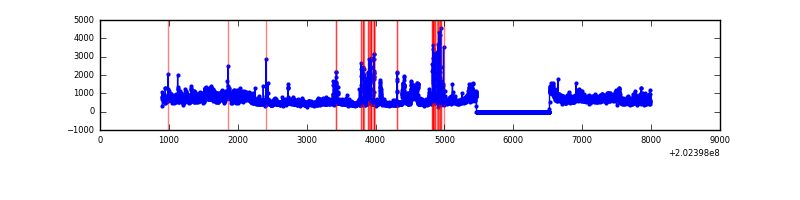 |
| C | 7081 | 6022 | 10 | 10 | 0.14% | 0.17% | 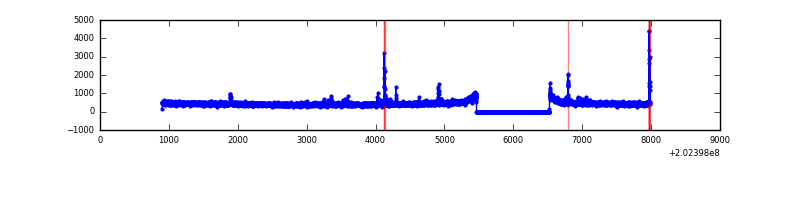 |
| D | 7081 | 6022 | 6 | 6 | 0.08% | 0.10% | 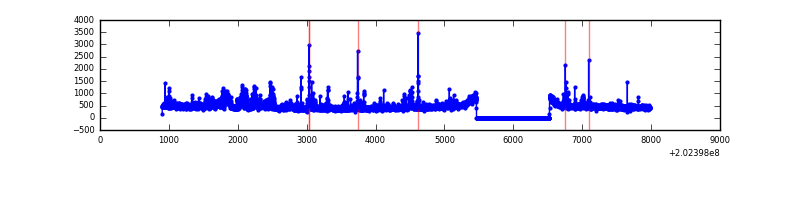 |
Top three noisy pixels from each quadrant. If the there are fewer than three noisy pixels in the level2.evt file, extra rows are filled as -1
| Pixel properties | Quadrant properties | ||||||
|---|---|---|---|---|---|---|---|
| Quadrant | DetID | PixID | Counts | Sigma | Mean | Median | Sigma |
| A | 0 | 50 | 162307 | 1148.27 | 691 | 674 | 140.8 |
| A | 13 | 251 | 34918 | 243.27 | 691 | 674 | 140.8 |
| A | 0 | 31 | 21891 | 150.73 | 691 | 674 | 140.8 |
| B | 15 | 204 | 881738 | 6580.17 | 696 | 679 | 133.9 |
| B | 14 | 167 | 275960 | 2055.93 | 696 | 679 | 133.9 |
| B | 5 | 172 | 233914 | 1741.91 | 696 | 679 | 133.9 |
| C | 7 | 220 | 60545 | 378.51 | 680 | 682 | 158.2 |
| C | 2 | 53 | 42543 | 264.68 | 680 | 682 | 158.2 |
| C | 9 | 247 | 9063 | 52.99 | 680 | 682 | 158.2 |
| D | 11 | 132 | 205137 | 1249.56 | 680 | 660 | 163.6 |
| D | 13 | 223 | 43419 | 261.3 | 680 | 660 | 163.6 |
| D | 8 | 195 | 31058 | 185.76 | 680 | 660 | 163.6 |
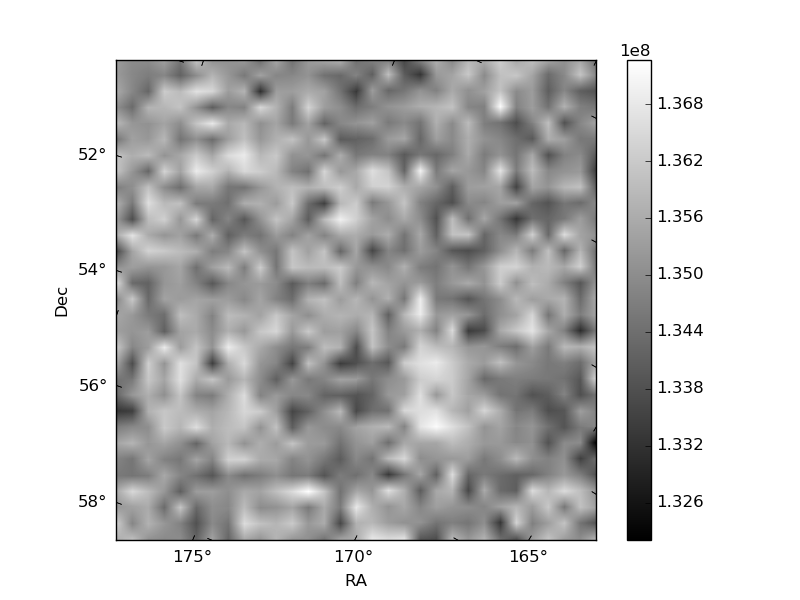
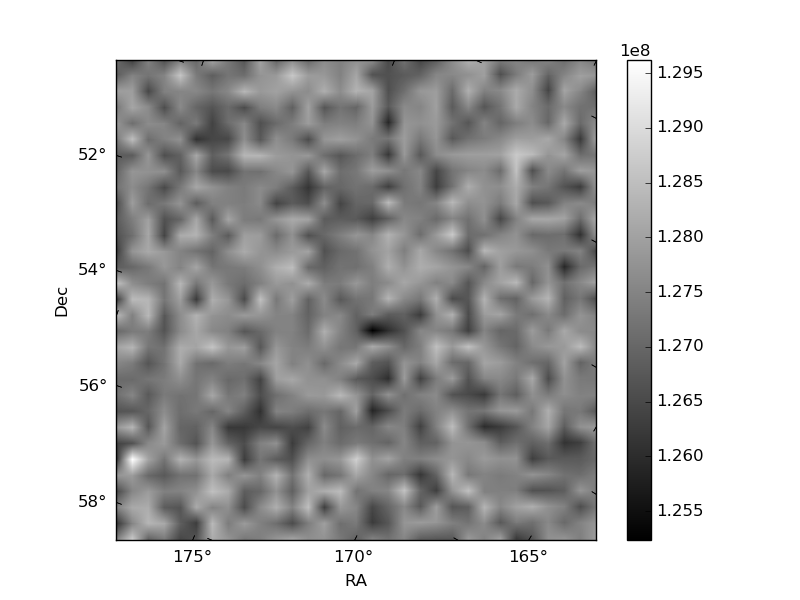
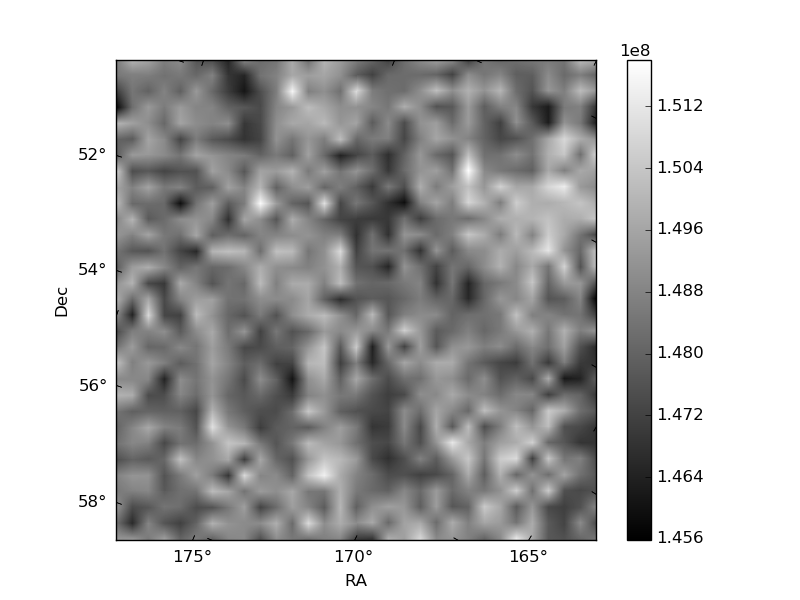
Histogram calculated using DETX and DETY for each event in the final _common_clean file
| Quadrant A | 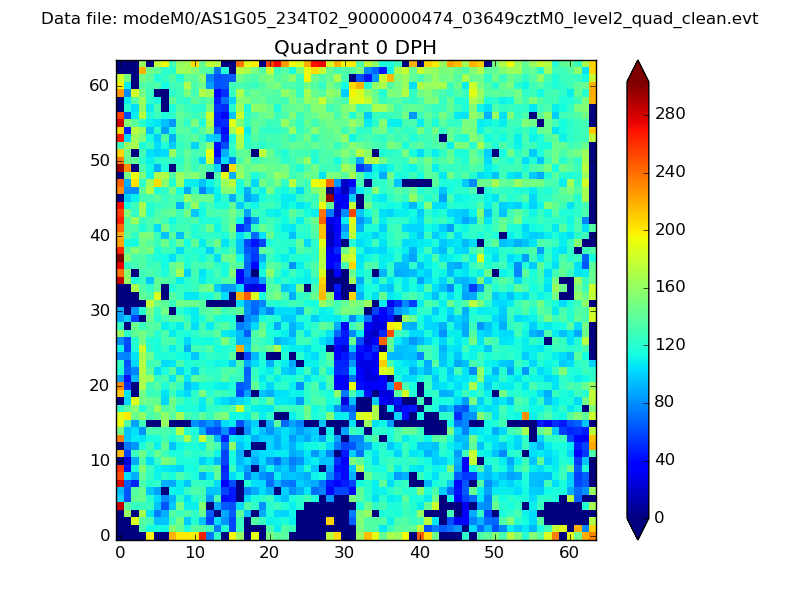 |
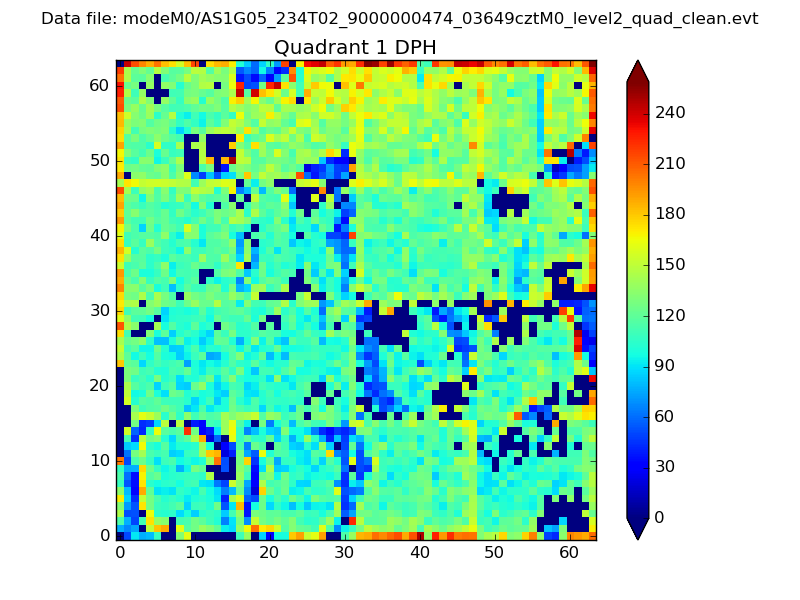 |
Quadrant B |
|---|---|---|---|
| Quadrant D | 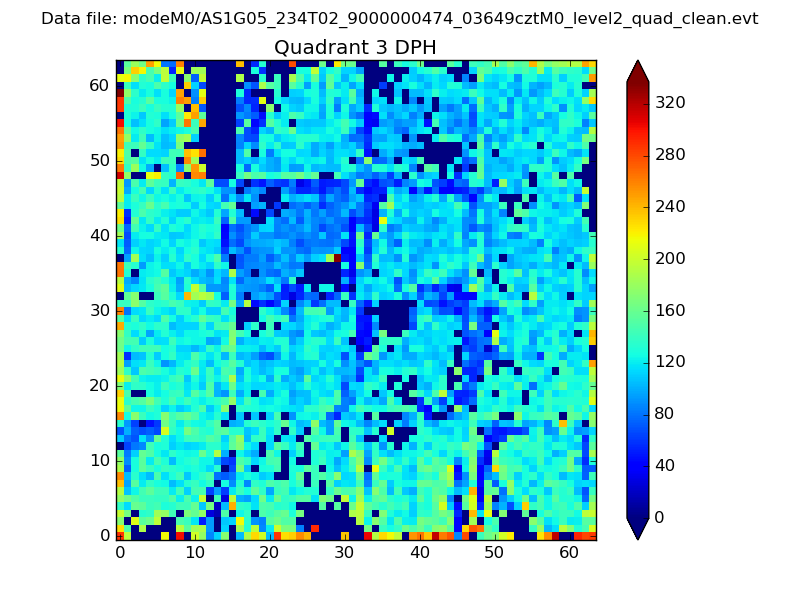 |
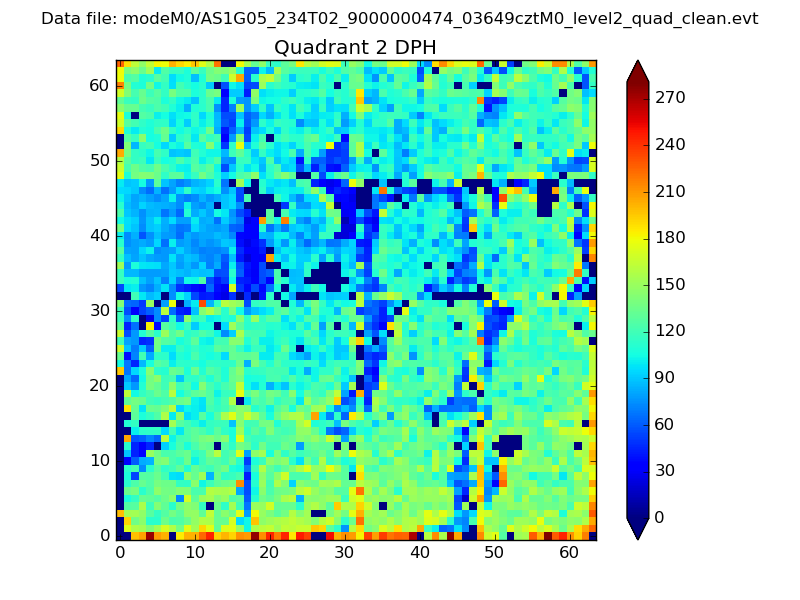 |
Quadrant C |
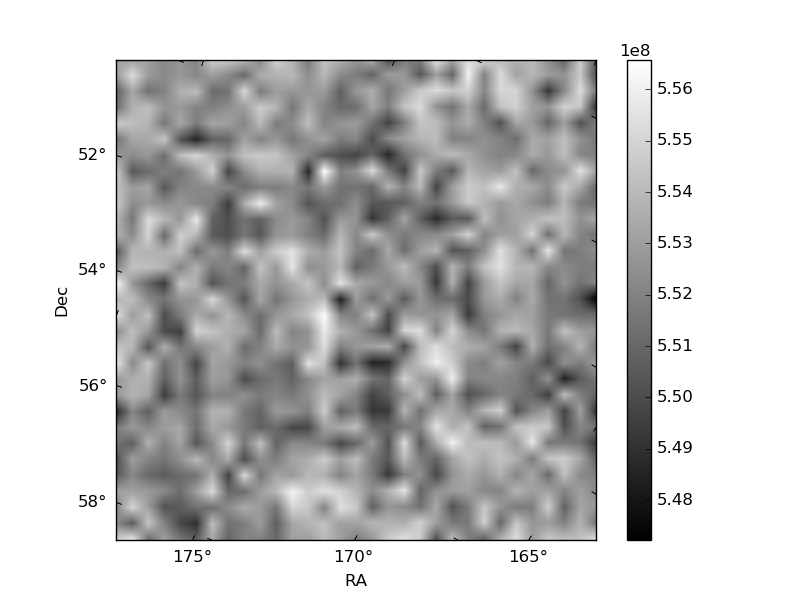
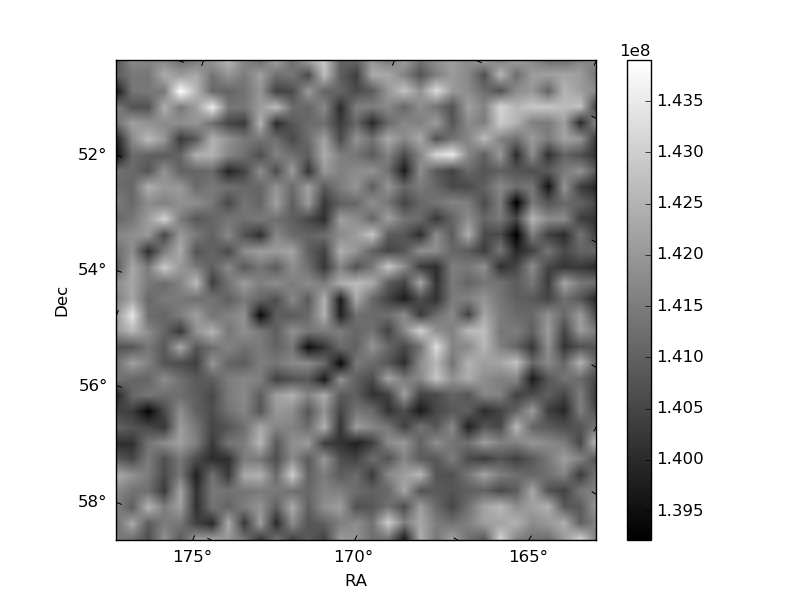
| Plot type | Count rate plots | Images |
|---|---|---|
| Comparison with Poisson distribution Blue bars denote a histogram of data divided into 1 sec bins. Red curve is a Poisson curve with rate = median count rate of data. |
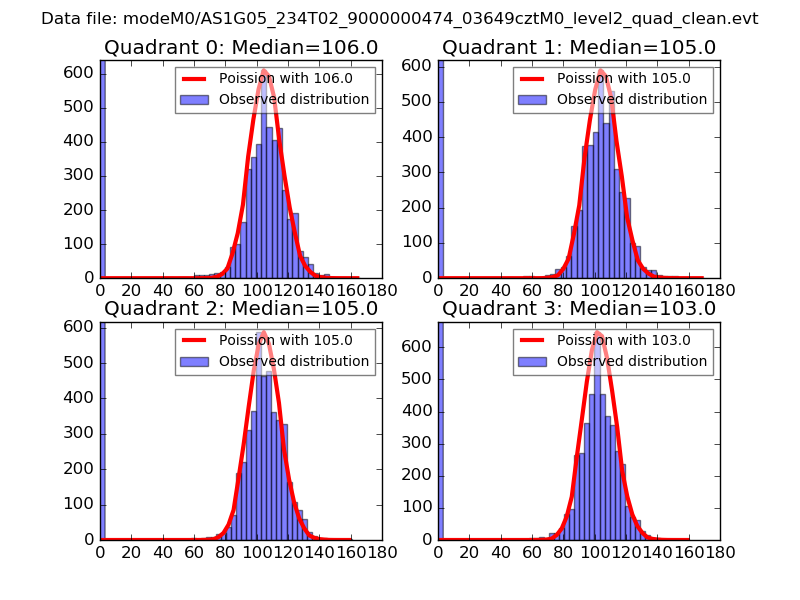 |
 |
| Quadrant-wise count rates Data is divided into 100 sec bins |
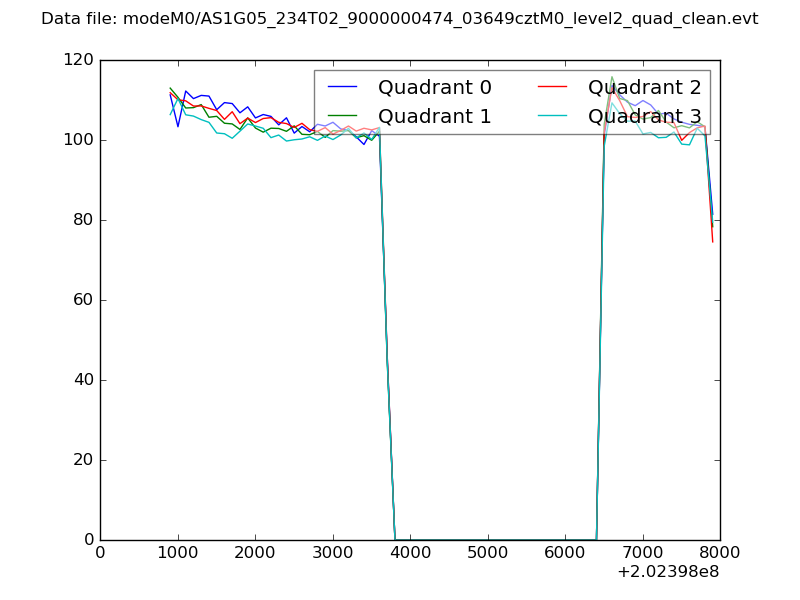 |
|
| Module-wise count rates for Quadrant A Data is divided into 100 sec bins |
 |
 |
| Module-wise count rates for Quadrant B Data is divided into 100 sec bins |
 |
 |
| Module-wise count rates for Quadrant C Data is divided into 100 sec bins |
 |
 |
| Module-wise count rates for Quadrant D Data is divided into 100 sec bins |
 |
 |
| Parameter | Plot |
|---|---|
| CZT HV Monitor |  |
| D_VDD | 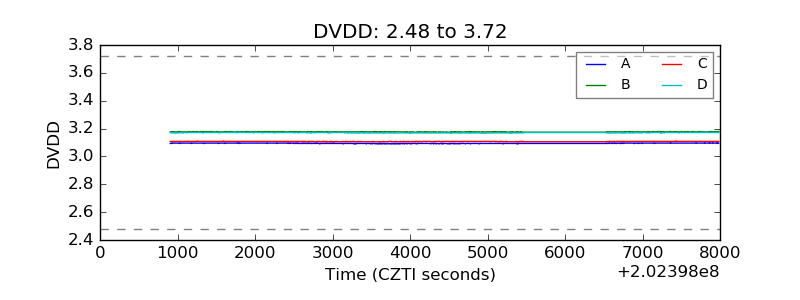 |
| Temperature 1 | 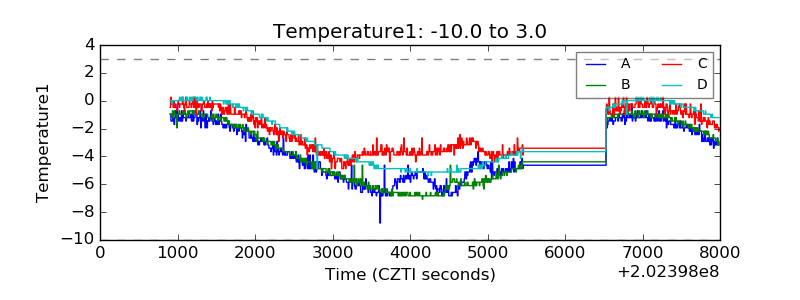 |
| Veto HV Monitor | 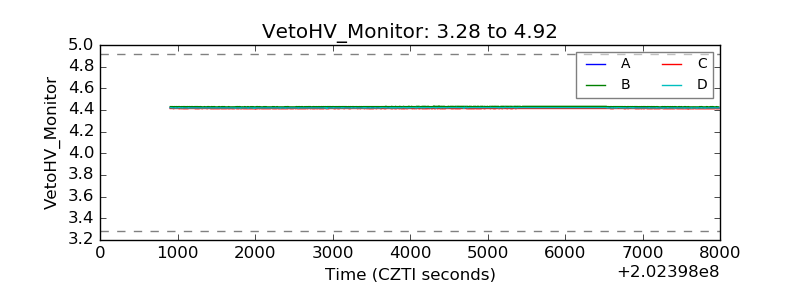 |
| Veto LLD | 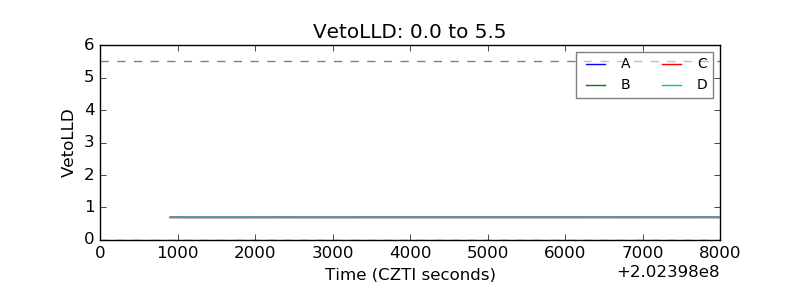 |
| Alpha Counter | 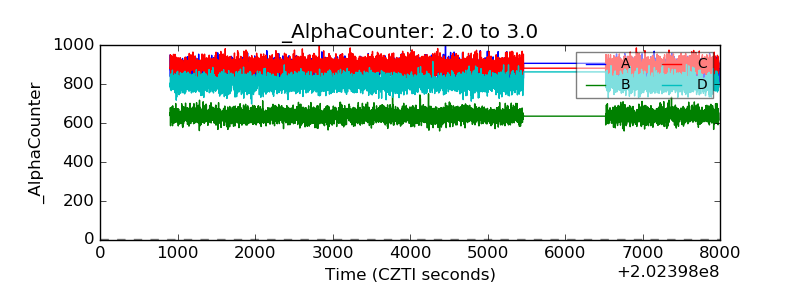 |
| _CPM_Rate | 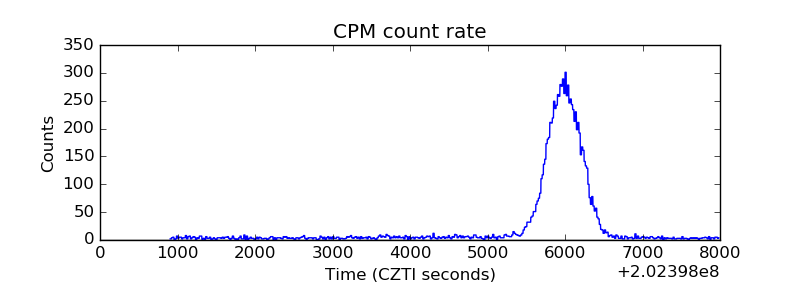 |
| CZT Counter | 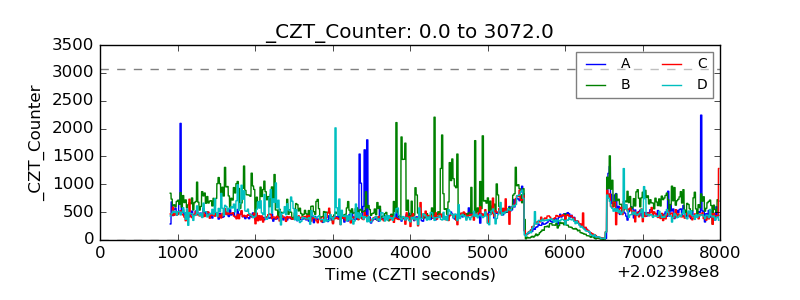 |
| +2.5 Volts monitor |  |
| +5 Volts monitor | 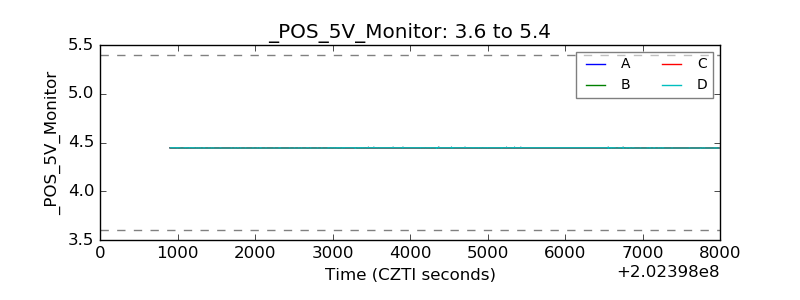 |
| Veto Counter |  |