| Param | Original file | Final file |
|---|---|---|
| Filename | modeM0/AS1G05_234T02_9000000474_03651cztM0_level2.evt | modeM0/AS1G05_234T02_9000000474_03651cztM0_level2_quad_clean.evt |
| Size (bytes) | 546,364,800 | 89,305,920 |
| Size | 521.1 MB | 85.2 MB |
| Events in quadrant A | 3,665,134 | 554,974 |
| Events in quadrant B | 4,962,608 | 544,353 |
| Events in quadrant C | 3,634,427 | 551,912 |
| Events in quadrant D | 3,786,141 | 541,680 |
| Mode M9 | |||
|---|---|---|---|
| Quadrant | BADHDUFLAG | Total packets | Discarded packets |
| A | 0 | 6 | 0 |
| B | 0 | 6 | 0 |
| C | 0 | 6 | 0 |
| D | 0 | 7 | 0 |
| Mode SS | |||
|---|---|---|---|
| Quadrant | BADHDUFLAG | Total packets | Discarded packets |
| A | 0 | 150 | 0 |
| B | 0 | 150 | 0 |
| C | 0 | 150 | 0 |
| D | 0 | 150 | 0 |
| Mode M0 | |||
|---|---|---|---|
| Quadrant | BADHDUFLAG | Total packets | Discarded packets |
| A | 0 | 16253 | 3 |
| B | 0 | 19883 | 2 |
| C | 0 | 16087 | 2 |
| D | 0 | 16690 | 2 |
| Quadrant | Total seconds | Saturated seconds | Saturation percentage |
|---|---|---|---|
| A | 7344 | 130 | 1.770153% |
| B | 7344 | 193 | 2.627996% |
| C | 7344 | 38 | 0.517429% |
| D | 7344 | 53 | 0.721678% |
Noise dominated data is calculated using 1-second bins in cleaned event files. If a bin has >2000 counts, and if more than 50% of those come from <1% of pixels, then it is considered to be noise-dominated and hence unusable.
| Quadrant | # 1 sec bins | Bins with >0 counts | Bins with >2000 counts | High rate bins dominated by noise | Noise dominated (total time) | Noise dominated (detector-on time) | Marked lightcurve |
|---|---|---|---|---|---|---|---|
| A | 7724 | 7345 | 57 | 57 | 0.74% | 0.78% | 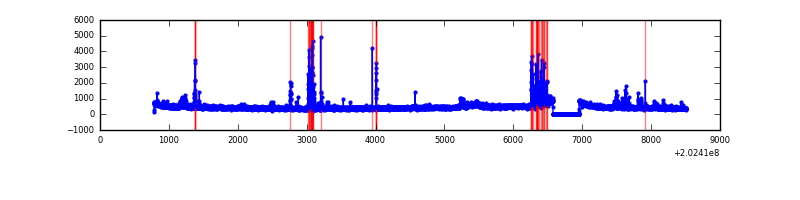 |
| B | 7724 | 7345 | 56 | 56 | 0.73% | 0.76% | 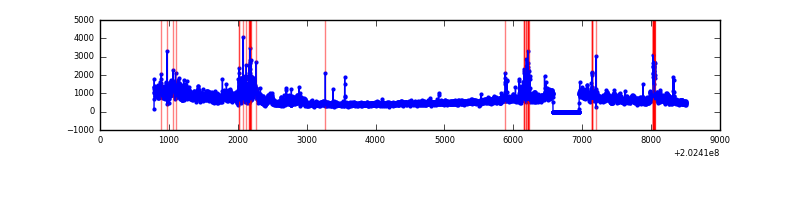 |
| C | 7724 | 7345 | 5 | 5 | 0.06% | 0.07% | 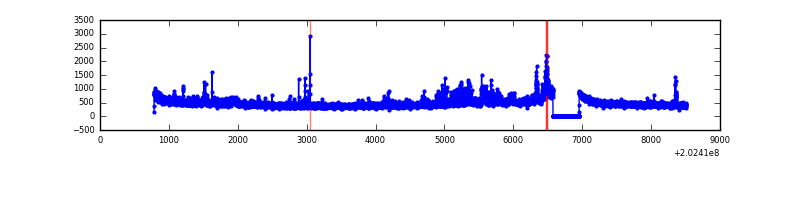 |
| D | 7724 | 7345 | 18 | 18 | 0.23% | 0.25% | 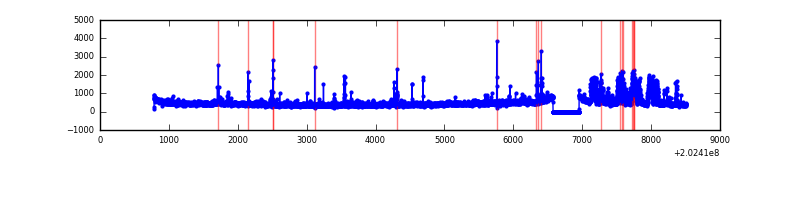 |
Top three noisy pixels from each quadrant. If the there are fewer than three noisy pixels in the level2.evt file, extra rows are filled as -1
| Pixel properties | Quadrant properties | ||||||
|---|---|---|---|---|---|---|---|
| Quadrant | DetID | PixID | Counts | Sigma | Mean | Median | Sigma |
| A | 0 | 50 | 241754 | 1407.19 | 832 | 814 | 171.2 |
| A | 13 | 251 | 53007 | 304.83 | 832 | 814 | 171.2 |
| A | 13 | 164 | 51851 | 298.08 | 832 | 814 | 171.2 |
| B | 15 | 204 | 989466 | 6064.39 | 842 | 821 | 163.0 |
| B | 3 | 0 | 202450 | 1236.8 | 842 | 821 | 163.0 |
| B | 7 | 252 | 137266 | 836.96 | 842 | 821 | 163.0 |
| C | 2 | 53 | 373334 | 1921.84 | 822 | 824 | 193.8 |
| C | 12 | 4 | 27671 | 138.51 | 822 | 824 | 193.8 |
| C | 9 | 247 | 10744 | 51.18 | 822 | 824 | 193.8 |
| D | 13 | 25 | 453263 | 2063.2 | 812 | 792 | 219.3 |
| D | 13 | 223 | 52504 | 235.8 | 812 | 792 | 219.3 |
| D | 8 | 195 | 45034 | 201.74 | 812 | 792 | 219.3 |
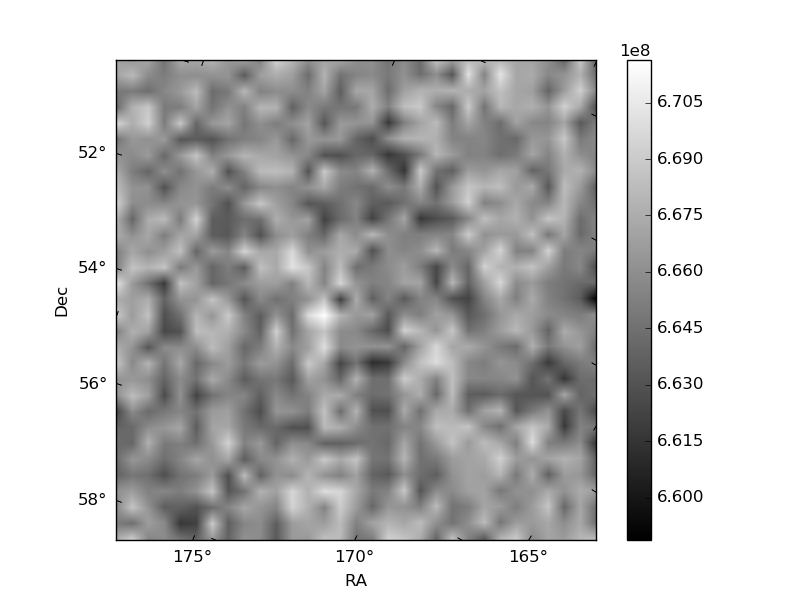
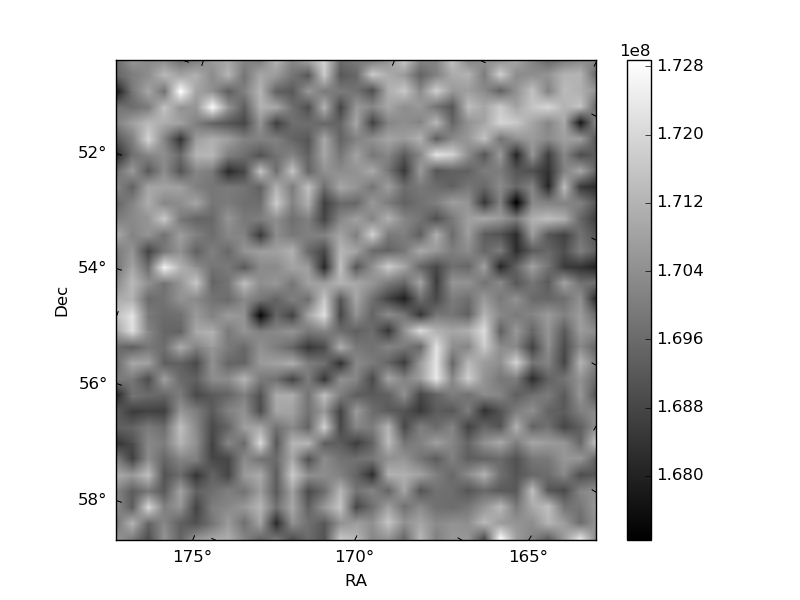
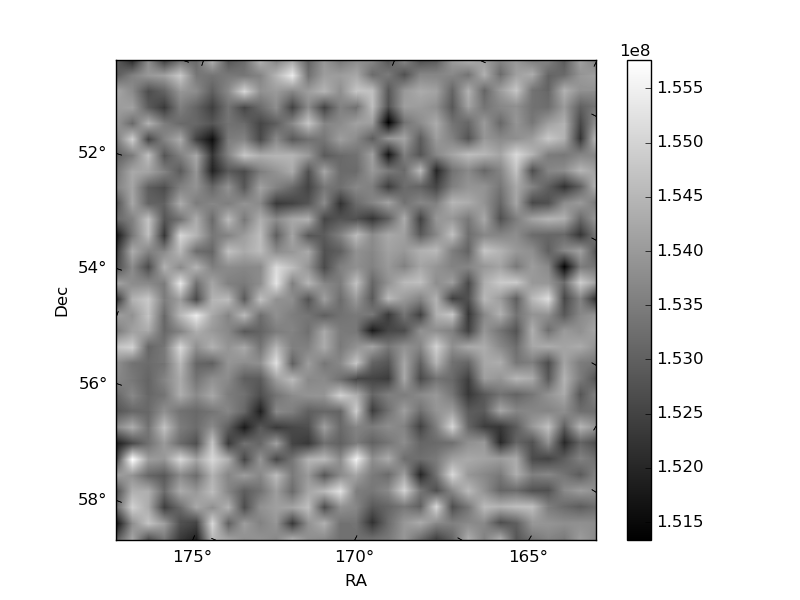
Histogram calculated using DETX and DETY for each event in the final _common_clean file
| Quadrant A | 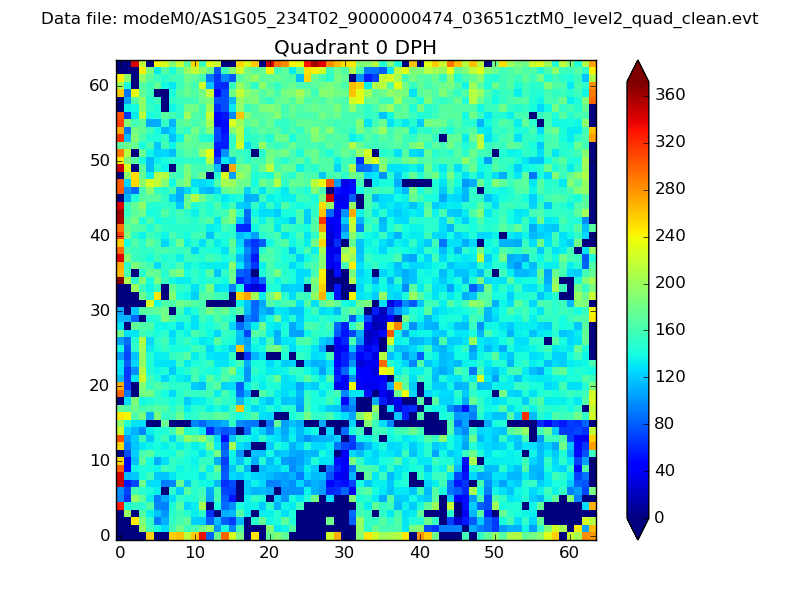 |
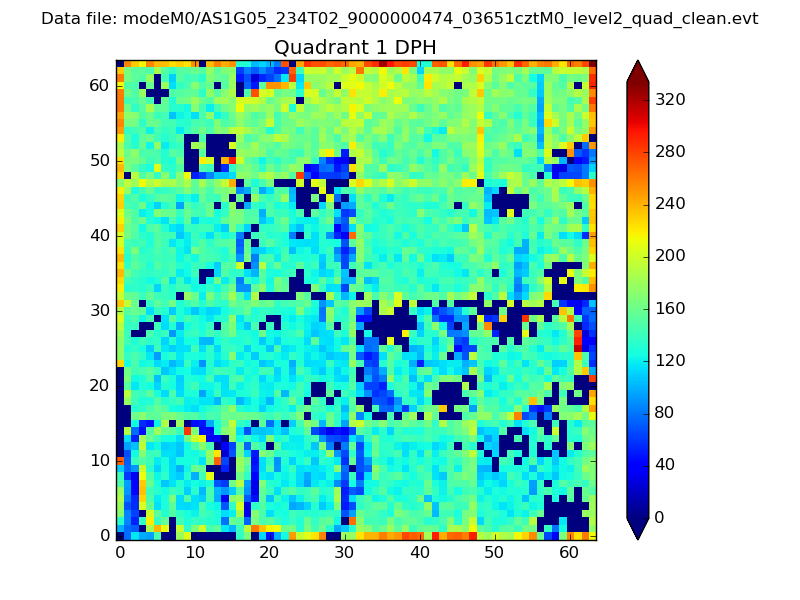 |
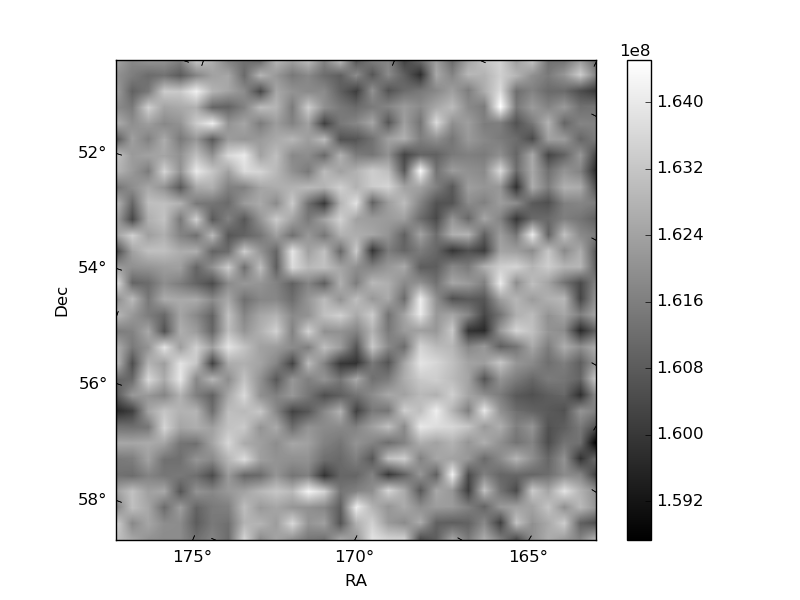
Quadrant B |
|---|---|---|---|
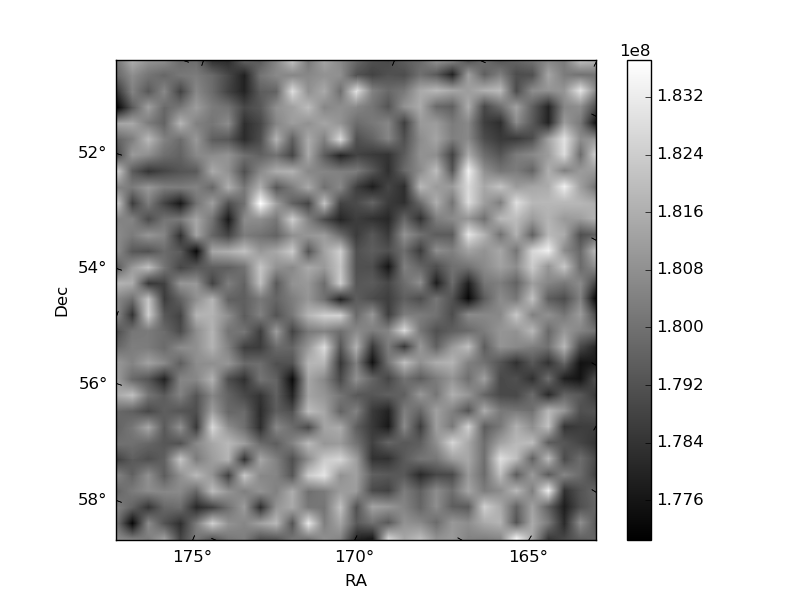
| Quadrant D | 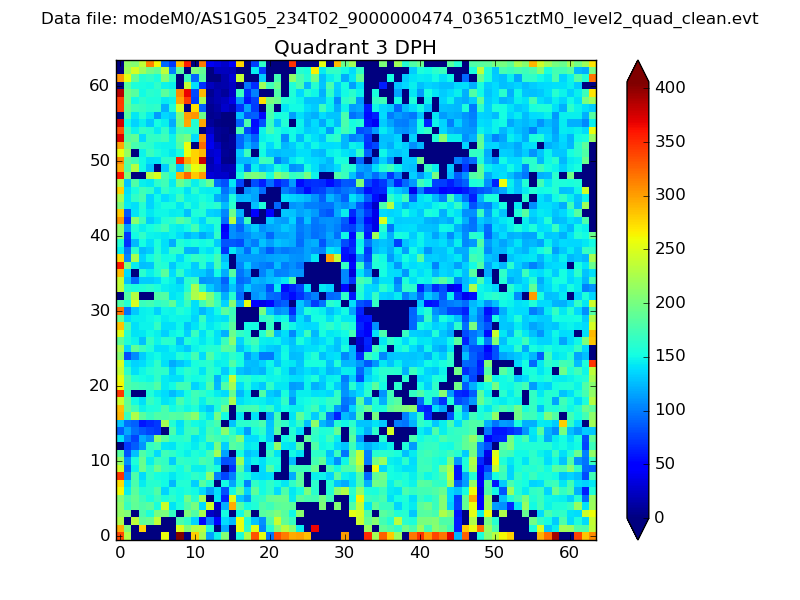 |
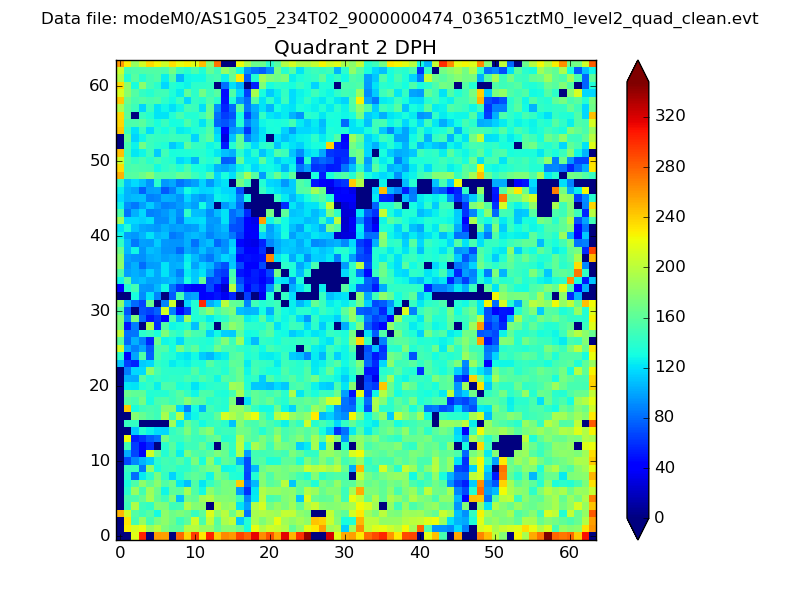 |
Quadrant C |
| Plot type | Count rate plots | Images |
|---|---|---|
| Comparison with Poisson distribution Blue bars denote a histogram of data divided into 1 sec bins. Red curve is a Poisson curve with rate = median count rate of data. |
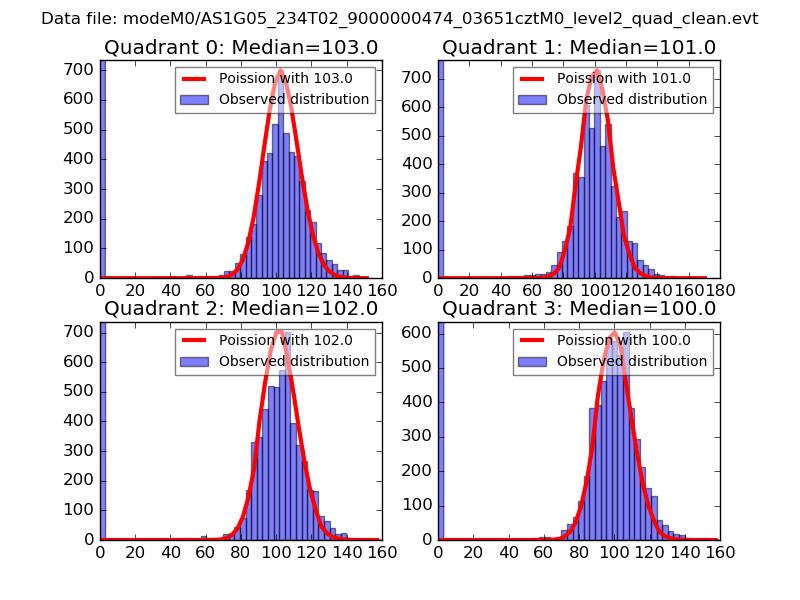 |
 |
| Quadrant-wise count rates Data is divided into 100 sec bins |
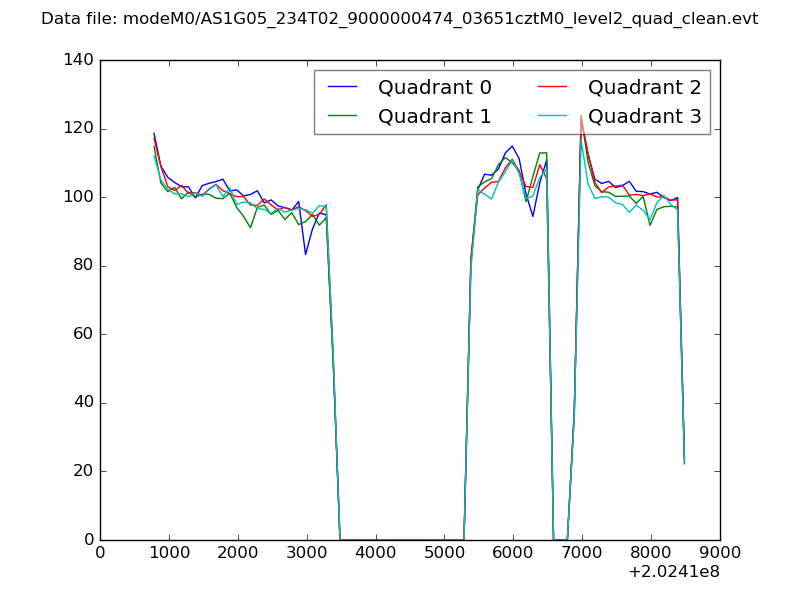 |
|
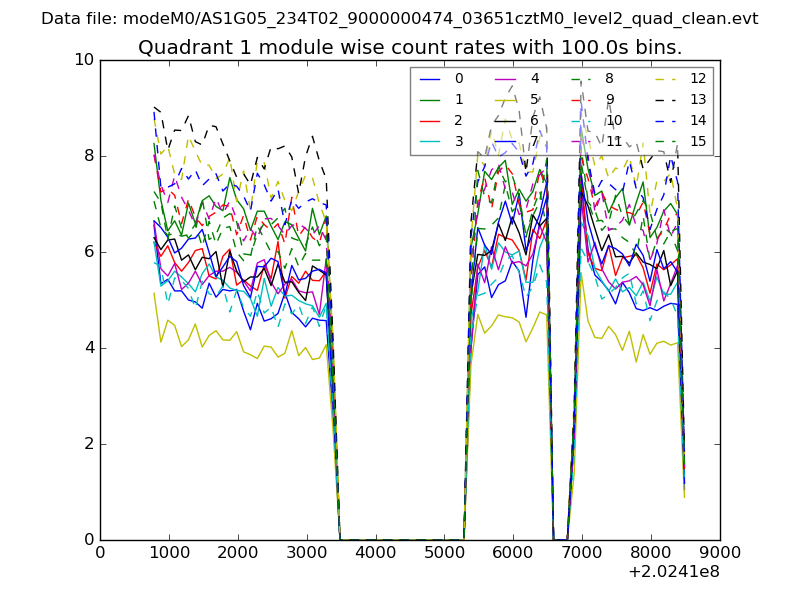
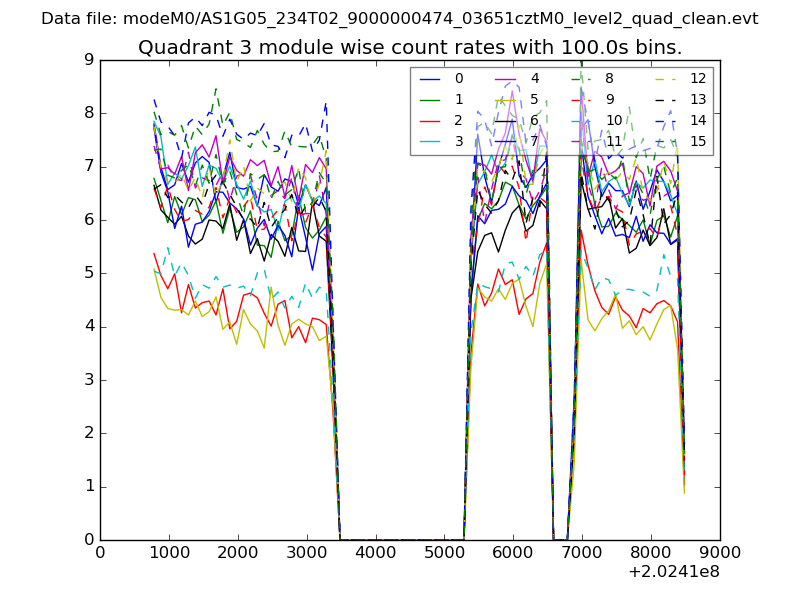
| Module-wise count rates for Quadrant A Data is divided into 100 sec bins |
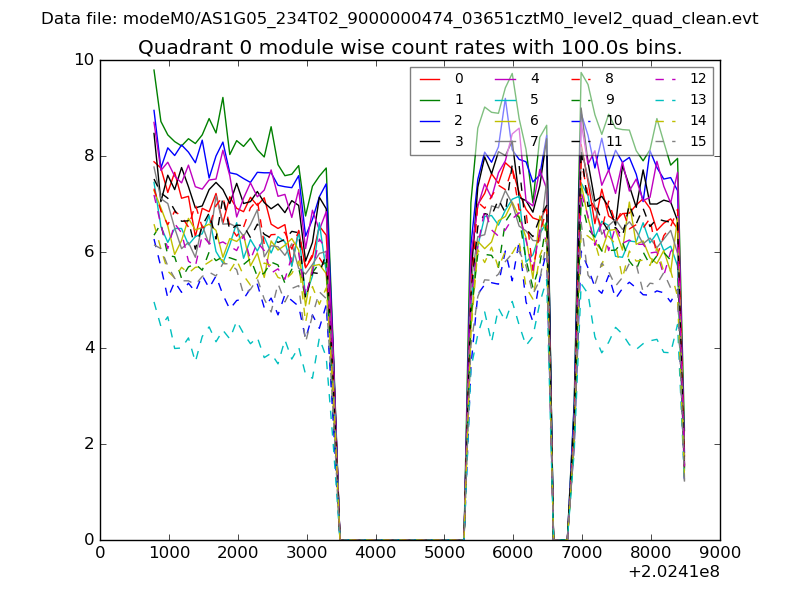 |
 |
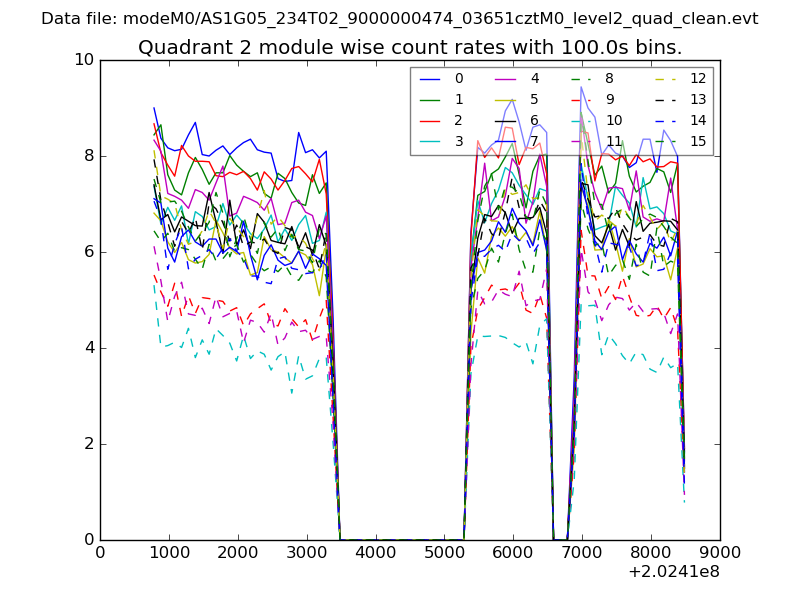
| Module-wise count rates for Quadrant B Data is divided into 100 sec bins |
 |
 |
| Module-wise count rates for Quadrant C Data is divided into 100 sec bins |
 |
 |
| Module-wise count rates for Quadrant D Data is divided into 100 sec bins |
 |
 |
| Parameter | Plot |
|---|---|
| CZT HV Monitor | 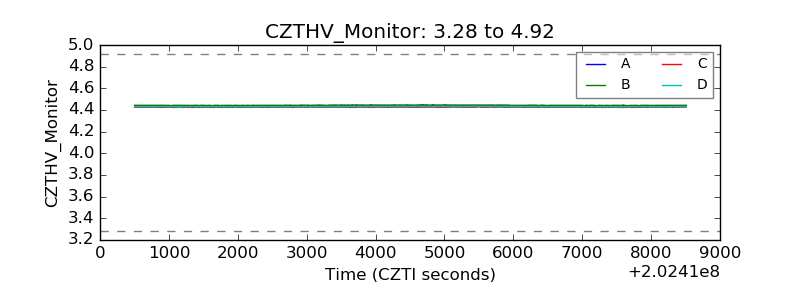 |
| D_VDD | 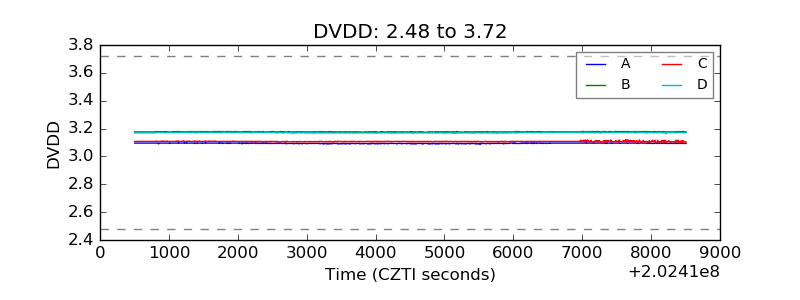 |
| Temperature 1 |  |
| Veto HV Monitor | 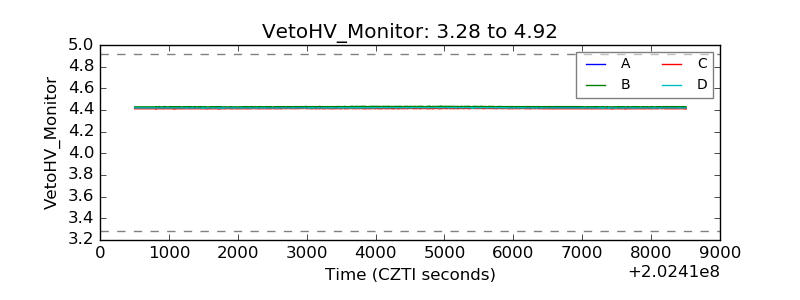 |
| Veto LLD |  |
| Alpha Counter | 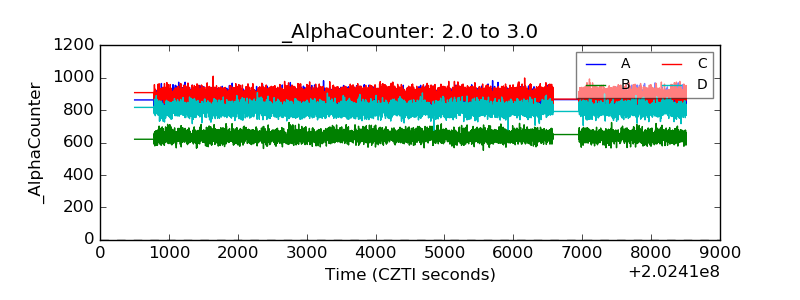 |
| _CPM_Rate | 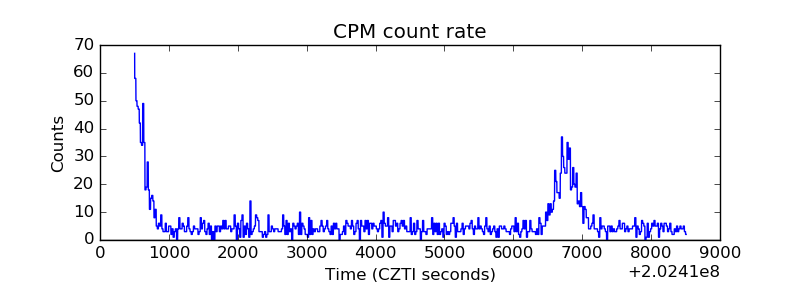 |
| CZT Counter | 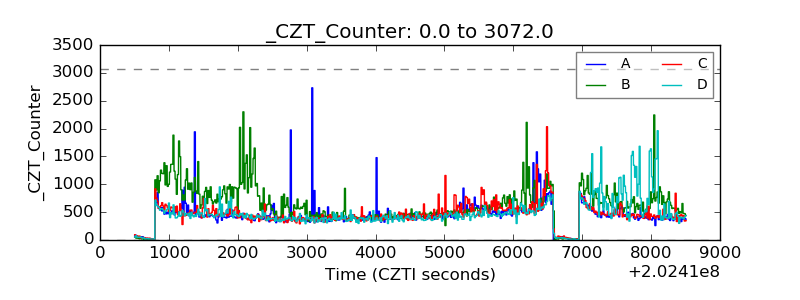 |
| +2.5 Volts monitor |  |
| +5 Volts monitor |  |
| Veto Counter | 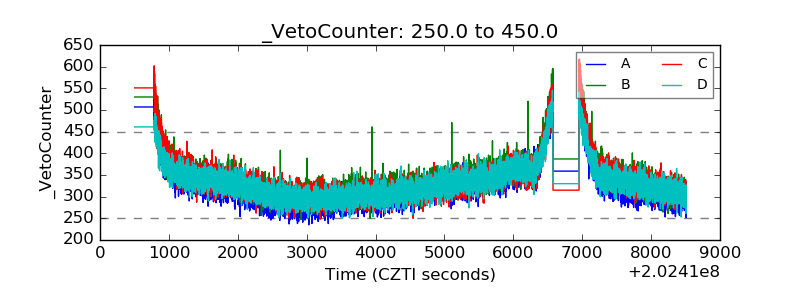 |