| Param | Original file | Final file |
|---|---|---|
| Filename | modeM0/AS1G05_234T02_9000000474_03652cztM0_level2.evt | modeM0/AS1G05_234T02_9000000474_03652cztM0_level2_quad_clean.evt |
| Size (bytes) | 554,526,720 | 93,208,320 |
| Size | 528.8 MB | 88.9 MB |
| Events in quadrant A | 3,935,723 | 576,713 |
| Events in quadrant B | 4,800,848 | 573,482 |
| Events in quadrant C | 3,586,388 | 576,707 |
| Events in quadrant D | 3,954,930 | 566,237 |
| Mode M9 | |||
|---|---|---|---|
| Quadrant | BADHDUFLAG | Total packets | Discarded packets |
| A | 0 | 2 | 0 |
| B | 0 | 2 | 0 |
| C | 0 | 2 | 0 |
| D | 0 | 2 | 0 |
| Mode SS | |||
|---|---|---|---|
| Quadrant | BADHDUFLAG | Total packets | Discarded packets |
| A | 0 | 156 | 0 |
| B | 0 | 156 | 0 |
| C | 0 | 156 | 0 |
| D | 0 | 156 | 0 |
| Mode M0 | |||
|---|---|---|---|
| Quadrant | BADHDUFLAG | Total packets | Discarded packets |
| A | 0 | 17183 | 4 |
| B | 0 | 19420 | 3 |
| C | 0 | 16274 | 3 |
| D | 0 | 17502 | 3 |
| Quadrant | Total seconds | Saturated seconds | Saturation percentage |
|---|---|---|---|
| A | 7608 | 190 | 2.497371% |
| B | 7608 | 190 | 2.497371% |
| C | 7608 | 62 | 0.814932% |
| D | 7608 | 59 | 0.775499% |
Noise dominated data is calculated using 1-second bins in cleaned event files. If a bin has >2000 counts, and if more than 50% of those come from <1% of pixels, then it is considered to be noise-dominated and hence unusable.
| Quadrant | # 1 sec bins | Bins with >0 counts | Bins with >2000 counts | High rate bins dominated by noise | Noise dominated (total time) | Noise dominated (detector-on time) | Marked lightcurve |
|---|---|---|---|---|---|---|---|
| A | 7803 | 7611 | 98 | 98 | 1.26% | 1.29% | 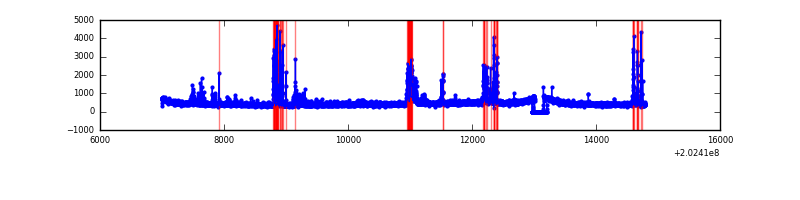 |
| B | 7803 | 7611 | 48 | 48 | 0.62% | 0.63% | 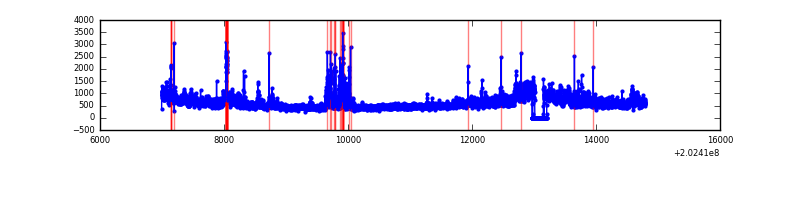 |
| C | 7803 | 7611 | 23 | 23 | 0.29% | 0.30% |  |
| D | 7803 | 7611 | 28 | 28 | 0.36% | 0.37% | 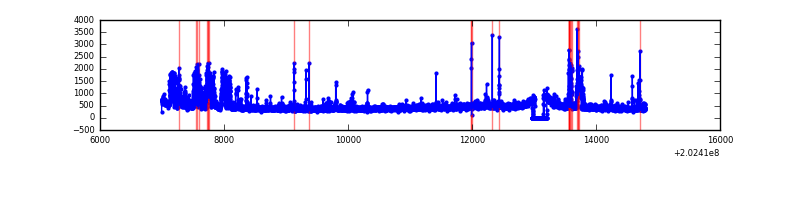 |
Top three noisy pixels from each quadrant. If the there are fewer than three noisy pixels in the level2.evt file, extra rows are filled as -1
| Pixel properties | Quadrant properties | ||||||
|---|---|---|---|---|---|---|---|
| Quadrant | DetID | PixID | Counts | Sigma | Mean | Median | Sigma |
| A | 0 | 50 | 310988 | 1762.08 | 855 | 833 | 176.0 |
| A | 13 | 164 | 170216 | 962.31 | 855 | 833 | 176.0 |
| A | 8 | 15 | 115125 | 649.32 | 855 | 833 | 176.0 |
| B | 15 | 204 | 764203 | 4522.5 | 871 | 846 | 168.8 |
| B | 5 | 172 | 186431 | 1099.5 | 871 | 846 | 168.8 |
| B | 14 | 167 | 180693 | 1065.5 | 871 | 846 | 168.8 |
| C | 2 | 53 | 141518 | 709.9 | 846 | 845 | 198.2 |
| C | 9 | 247 | 50177 | 248.95 | 846 | 845 | 198.2 |
| C | 1 | 16 | 30411 | 149.2 | 846 | 845 | 198.2 |
| D | 13 | 25 | 457010 | 2194.13 | 839 | 815 | 207.9 |
| D | 2 | 118 | 134516 | 643.05 | 839 | 815 | 207.9 |
| D | 8 | 195 | 51243 | 242.54 | 839 | 815 | 207.9 |
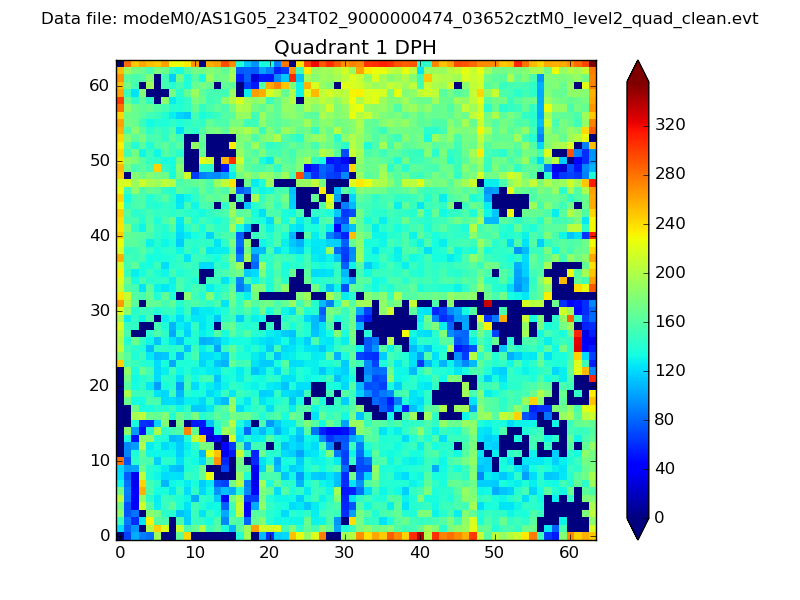
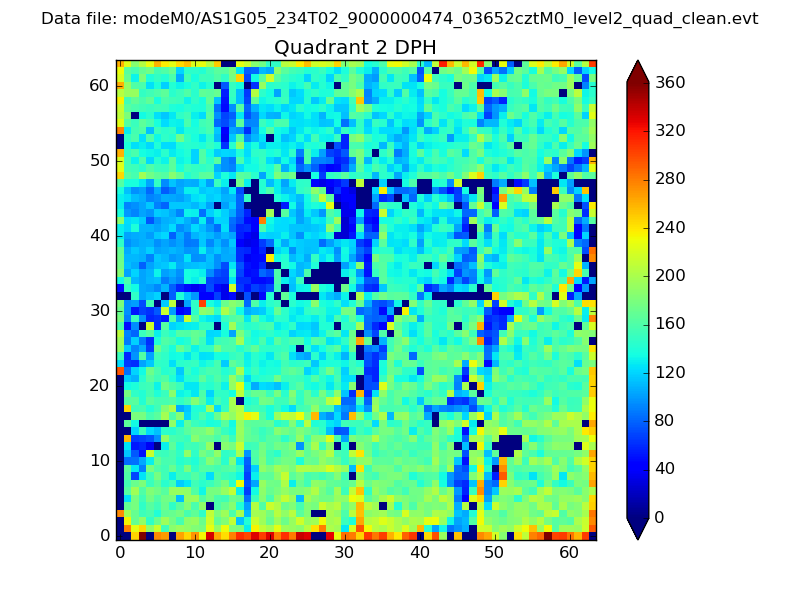
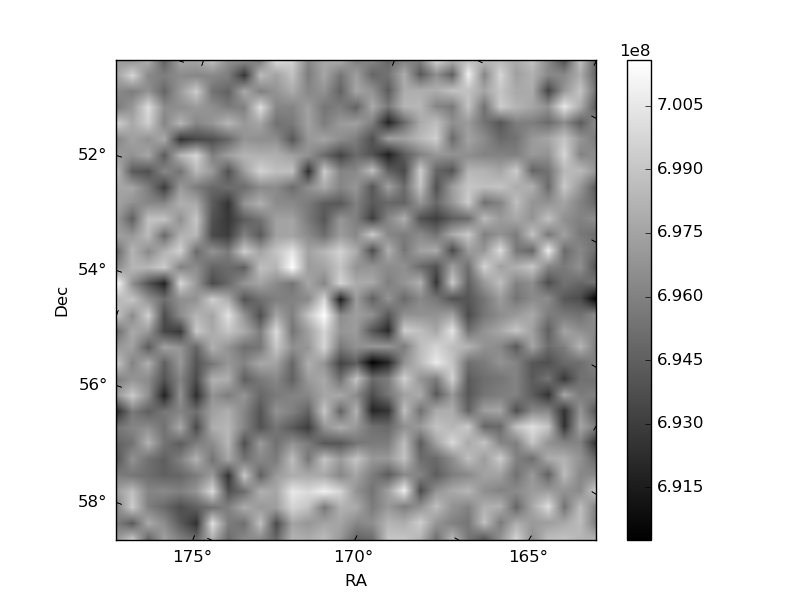
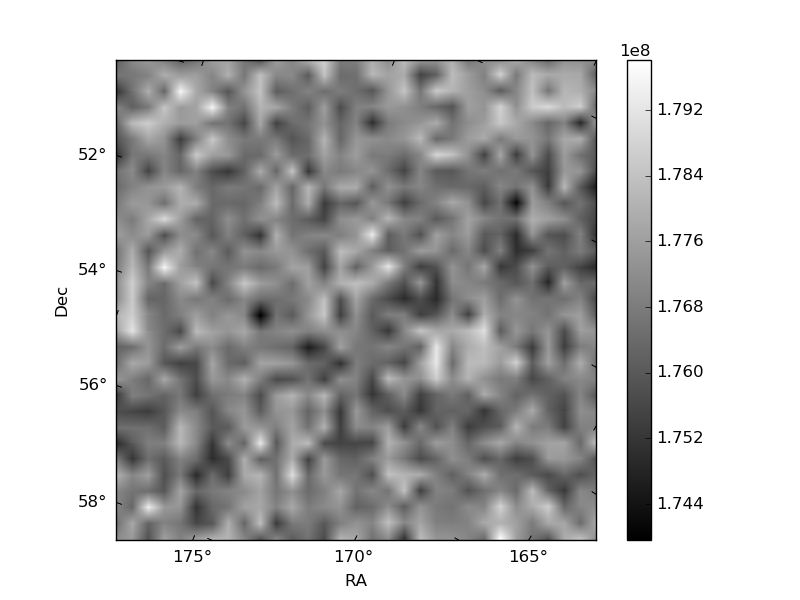
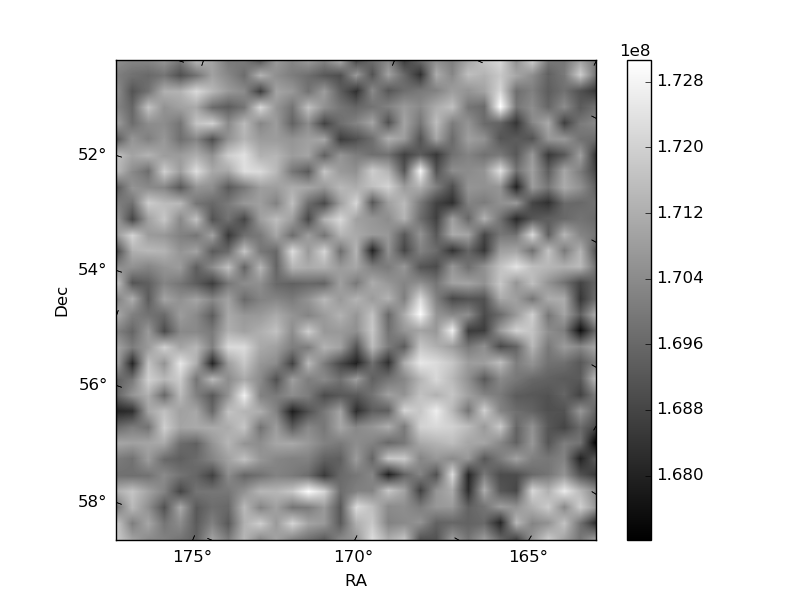
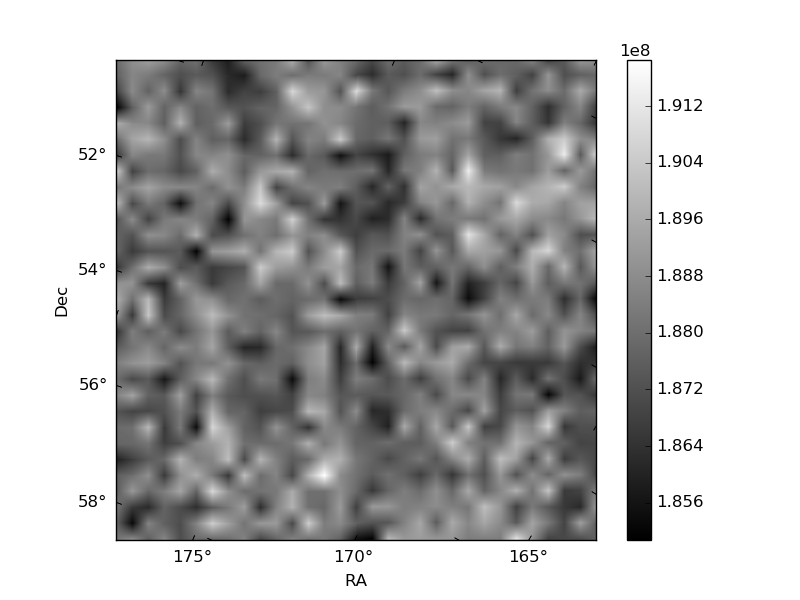
Histogram calculated using DETX and DETY for each event in the final _common_clean file
| Quadrant A | 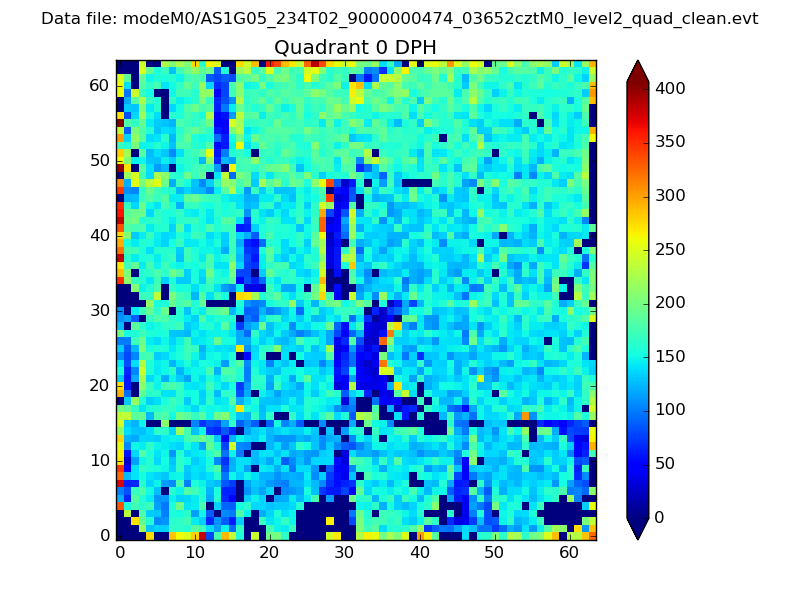 |
 |
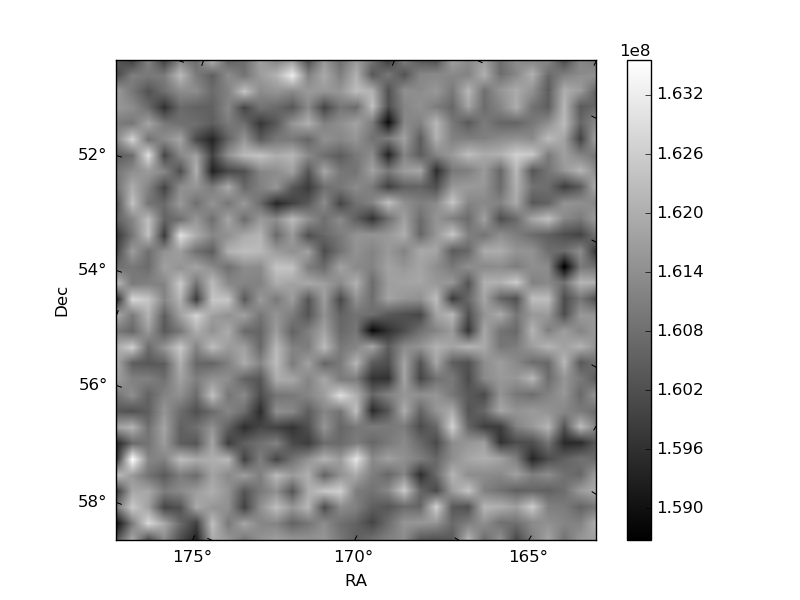
Quadrant B |
|---|---|---|---|
| Quadrant D | 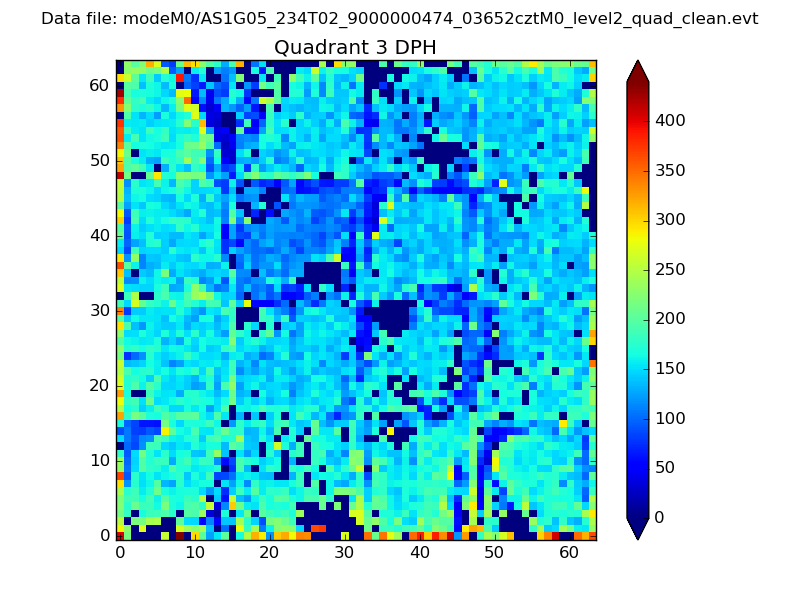 |
 |
Quadrant C |
| Plot type | Count rate plots | Images |
|---|---|---|
| Comparison with Poisson distribution Blue bars denote a histogram of data divided into 1 sec bins. Red curve is a Poisson curve with rate = median count rate of data. |
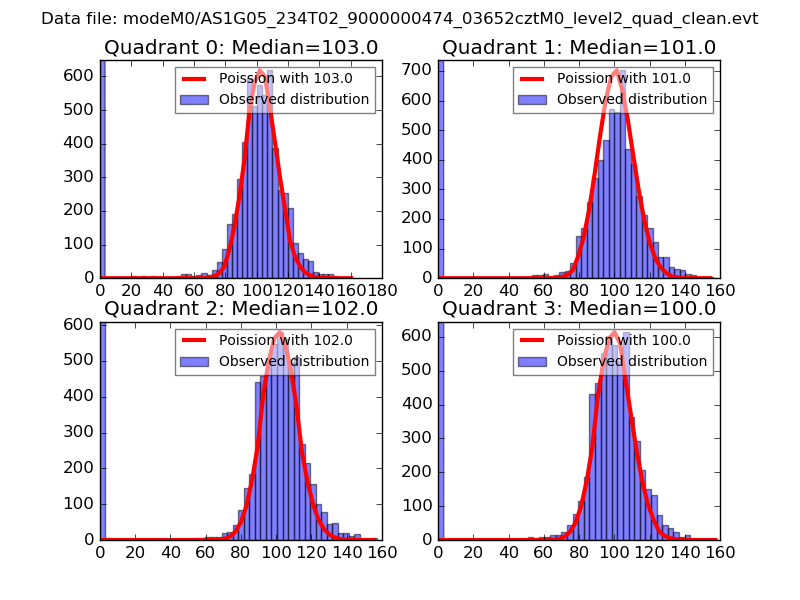 |
 |
| Quadrant-wise count rates Data is divided into 100 sec bins |
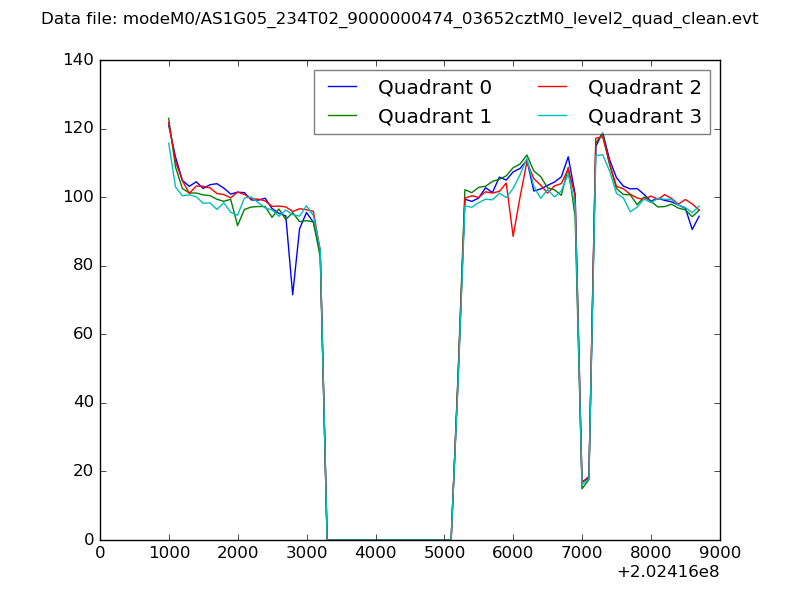 |
|
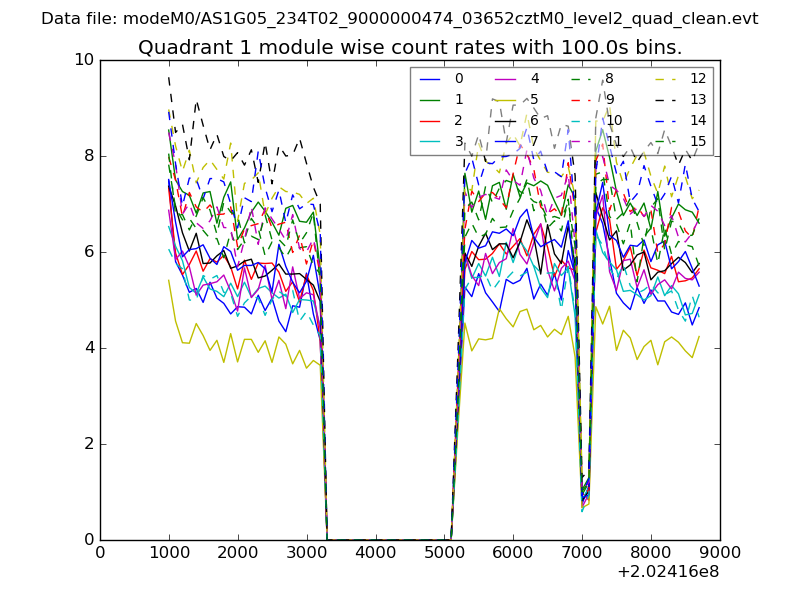
| Module-wise count rates for Quadrant A Data is divided into 100 sec bins |
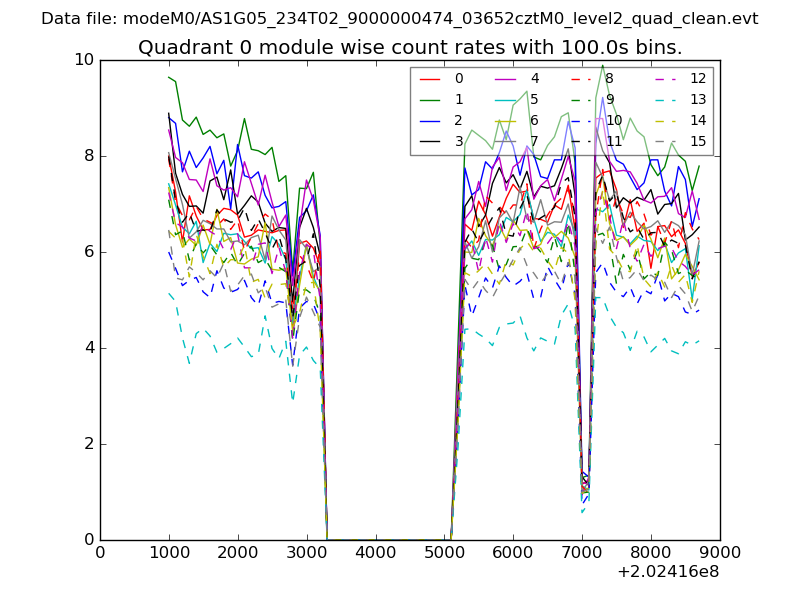 |
 |
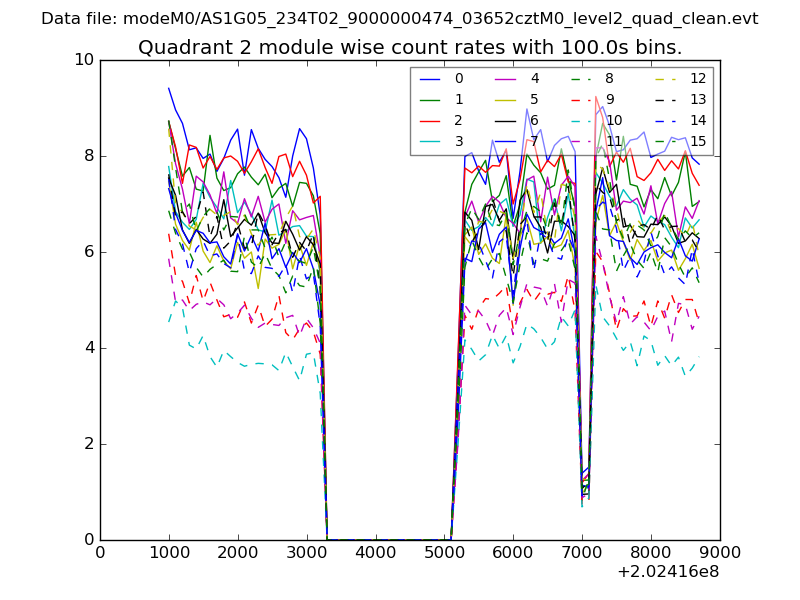
| Module-wise count rates for Quadrant B Data is divided into 100 sec bins |
 |
 |
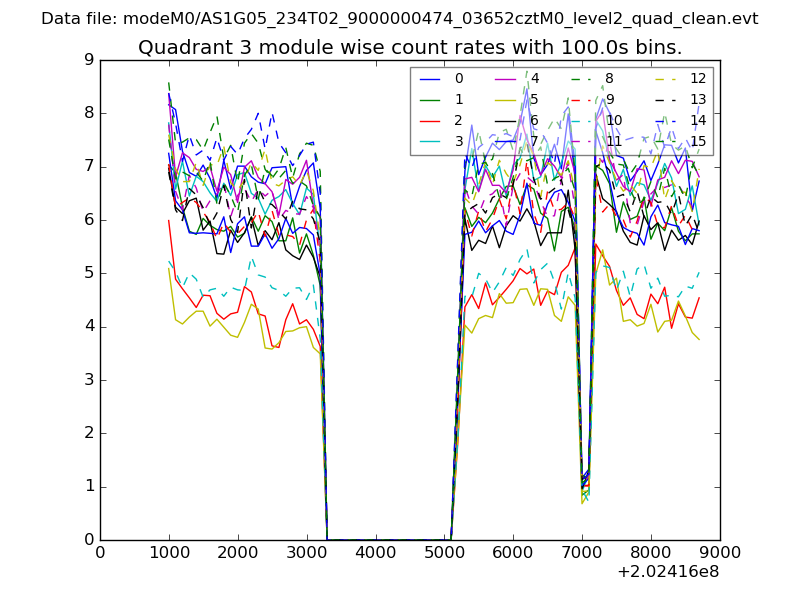
| Module-wise count rates for Quadrant C Data is divided into 100 sec bins |
 |
 |
| Module-wise count rates for Quadrant D Data is divided into 100 sec bins |
 |
 |
| Parameter | Plot |
|---|---|
| CZT HV Monitor | 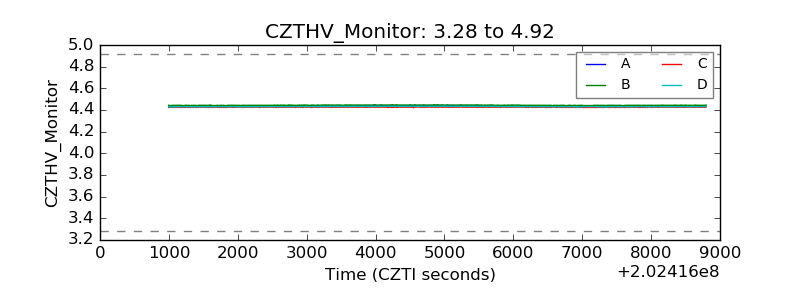 |
| D_VDD | 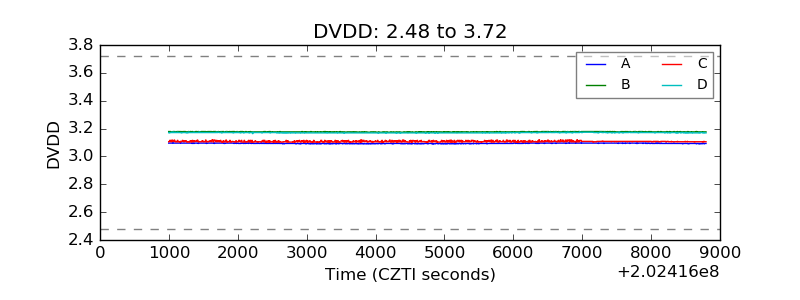 |
| Temperature 1 | 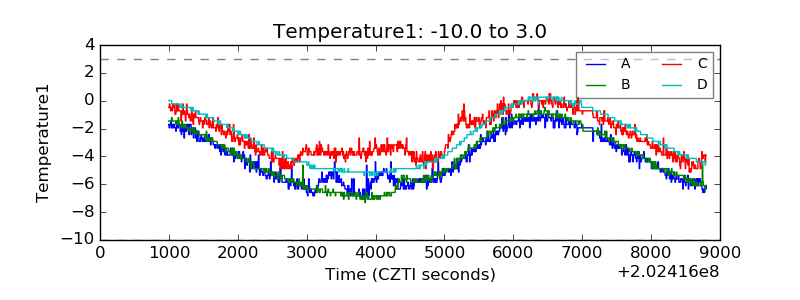 |
| Veto HV Monitor | 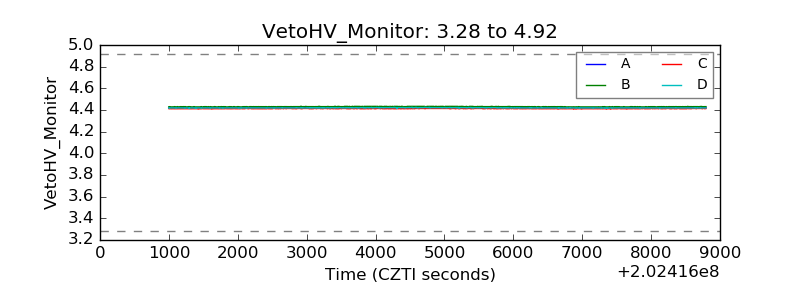 |
| Veto LLD | 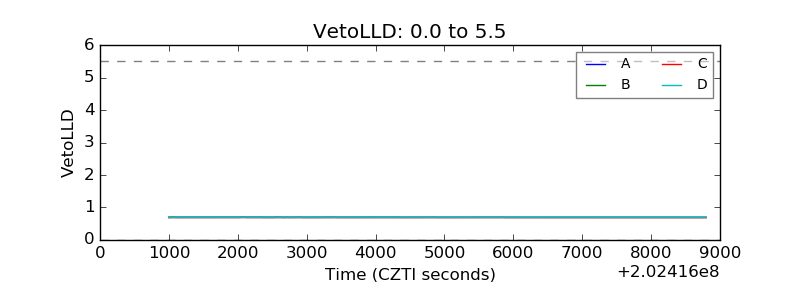 |
| Alpha Counter | 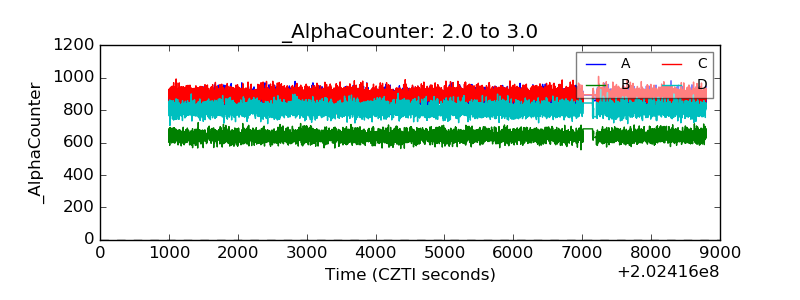 |
| _CPM_Rate | 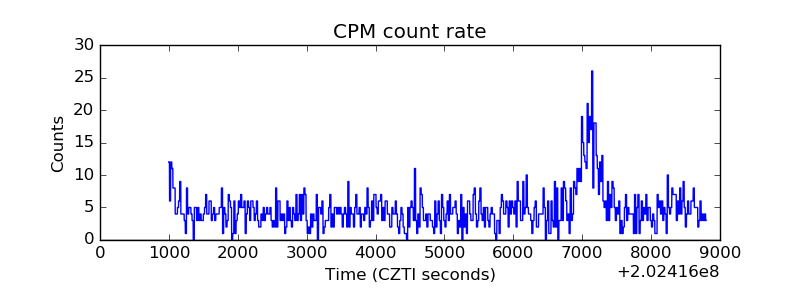 |
| CZT Counter | 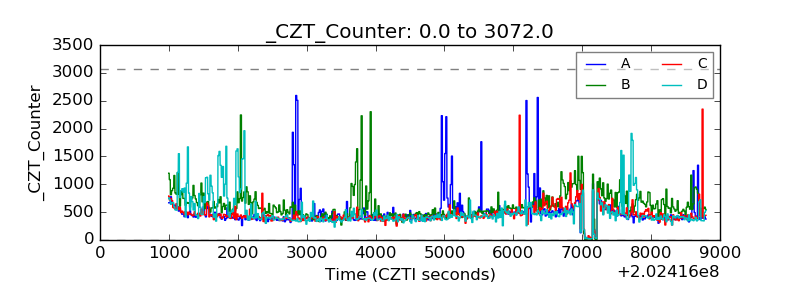 |
| +2.5 Volts monitor |  |
| +5 Volts monitor |  |
| Veto Counter | 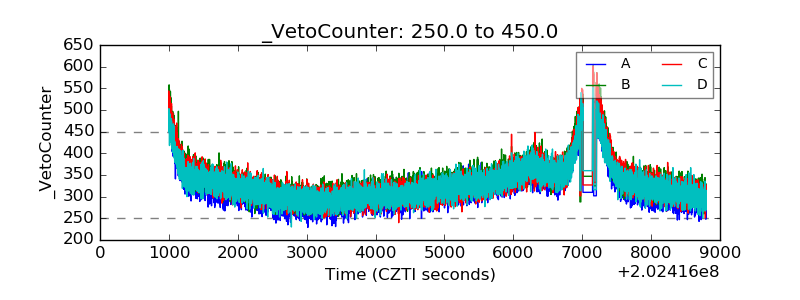 |