| Param | Original file | Final file |
|---|---|---|
| Filename | modeM0/AS1G05_234T02_9000000474_03653cztM0_level2.evt | modeM0/AS1G05_234T02_9000000474_03653cztM0_level2_quad_clean.evt |
| Size (bytes) | 580,325,760 | 97,534,080 |
| Size | 553.4 MB | 93.0 MB |
| Events in quadrant A | 4,008,215 | 598,772 |
| Events in quadrant B | 5,508,069 | 595,401 |
| Events in quadrant C | 3,744,510 | 603,035 |
| Events in quadrant D | 3,765,189 | 593,508 |
| Mode M9 | |||
|---|---|---|---|
| Quadrant | BADHDUFLAG | Total packets | Discarded packets |
| A | 0 | 5 | 0 |
| B | 0 | 5 | 0 |
| C | 0 | 5 | 0 |
| D | 0 | 5 | 0 |
| Mode SS | |||
|---|---|---|---|
| Quadrant | BADHDUFLAG | Total packets | Discarded packets |
| A | 0 | 170 | 0 |
| B | 0 | 170 | 0 |
| C | 0 | 170 | 0 |
| D | 0 | 170 | 0 |
| Mode M0 | |||
|---|---|---|---|
| Quadrant | BADHDUFLAG | Total packets | Discarded packets |
| A | 0 | 17818 | 4 |
| B | 0 | 21849 | 3 |
| C | 0 | 17086 | 3 |
| D | 0 | 17447 | 3 |
| Quadrant | Total seconds | Saturated seconds | Saturation percentage |
|---|---|---|---|
| A | 8091 | 150 | 1.853912% |
| B | 8091 | 205 | 2.533679% |
| C | 8091 | 42 | 0.519095% |
| D | 8091 | 41 | 0.506736% |
Noise dominated data is calculated using 1-second bins in cleaned event files. If a bin has >2000 counts, and if more than 50% of those come from <1% of pixels, then it is considered to be noise-dominated and hence unusable.
| Quadrant | # 1 sec bins | Bins with >0 counts | Bins with >2000 counts | High rate bins dominated by noise | Noise dominated (total time) | Noise dominated (detector-on time) | Marked lightcurve |
|---|---|---|---|---|---|---|---|
| A | 8646 | 8095 | 80 | 80 | 0.93% | 0.99% | 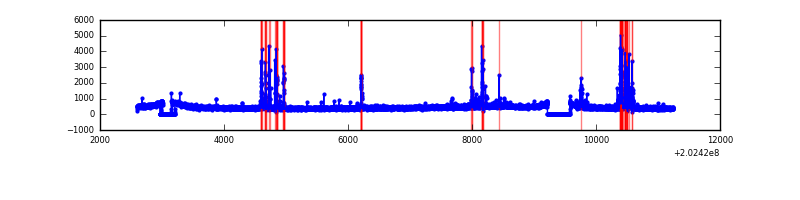 |
| B | 8645 | 8094 | 46 | 46 | 0.53% | 0.57% | 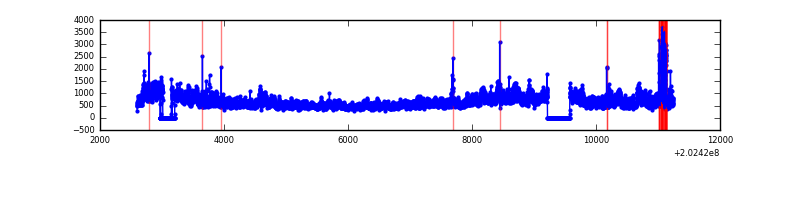 |
| C | 8646 | 8095 | 9 | 9 | 0.10% | 0.11% | 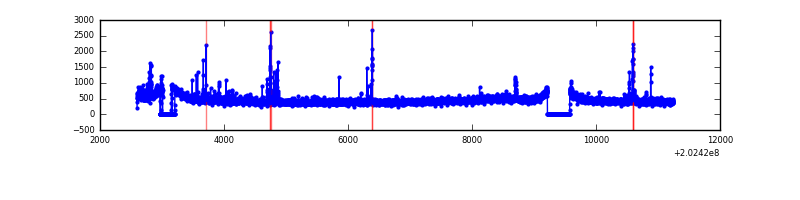 |
| D | 8646 | 8095 | 21 | 21 | 0.24% | 0.26% | 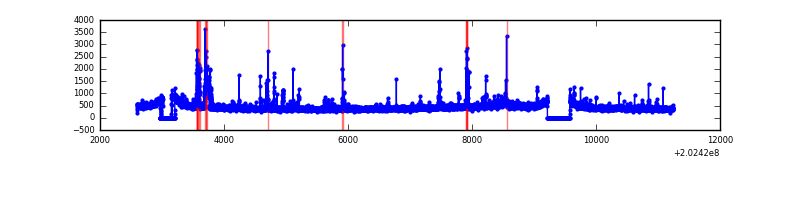 |
Top three noisy pixels from each quadrant. If the there are fewer than three noisy pixels in the level2.evt file, extra rows are filled as -1
| Pixel properties | Quadrant properties | ||||||
|---|---|---|---|---|---|---|---|
| Quadrant | DetID | PixID | Counts | Sigma | Mean | Median | Sigma |
| A | 0 | 50 | 339737 | 1790.01 | 915 | 892 | 189.3 |
| A | 8 | 15 | 54284 | 282.05 | 915 | 892 | 189.3 |
| A | 13 | 251 | 29007 | 148.52 | 915 | 892 | 189.3 |
| B | 14 | 167 | 930569 | 5104.21 | 932 | 904 | 182.1 |
| B | 15 | 204 | 669284 | 3669.66 | 932 | 904 | 182.1 |
| B | 5 | 172 | 142028 | 774.82 | 932 | 904 | 182.1 |
| C | 9 | 247 | 65108 | 303.66 | 908 | 911 | 211.4 |
| C | 2 | 53 | 46420 | 215.27 | 908 | 911 | 211.4 |
| C | 1 | 16 | 29696 | 136.16 | 908 | 911 | 211.4 |
| D | 2 | 118 | 134843 | 621.35 | 898 | 875 | 215.6 |
| D | 2 | 37 | 34668 | 156.73 | 898 | 875 | 215.6 |
| D | 13 | 223 | 34516 | 156.03 | 898 | 875 | 215.6 |
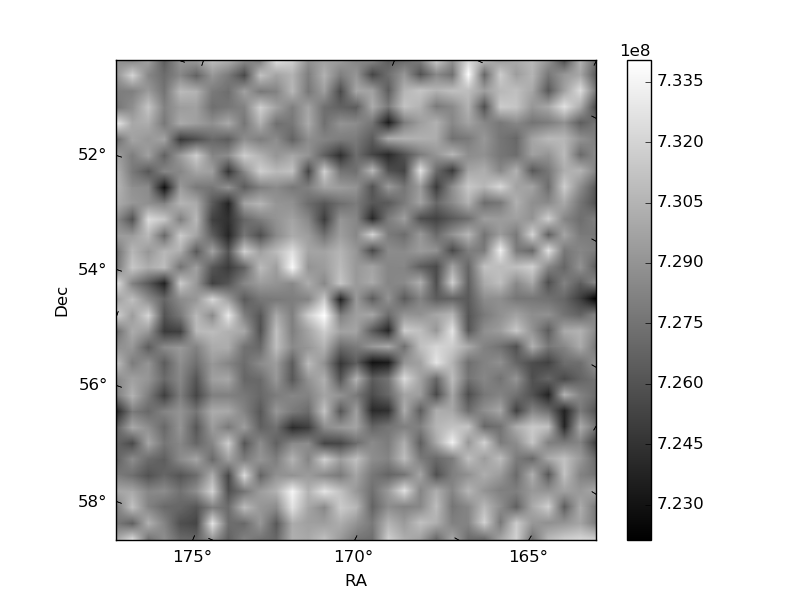
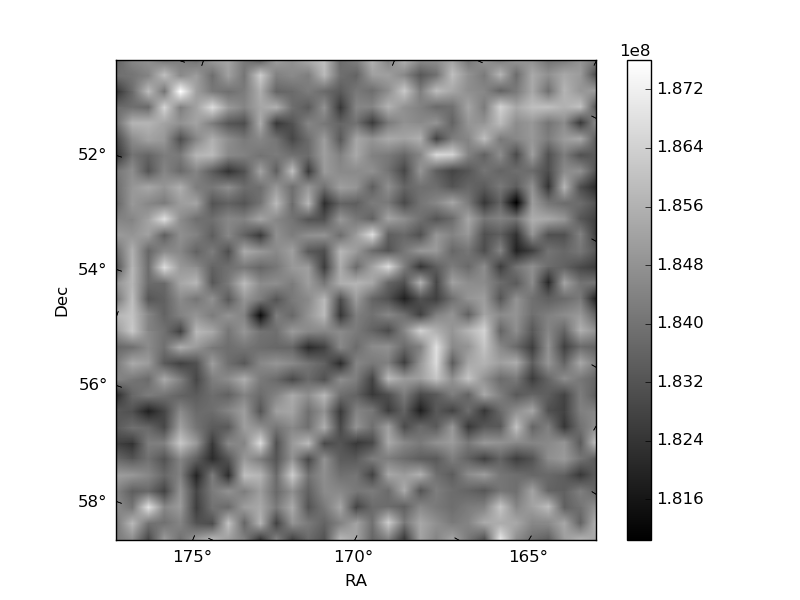
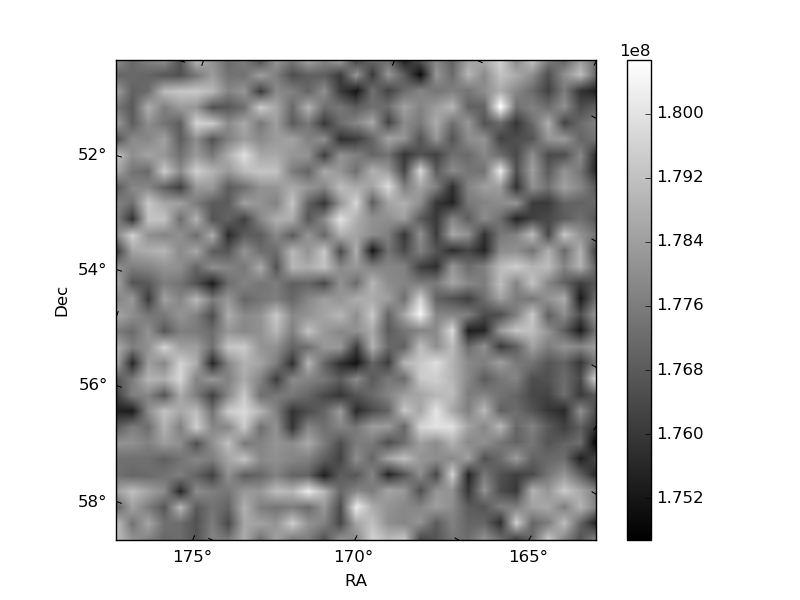
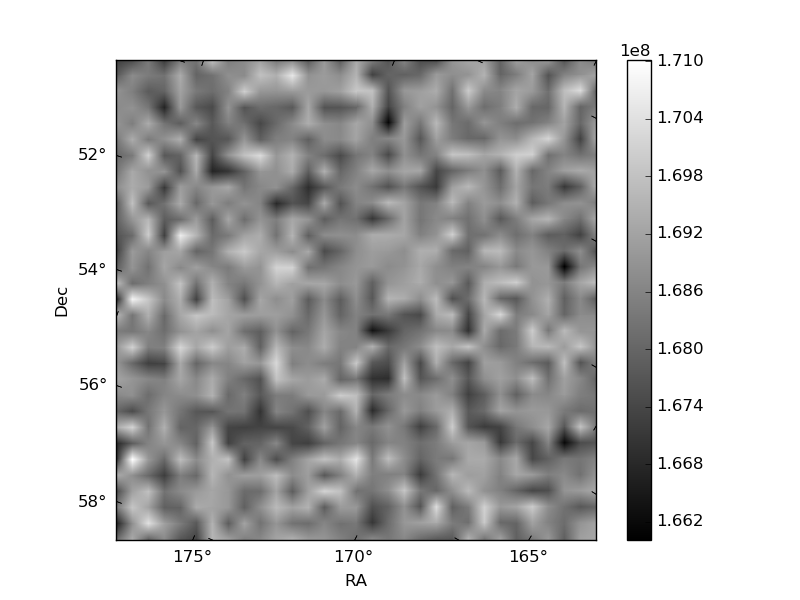
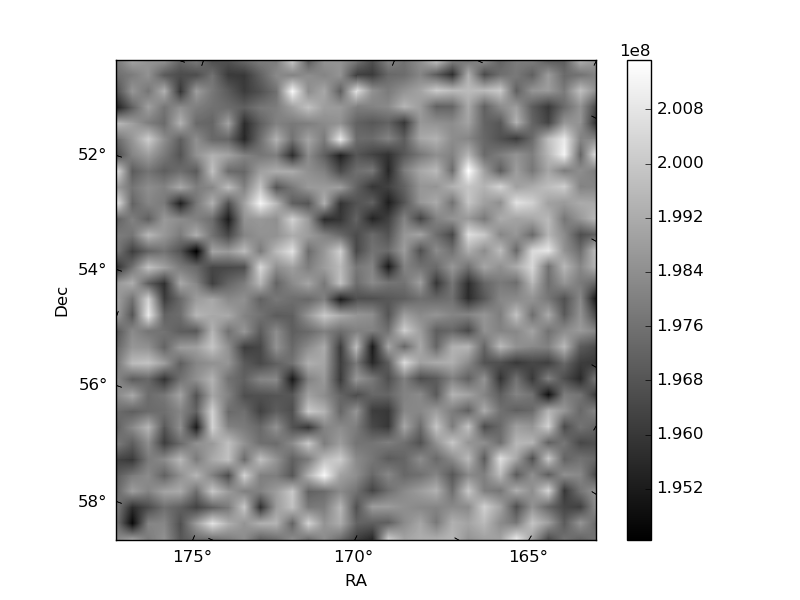
Histogram calculated using DETX and DETY for each event in the final _common_clean file
| Quadrant A | 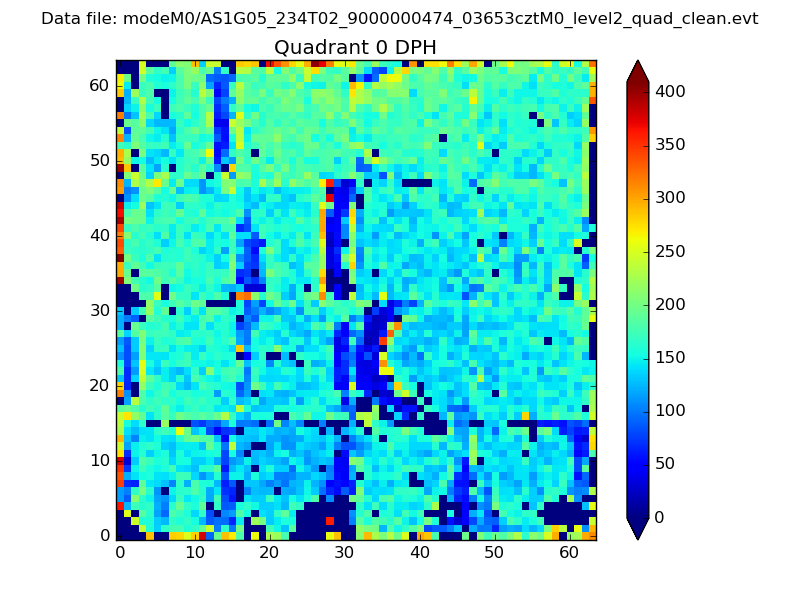 |
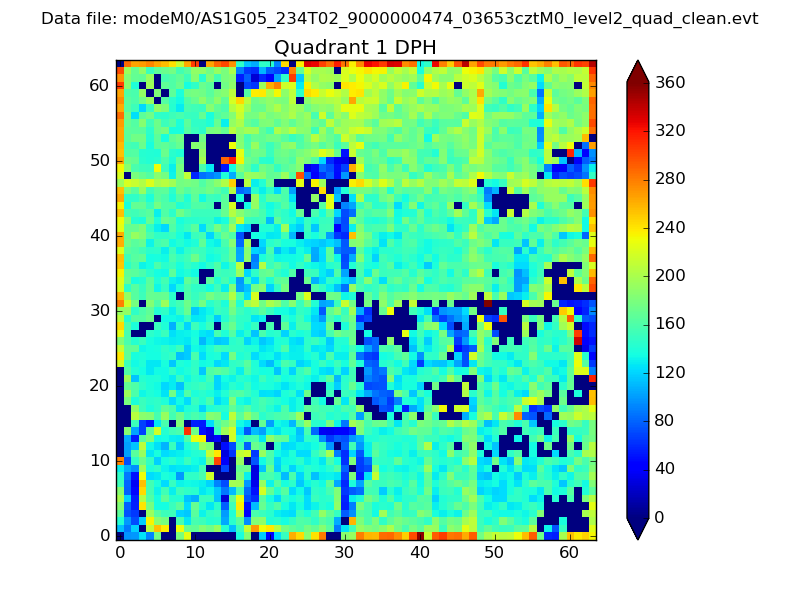 |
Quadrant B |
|---|---|---|---|
| Quadrant D | 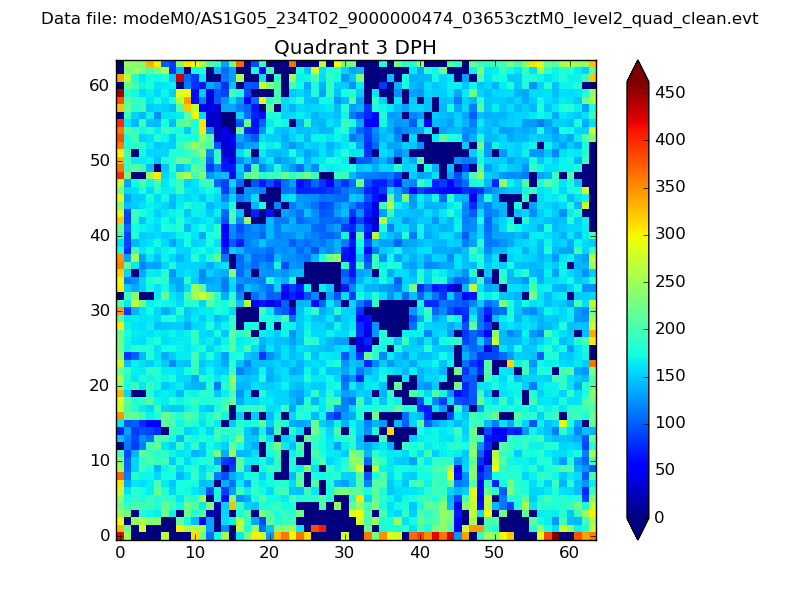 |
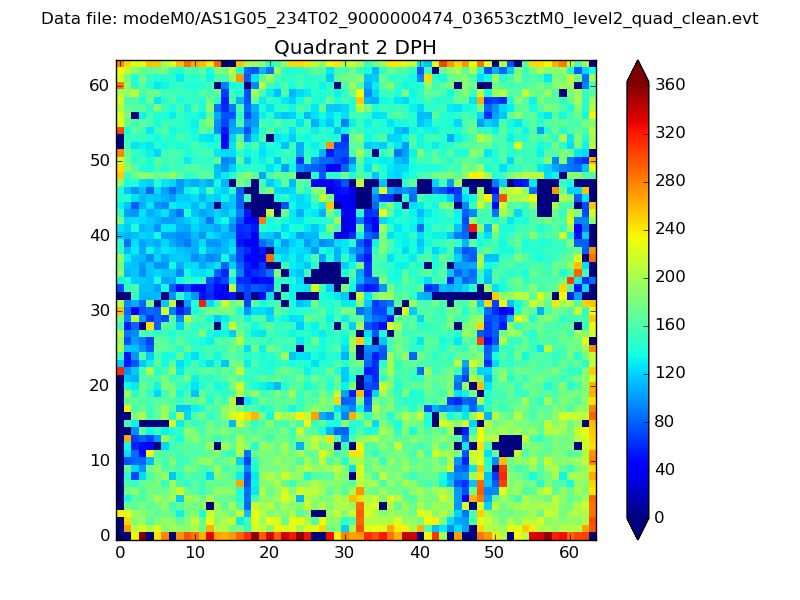 |
Quadrant C |
| Plot type | Count rate plots | Images |
|---|---|---|
| Comparison with Poisson distribution Blue bars denote a histogram of data divided into 1 sec bins. Red curve is a Poisson curve with rate = median count rate of data. |
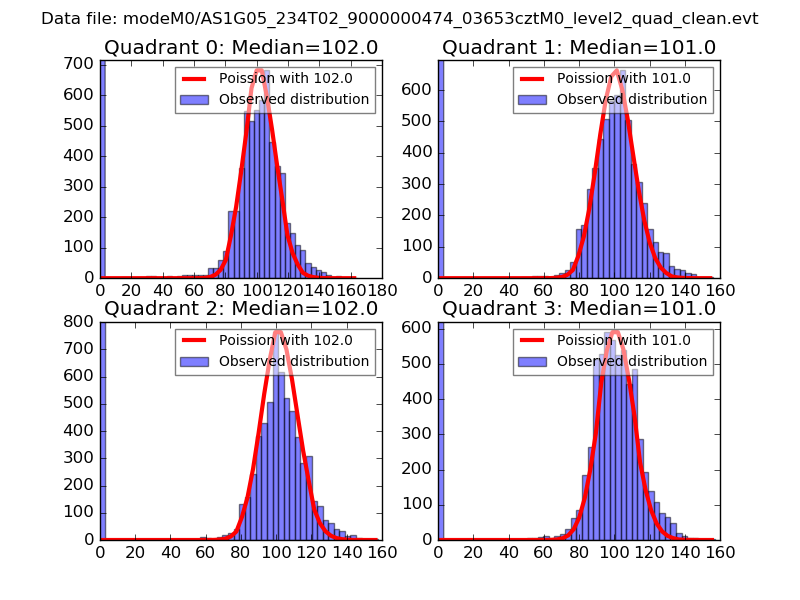 |
 |
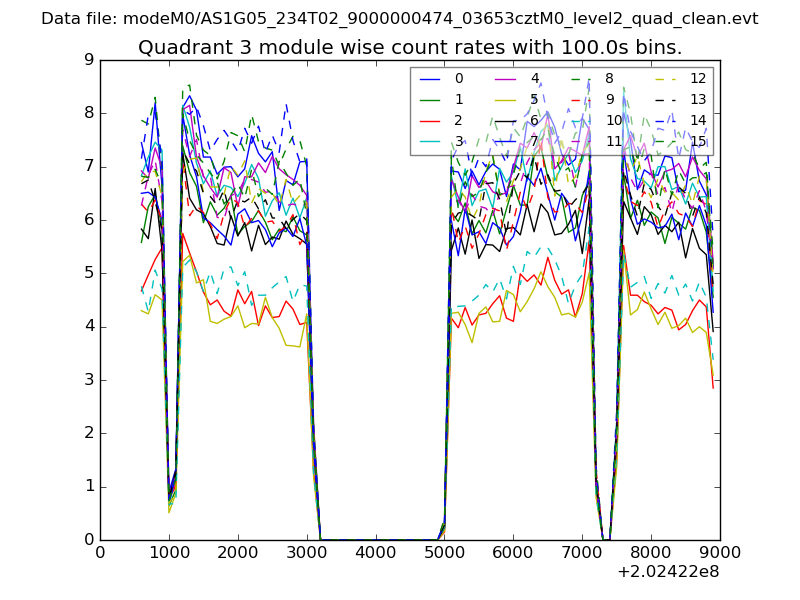
| Quadrant-wise count rates Data is divided into 100 sec bins |
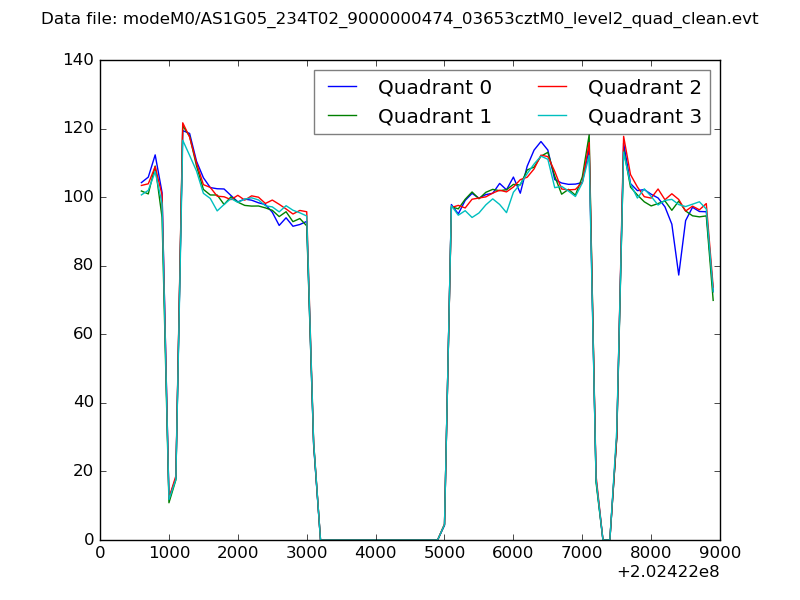 |
|
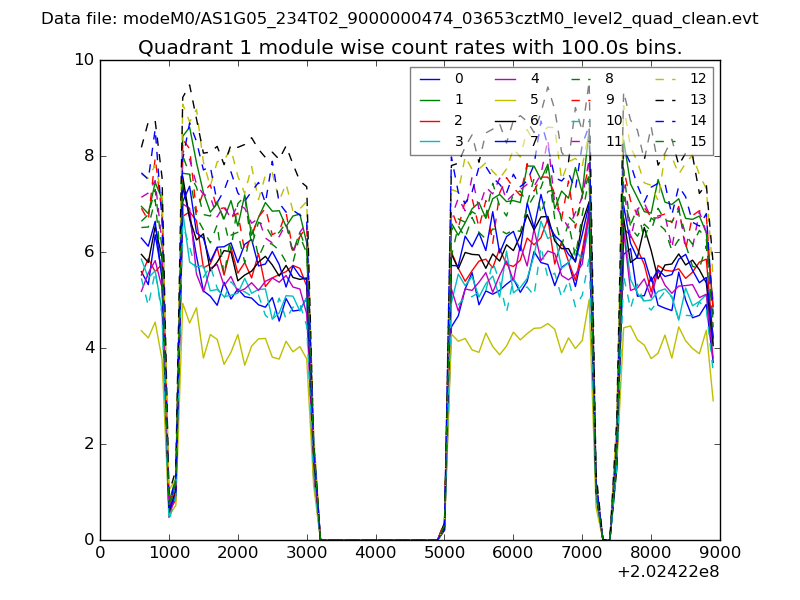
| Module-wise count rates for Quadrant A Data is divided into 100 sec bins |
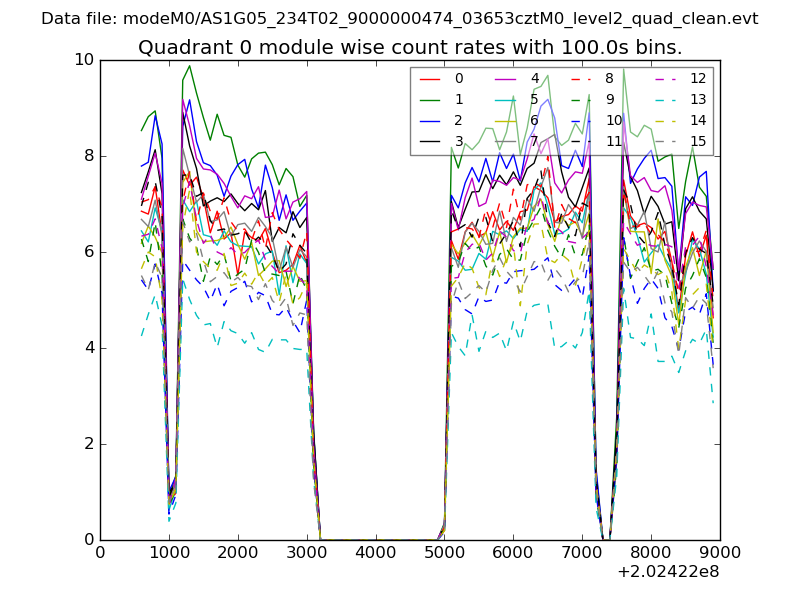 |
 |
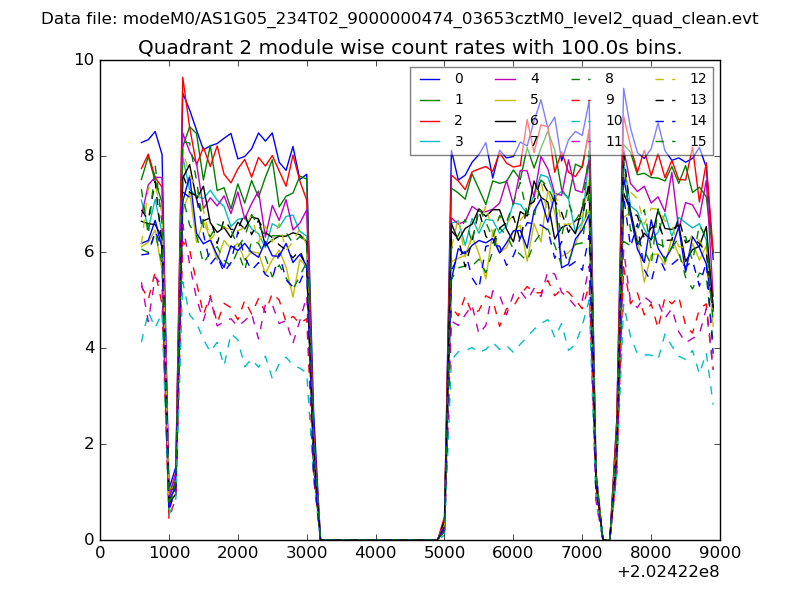
| Module-wise count rates for Quadrant B Data is divided into 100 sec bins |
 |
 |
| Module-wise count rates for Quadrant C Data is divided into 100 sec bins |
 |
 |
| Module-wise count rates for Quadrant D Data is divided into 100 sec bins |
 |
 |
| Parameter | Plot |
|---|---|
| CZT HV Monitor | 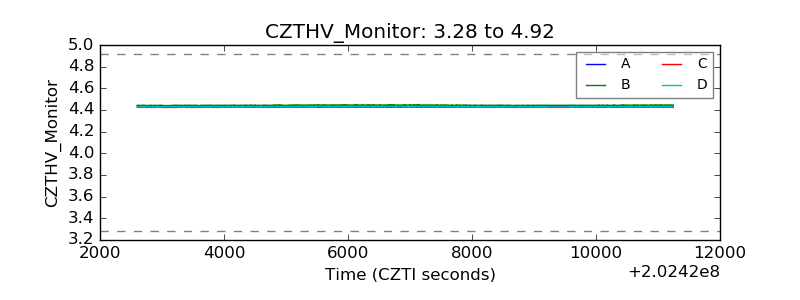 |
| D_VDD | 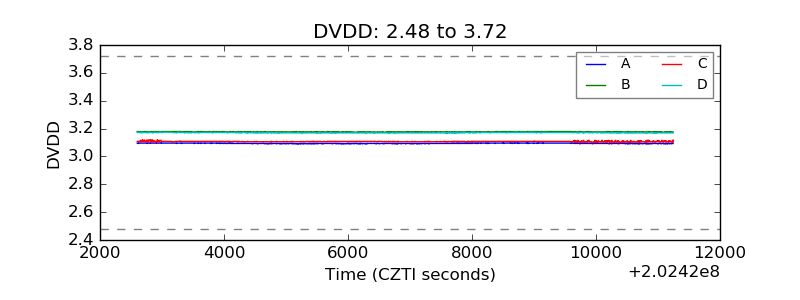 |
| Temperature 1 | 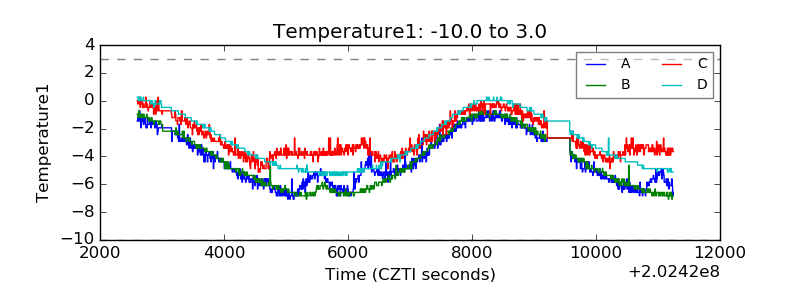 |
| Veto HV Monitor | 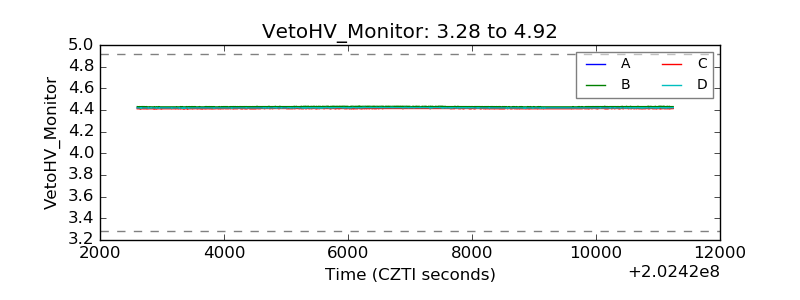 |
| Veto LLD | 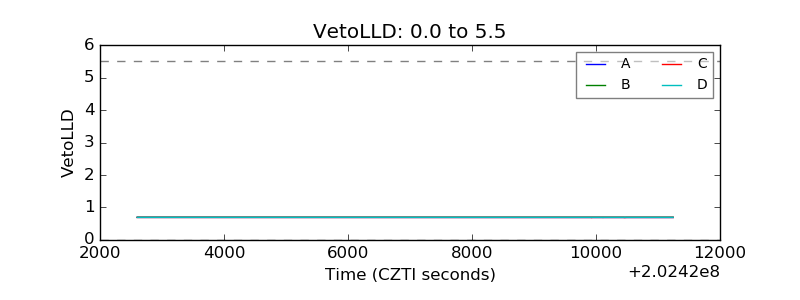 |
| Alpha Counter | 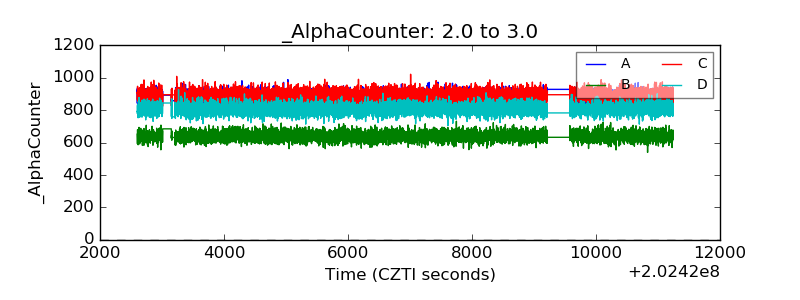 |
| _CPM_Rate | 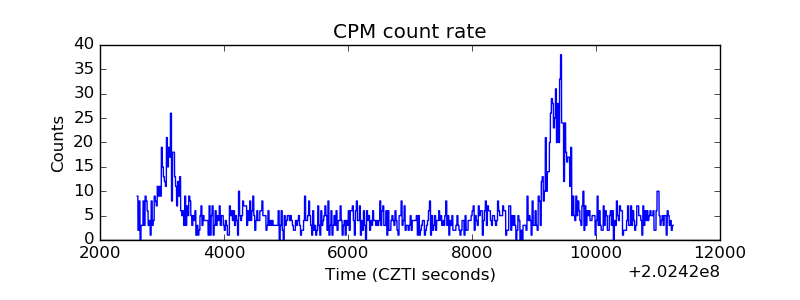 |
| CZT Counter | 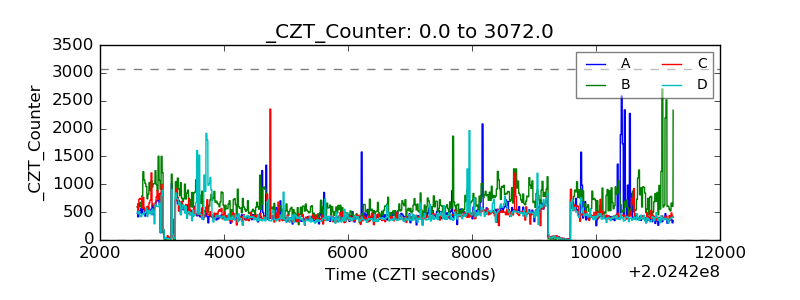 |
| +2.5 Volts monitor |  |
| +5 Volts monitor | 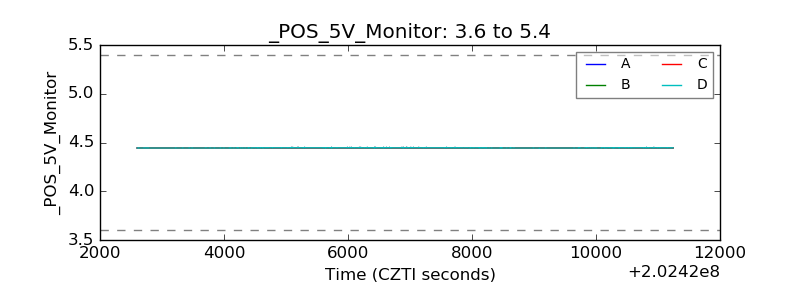 |
| Veto Counter | 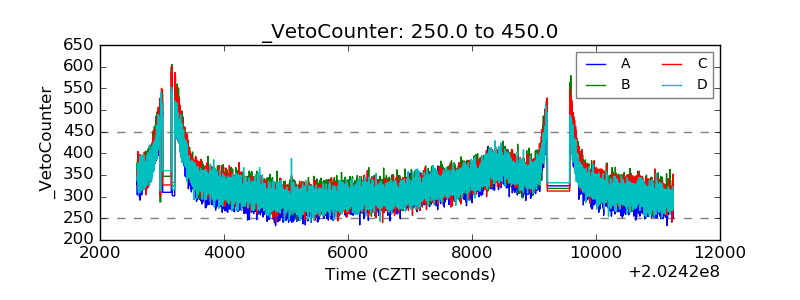 |