| Param | Original file | Final file |
|---|---|---|
| Filename | modeM0/AS1G05_234T02_9000000474_03656cztM0_level2.evt | modeM0/AS1G05_234T02_9000000474_03656cztM0_level2_quad_clean.evt |
| Size (bytes) | 758,623,680 | 111,156,480 |
| Size | 723.5 MB | 106.0 MB |
| Events in quadrant A | 5,356,837 | 645,440 |
| Events in quadrant B | 6,449,343 | 643,025 |
| Events in quadrant C | 5,048,442 | 641,433 |
| Events in quadrant D | 5,327,177 | 626,682 |
| Mode M9 | |||
|---|---|---|---|
| Quadrant | BADHDUFLAG | Total packets | Discarded packets |
| A | 0 | 15 | 0 |
| B | 0 | 15 | 0 |
| C | 0 | 15 | 0 |
| D | 0 | 15 | 0 |
| Mode SS | |||
|---|---|---|---|
| Quadrant | BADHDUFLAG | Total packets | Discarded packets |
| A | 0 | 238 | 0 |
| B | 0 | 238 | 0 |
| C | 0 | 238 | 0 |
| D | 0 | 238 | 0 |
| Mode M0 | |||
|---|---|---|---|
| Quadrant | BADHDUFLAG | Total packets | Discarded packets |
| A | 0 | 24207 | 3 |
| B | 0 | 26938 | 2 |
| C | 0 | 23669 | 2 |
| D | 0 | 24686 | 2 |
| Quadrant | Total seconds | Saturated seconds | Saturation percentage |
|---|---|---|---|
| A | 11701 | 114 | 0.974276% |
| B | 11701 | 160 | 1.367404% |
| C | 11701 | 43 | 0.367490% |
| D | 11701 | 87 | 0.743526% |
Noise dominated data is calculated using 1-second bins in cleaned event files. If a bin has >2000 counts, and if more than 50% of those come from <1% of pixels, then it is considered to be noise-dominated and hence unusable.
| Quadrant | # 1 sec bins | Bins with >0 counts | Bins with >2000 counts | High rate bins dominated by noise | Noise dominated (total time) | Noise dominated (detector-on time) | Marked lightcurve |
|---|---|---|---|---|---|---|---|
| A | 13187 | 11704 | 25 | 25 | 0.19% | 0.21% | 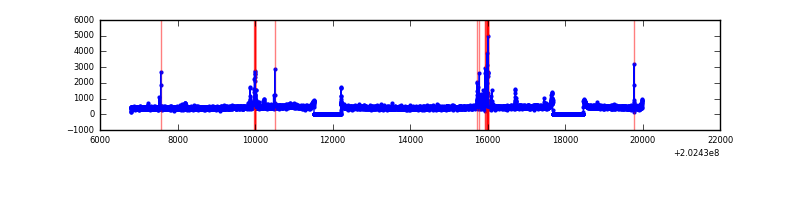 |
| B | 13187 | 11704 | 27 | 27 | 0.20% | 0.23% | 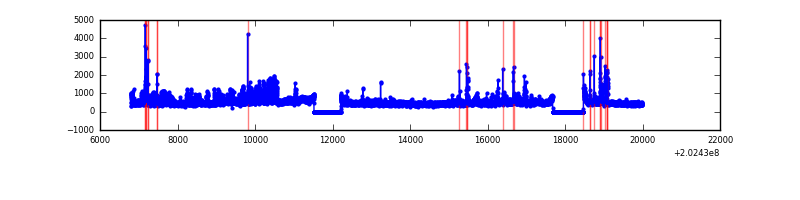 |
| C | 13187 | 11704 | 0 | 0 | 0.00% | 0.00% | 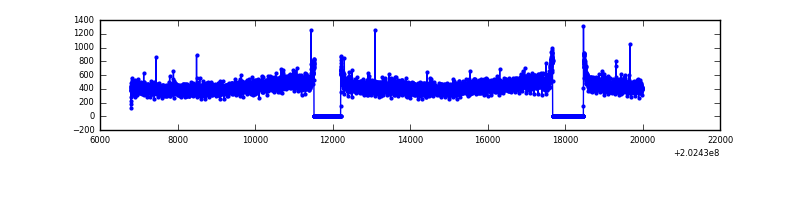 |
| D | 13187 | 11704 | 32 | 32 | 0.24% | 0.27% | 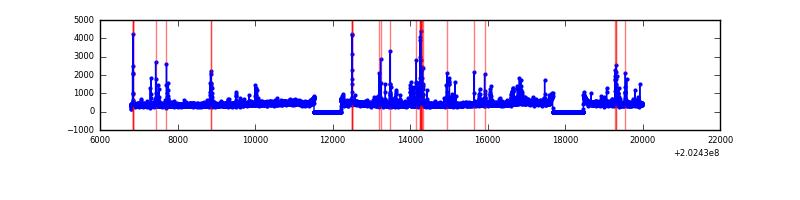 |
Top three noisy pixels from each quadrant. If the there are fewer than three noisy pixels in the level2.evt file, extra rows are filled as -1
| Pixel properties | Quadrant properties | ||||||
|---|---|---|---|---|---|---|---|
| Quadrant | DetID | PixID | Counts | Sigma | Mean | Median | Sigma |
| A | 0 | 50 | 146855 | 537.3 | 1317 | 1286 | 270.9 |
| A | 13 | 14 | 33284 | 118.11 | 1317 | 1286 | 270.9 |
| A | 8 | 15 | 32739 | 116.09 | 1317 | 1286 | 270.9 |
| B | 14 | 167 | 527832 | 2034.2 | 1335 | 1301 | 258.8 |
| B | 15 | 204 | 309879 | 1192.16 | 1335 | 1301 | 258.8 |
| B | 5 | 172 | 137517 | 526.26 | 1335 | 1301 | 258.8 |
| C | 13 | 61 | 11041 | 32.44 | 1287 | 1291 | 300.5 |
| C | 1 | 16 | 9559 | 27.51 | 1287 | 1291 | 300.5 |
| C | 12 | 4 | 6987 | 18.95 | 1287 | 1291 | 300.5 |
| D | 13 | 239 | 170903 | 545.46 | 1280 | 1242 | 311.0 |
| D | 13 | 223 | 124905 | 397.58 | 1280 | 1242 | 311.0 |
| D | 3 | 247 | 73237 | 231.47 | 1280 | 1242 | 311.0 |
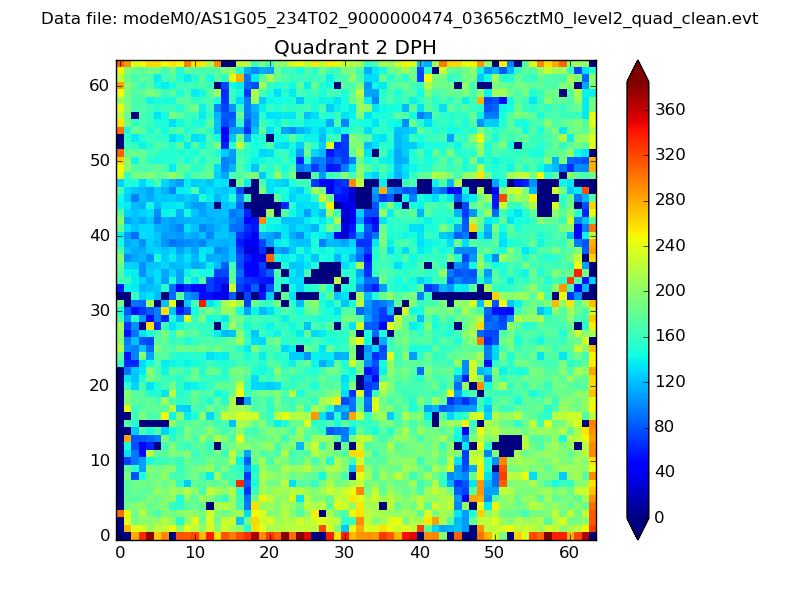
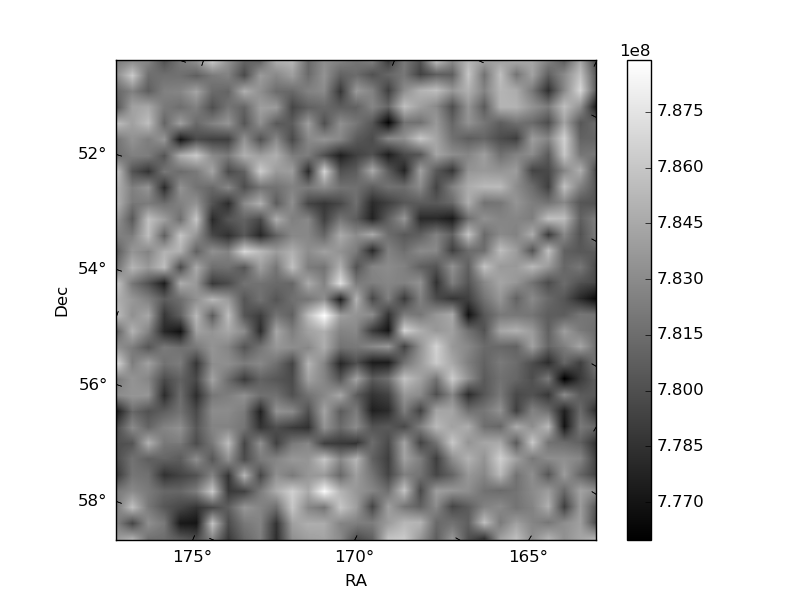
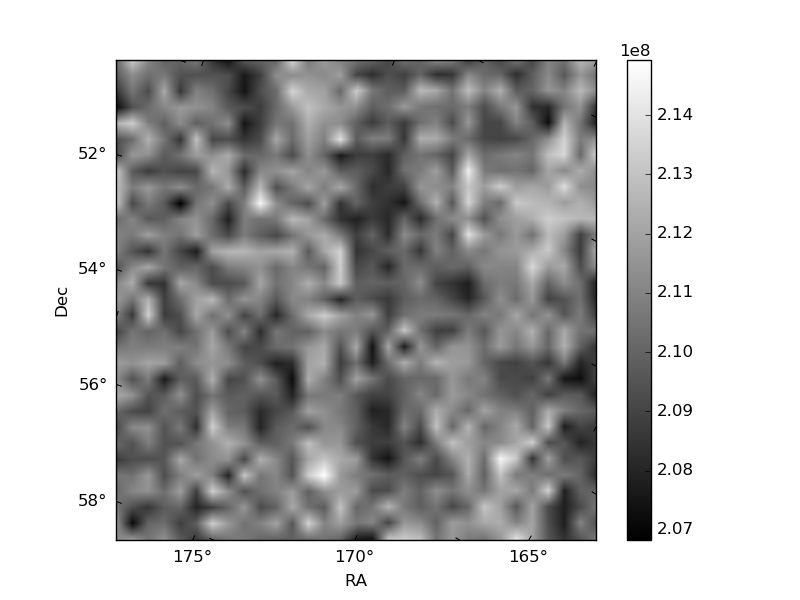
Histogram calculated using DETX and DETY for each event in the final _common_clean file
| Quadrant A | 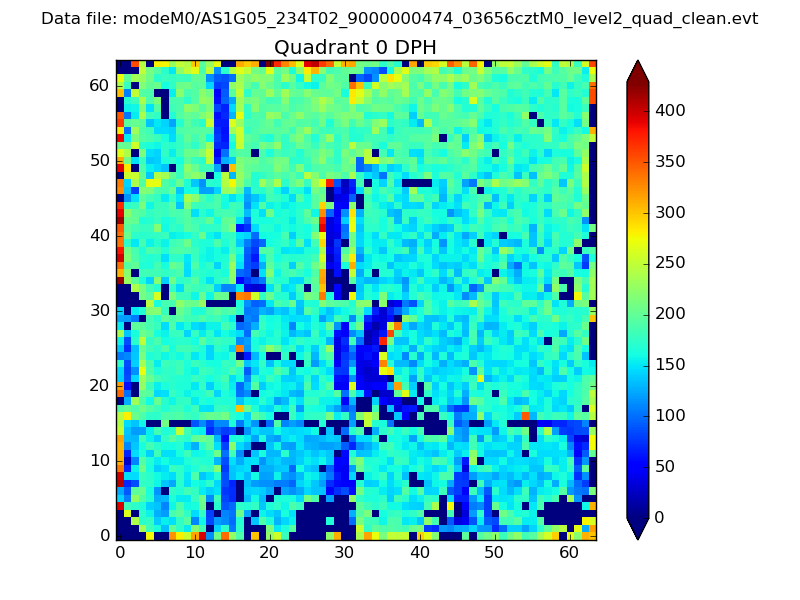 |
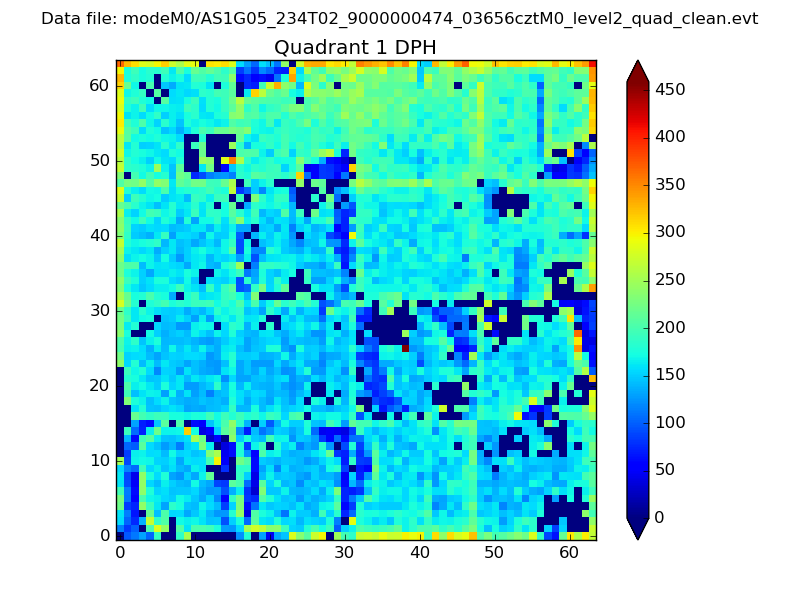 |
Quadrant B |
|---|---|---|---|
| Quadrant D | 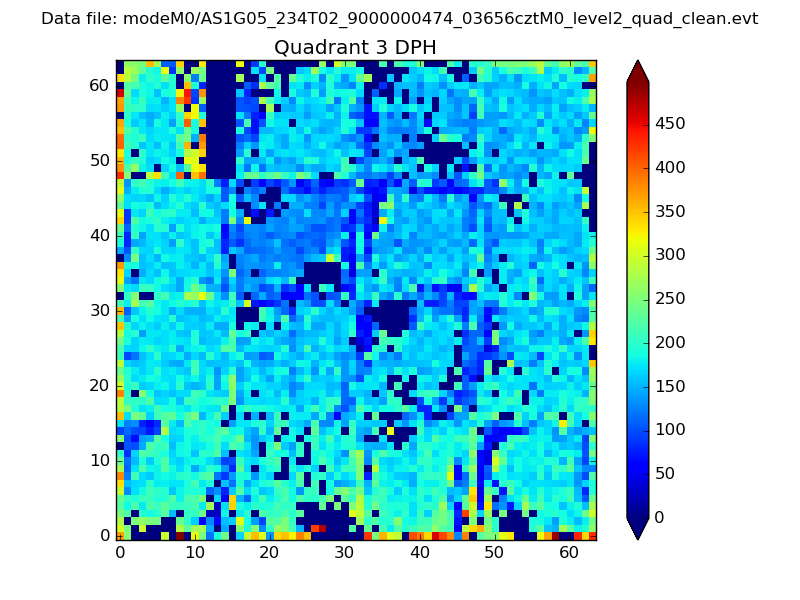 |
 |
Quadrant C |
| Plot type | Count rate plots | Images |
|---|---|---|
| Comparison with Poisson distribution Blue bars denote a histogram of data divided into 1 sec bins. Red curve is a Poisson curve with rate = median count rate of data. |
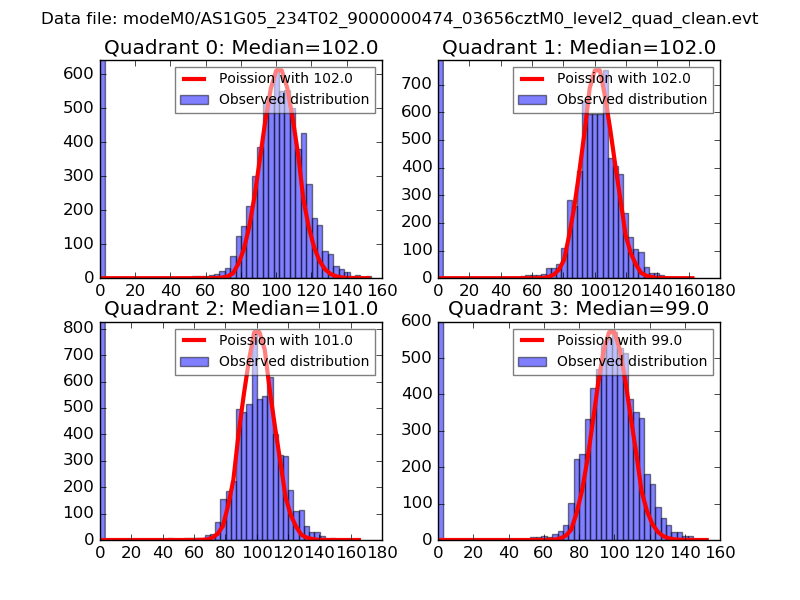 |
 |
| Quadrant-wise count rates Data is divided into 100 sec bins |
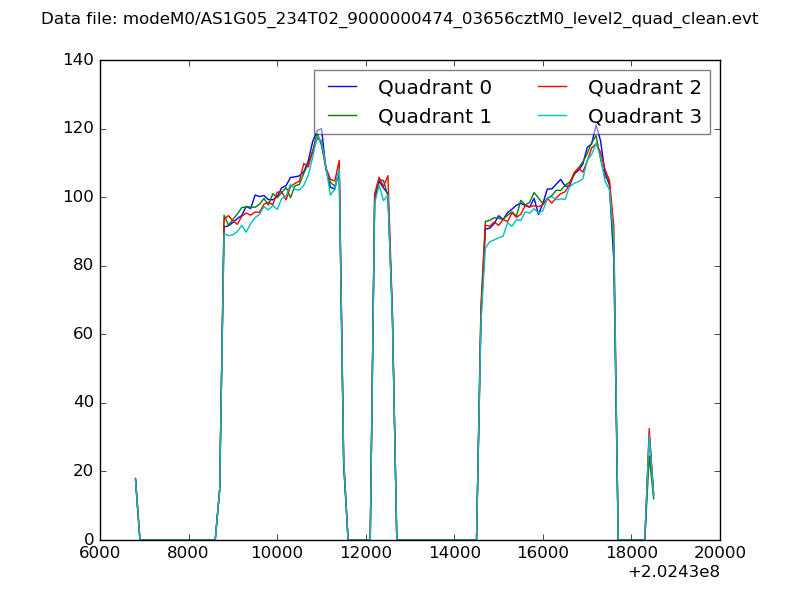 |
|
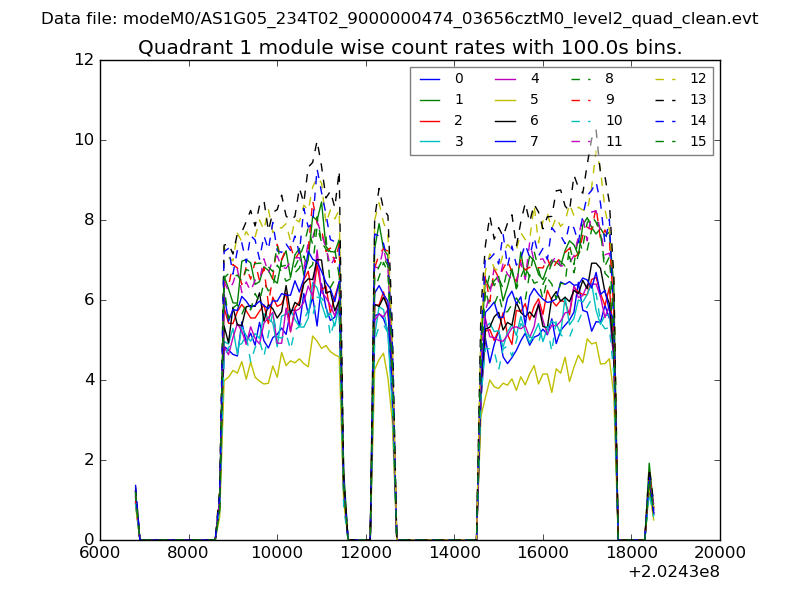
| Module-wise count rates for Quadrant A Data is divided into 100 sec bins |
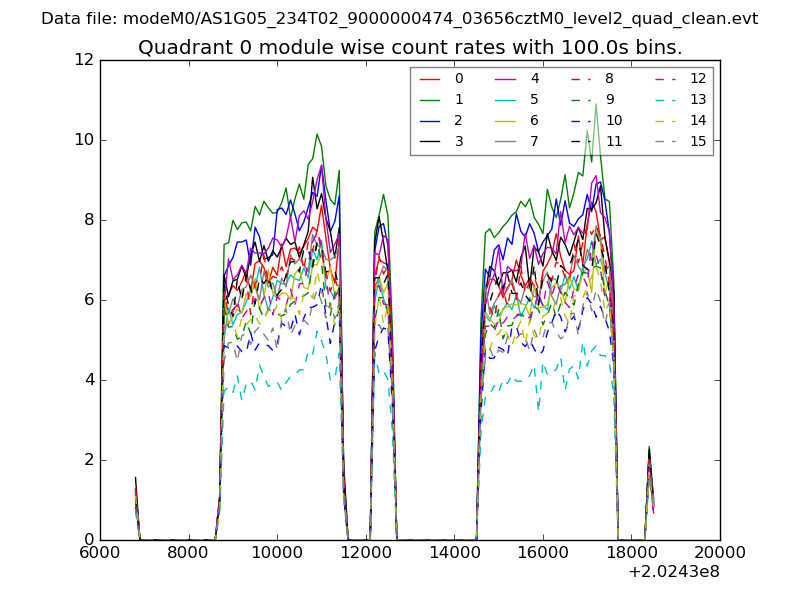 |
 |
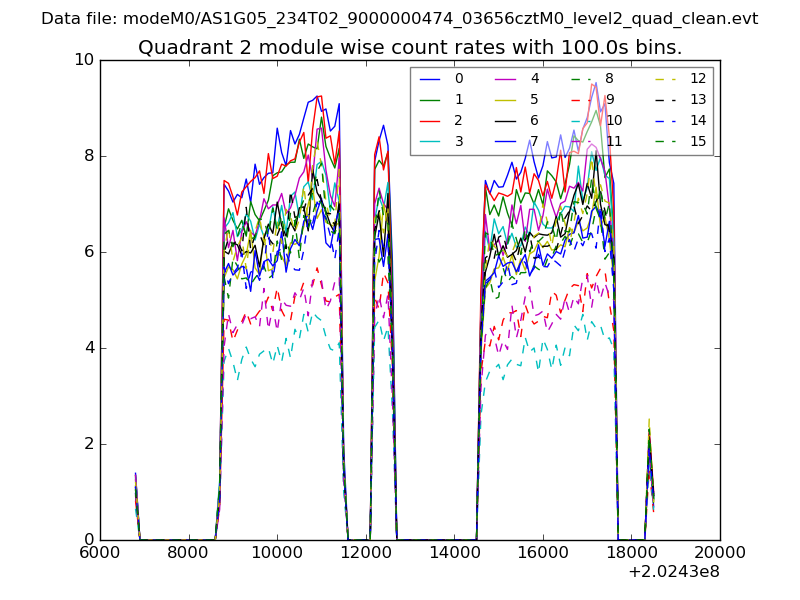
| Module-wise count rates for Quadrant B Data is divided into 100 sec bins |
 |
 |
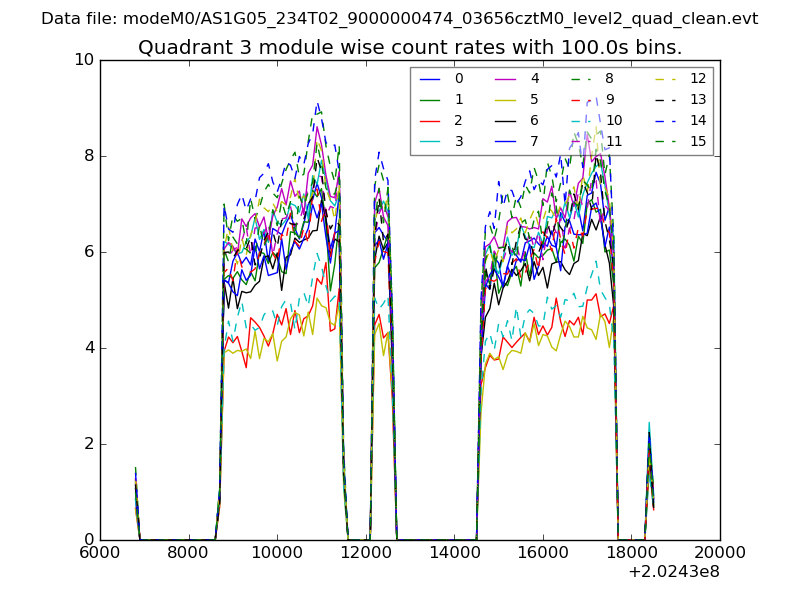
| Module-wise count rates for Quadrant C Data is divided into 100 sec bins |
 |
 |
| Module-wise count rates for Quadrant D Data is divided into 100 sec bins |
 |
 |
| Parameter | Plot |
|---|---|
| CZT HV Monitor | 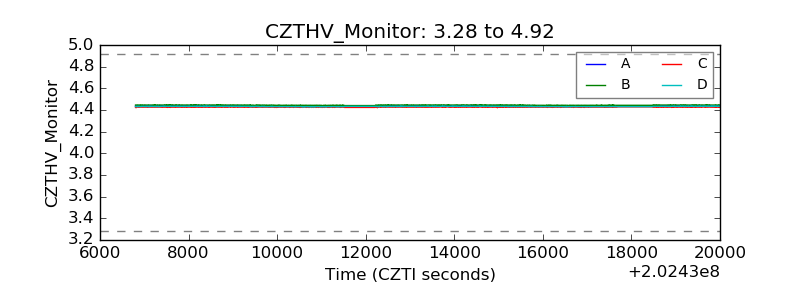 |
| D_VDD |  |
| Temperature 1 |  |
| Veto HV Monitor | 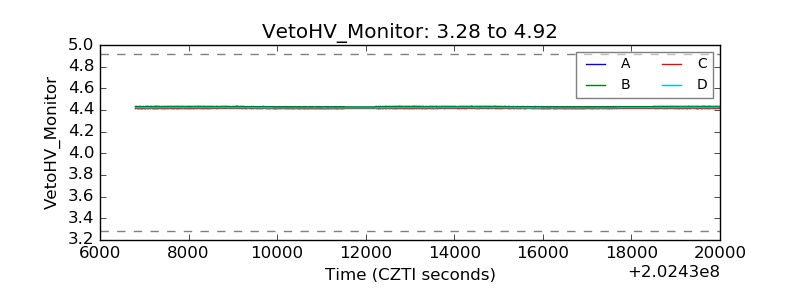 |
| Veto LLD | 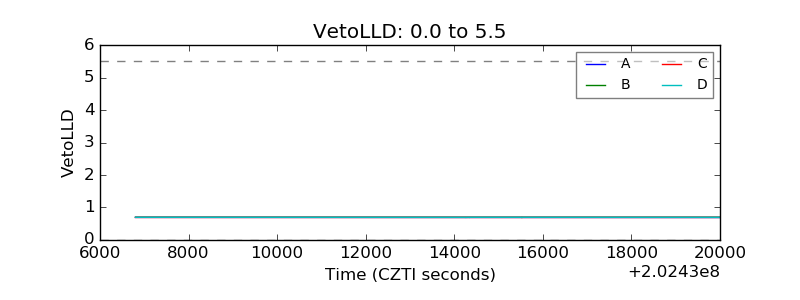 |
| Alpha Counter | 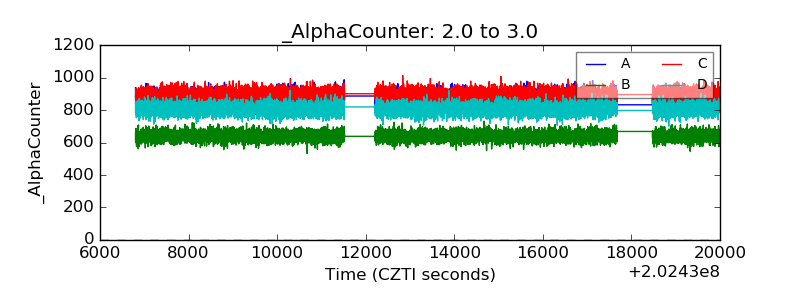 |
| _CPM_Rate | 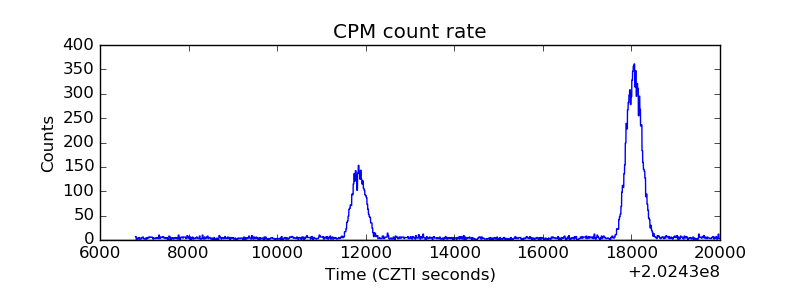 |
| CZT Counter | 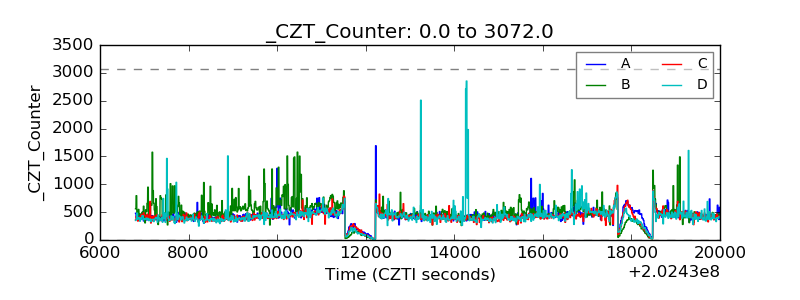 |
| +2.5 Volts monitor |  |
| +5 Volts monitor |  |
| _ROLL_ROT | 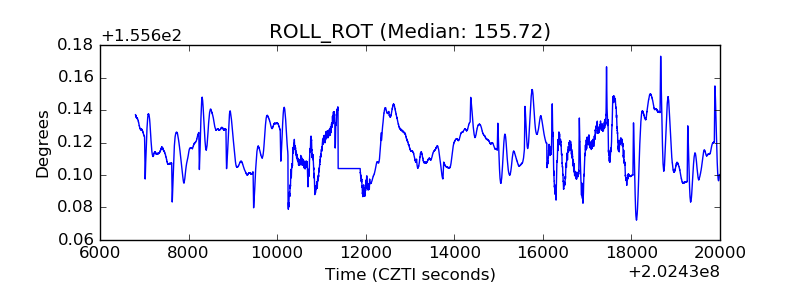 |
| _Roll_DEC | 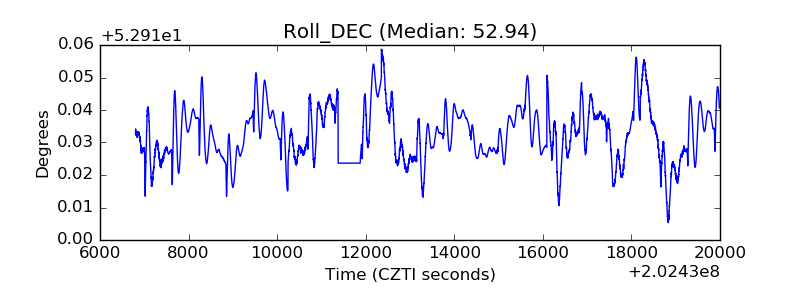 |
| _Roll_RA | 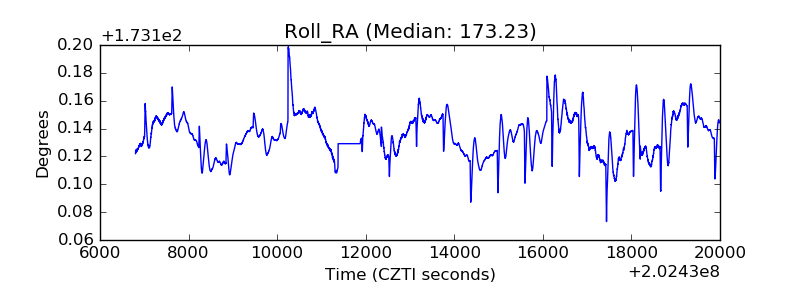 |
| Veto Counter | 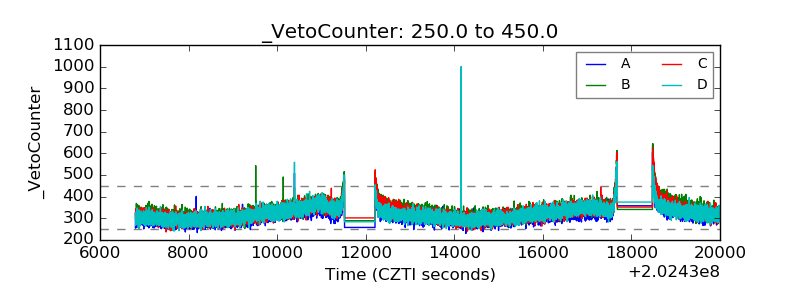 |