| Param | Original file | Final file |
|---|---|---|
| Filename | modeM0/AS1G05_234T02_9000000474_03657cztM0_level2.evt | modeM0/AS1G05_234T02_9000000474_03657cztM0_level2_quad_clean.evt |
| Size (bytes) | 430,007,040 | 59,670,720 |
| Size | 410.1 MB | 56.9 MB |
| Events in quadrant A | 3,182,919 | 337,671 |
| Events in quadrant B | 3,396,626 | 339,519 |
| Events in quadrant C | 2,920,977 | 338,554 |
| Events in quadrant D | 3,074,057 | 331,068 |
| Mode M9 | |||
|---|---|---|---|
| Quadrant | BADHDUFLAG | Total packets | Discarded packets |
| A | 0 | 12 | 0 |
| B | 0 | 12 | 0 |
| C | 0 | 12 | 0 |
| D | 0 | 13 | 0 |
| Mode SS | |||
|---|---|---|---|
| Quadrant | BADHDUFLAG | Total packets | Discarded packets |
| A | 0 | 134 | 0 |
| B | 0 | 134 | 0 |
| C | 0 | 134 | 0 |
| D | 0 | 134 | 0 |
| Mode M0 | |||
|---|---|---|---|
| Quadrant | BADHDUFLAG | Total packets | Discarded packets |
| A | 0 | 13945 | 3 |
| B | 0 | 14400 | 2 |
| C | 0 | 13444 | 2 |
| D | 0 | 13952 | 2 |
| Quadrant | Total seconds | Saturated seconds | Saturation percentage |
|---|---|---|---|
| A | 6590 | 96 | 1.456753% |
| B | 6590 | 100 | 1.517451% |
| C | 6590 | 34 | 0.515933% |
| D | 6590 | 83 | 1.259484% |
Noise dominated data is calculated using 1-second bins in cleaned event files. If a bin has >2000 counts, and if more than 50% of those come from <1% of pixels, then it is considered to be noise-dominated and hence unusable.
| Quadrant | # 1 sec bins | Bins with >0 counts | Bins with >2000 counts | High rate bins dominated by noise | Noise dominated (total time) | Noise dominated (detector-on time) | Marked lightcurve |
|---|---|---|---|---|---|---|---|
| A | 7580 | 6591 | 34 | 34 | 0.45% | 0.52% | 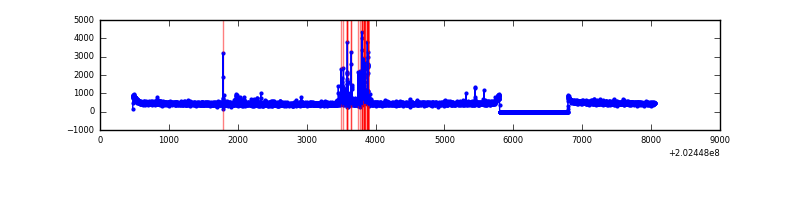 |
| B | 7580 | 6591 | 15 | 15 | 0.20% | 0.23% | 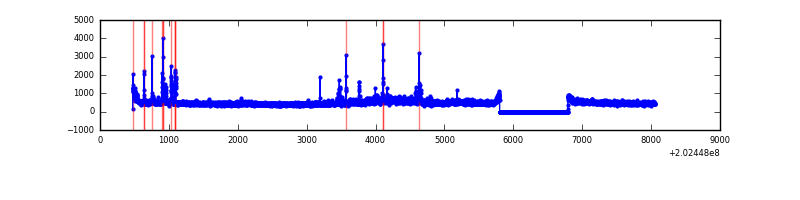 |
| C | 7580 | 6591 | 5 | 5 | 0.07% | 0.08% | 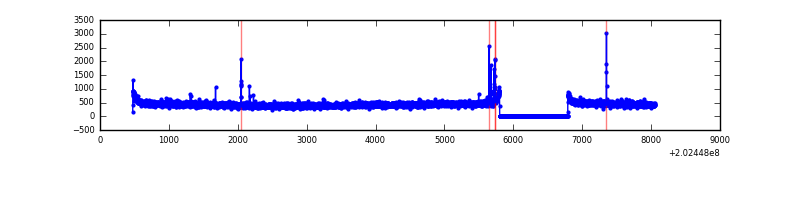 |
| D | 7580 | 6591 | 31 | 31 | 0.41% | 0.47% | 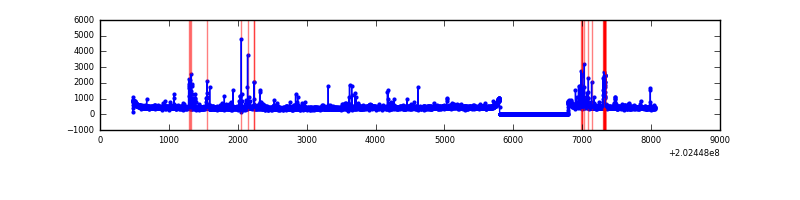 |
Top three noisy pixels from each quadrant. If the there are fewer than three noisy pixels in the level2.evt file, extra rows are filled as -1
| Pixel properties | Quadrant properties | ||||||
|---|---|---|---|---|---|---|---|
| Quadrant | DetID | PixID | Counts | Sigma | Mean | Median | Sigma |
| A | 0 | 50 | 177534 | 1123.21 | 759 | 741 | 157.4 |
| A | 13 | 164 | 32338 | 200.74 | 759 | 741 | 157.4 |
| A | 13 | 14 | 17109 | 103.99 | 759 | 741 | 157.4 |
| B | 15 | 204 | 201181 | 1340.98 | 769 | 748 | 149.5 |
| B | 5 | 172 | 56228 | 371.19 | 769 | 748 | 149.5 |
| B | 5 | 70 | 44874 | 295.22 | 769 | 748 | 149.5 |
| C | 9 | 247 | 17216 | 95.45 | 737 | 740 | 172.6 |
| C | 1 | 16 | 11434 | 61.95 | 737 | 740 | 172.6 |
| C | 7 | 220 | 7198 | 37.41 | 737 | 740 | 172.6 |
| D | 13 | 239 | 150049 | 843.95 | 732 | 711 | 177.0 |
| D | 2 | 37 | 48635 | 270.83 | 732 | 711 | 177.0 |
| D | 2 | 14 | 24689 | 135.51 | 732 | 711 | 177.0 |
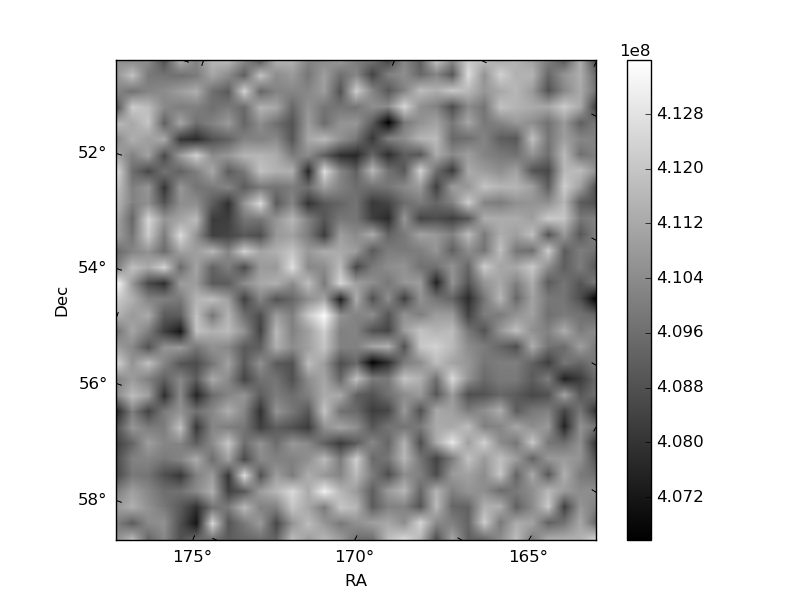
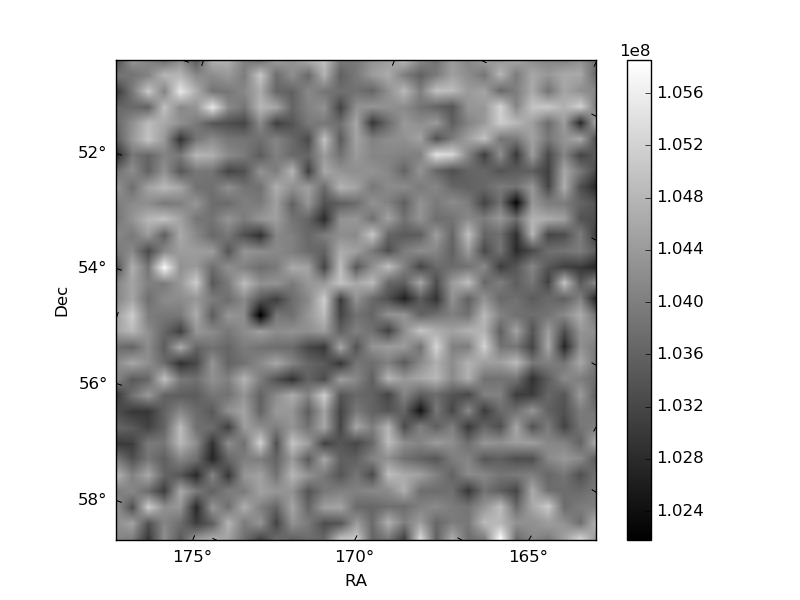
Histogram calculated using DETX and DETY for each event in the final _common_clean file
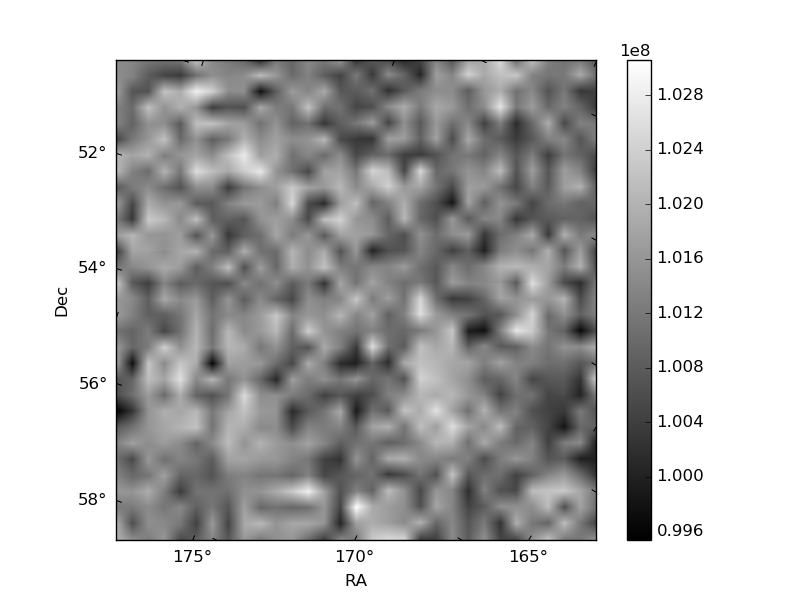
| Quadrant A | 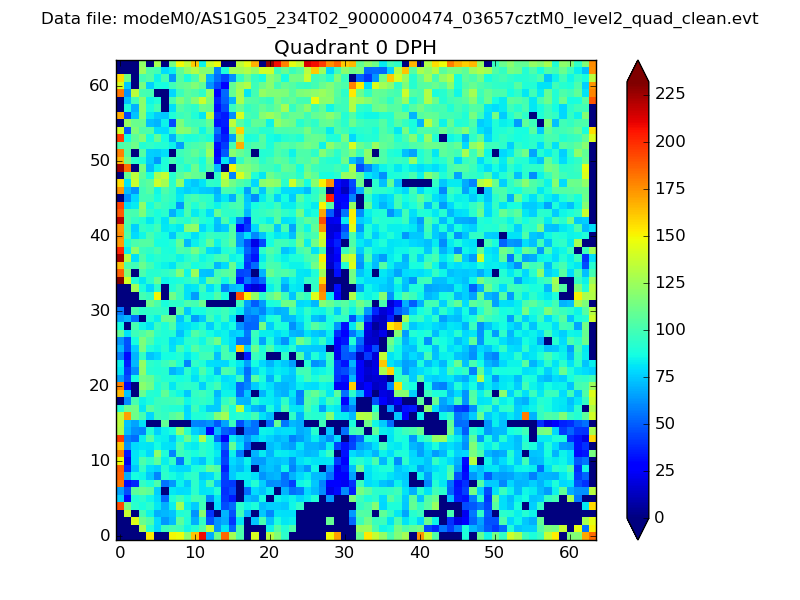 |
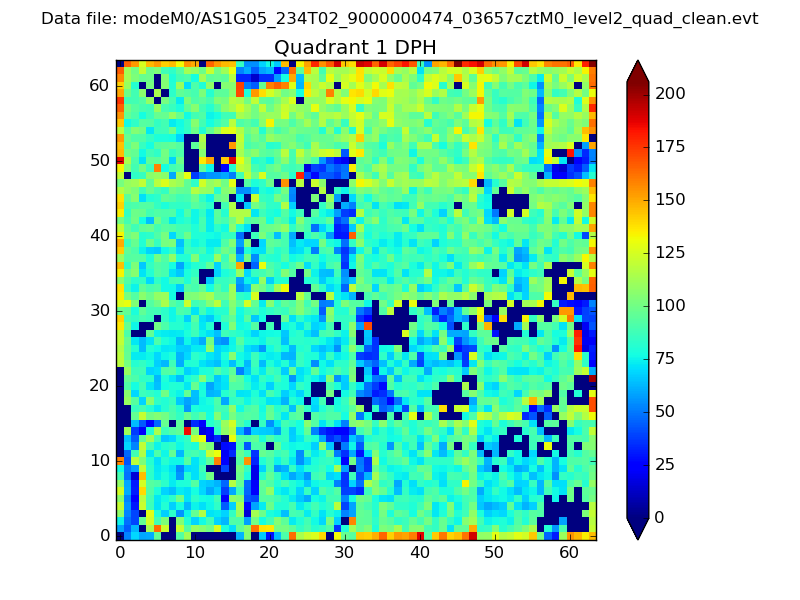 |
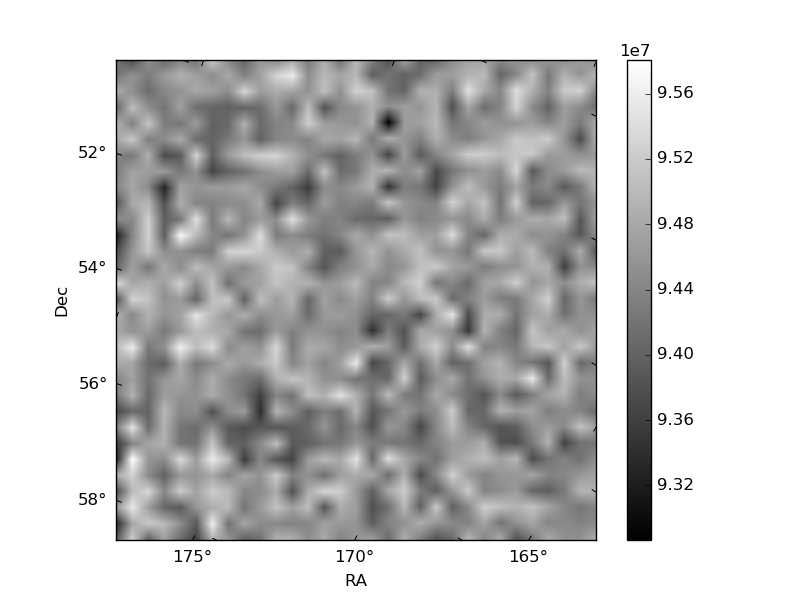
Quadrant B |
|---|---|---|---|
| Quadrant D | 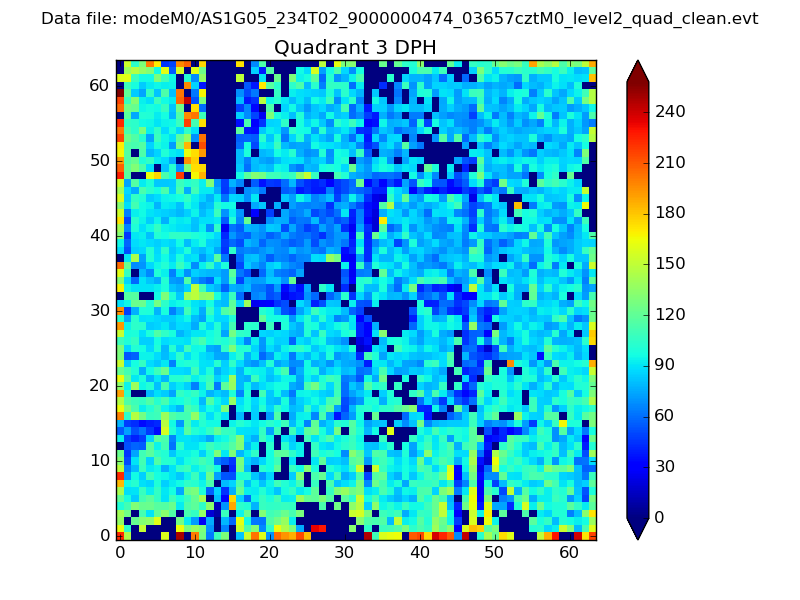 |
 |
Quadrant C |
| Plot type | Count rate plots | Images |
|---|---|---|
| Comparison with Poisson distribution Blue bars denote a histogram of data divided into 1 sec bins. Red curve is a Poisson curve with rate = median count rate of data. |
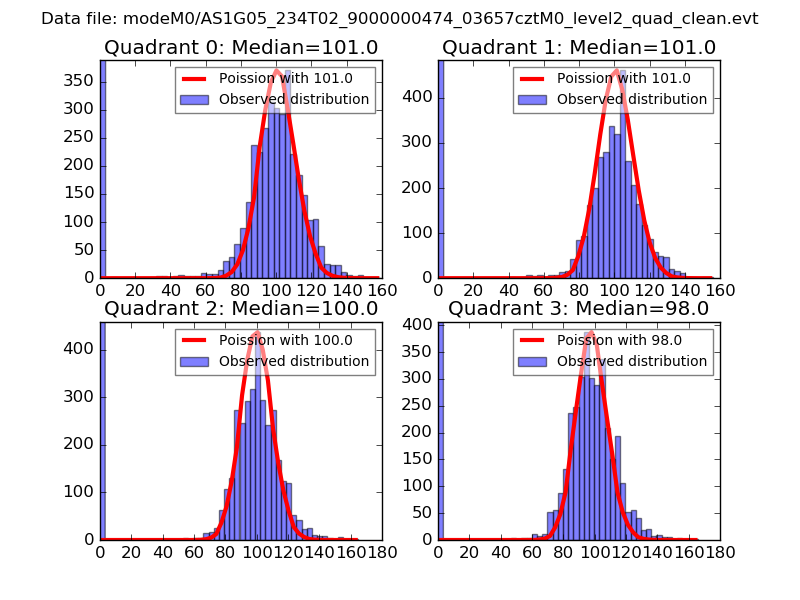 |
 |
| Quadrant-wise count rates Data is divided into 100 sec bins |
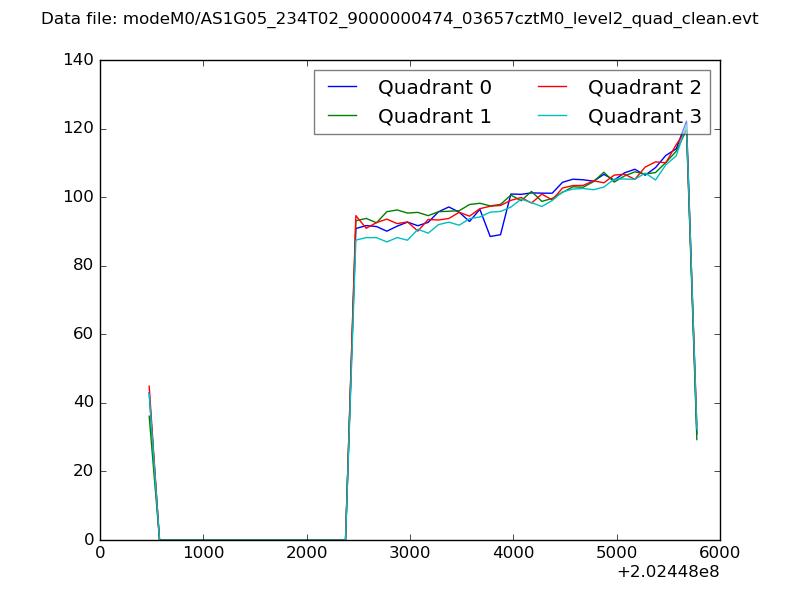 |
|
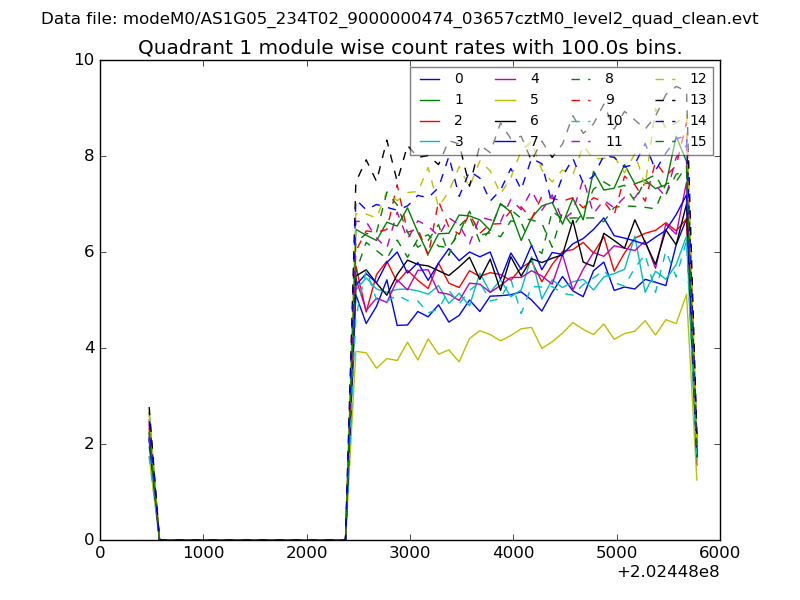
| Module-wise count rates for Quadrant A Data is divided into 100 sec bins |
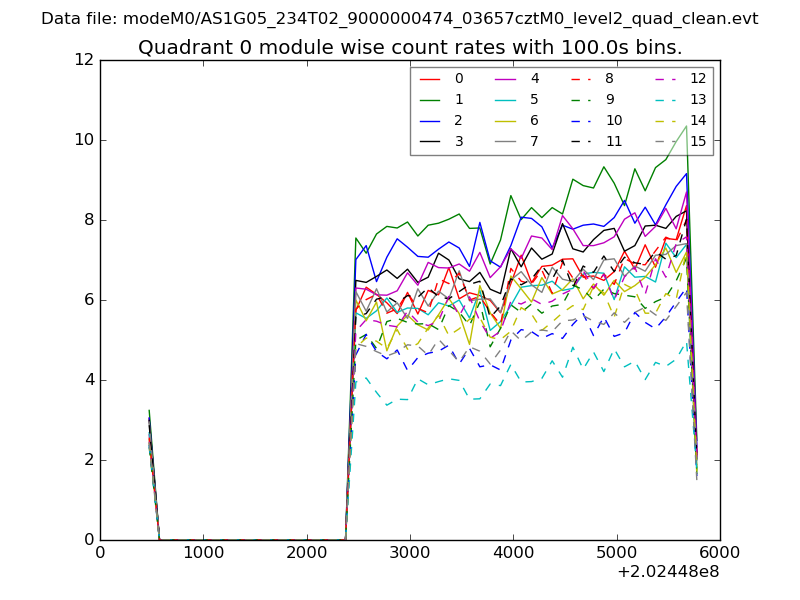 |
 |
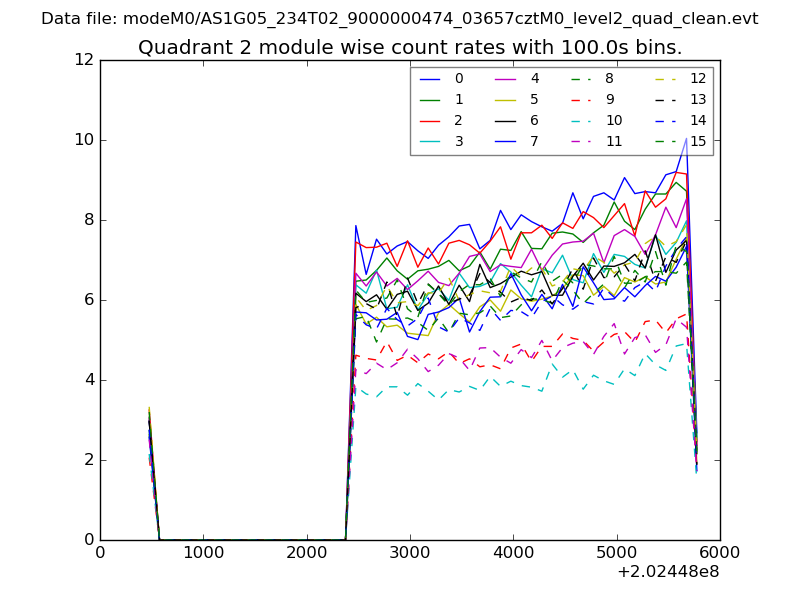
| Module-wise count rates for Quadrant B Data is divided into 100 sec bins |
 |
 |
| Module-wise count rates for Quadrant C Data is divided into 100 sec bins |
 |
 |
| Module-wise count rates for Quadrant D Data is divided into 100 sec bins |
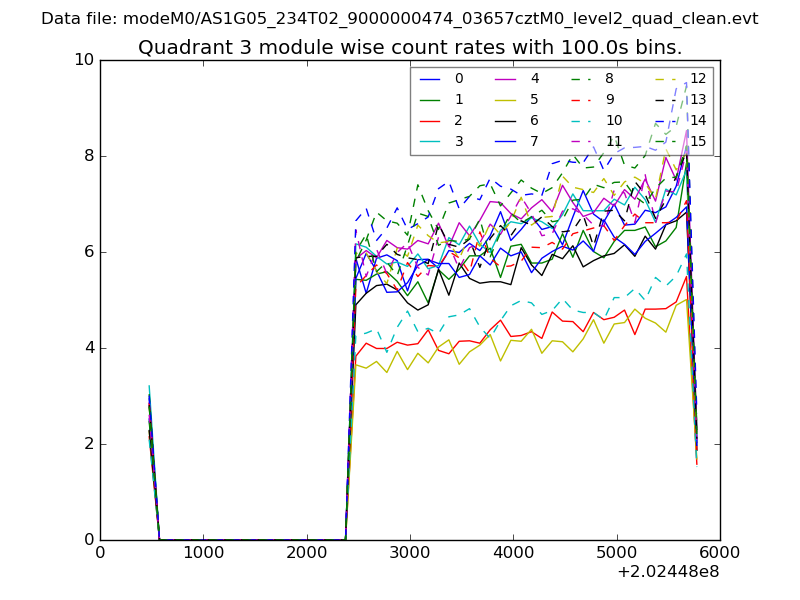 |
 |
| Parameter | Plot |
|---|---|
| CZT HV Monitor |  |
| D_VDD | 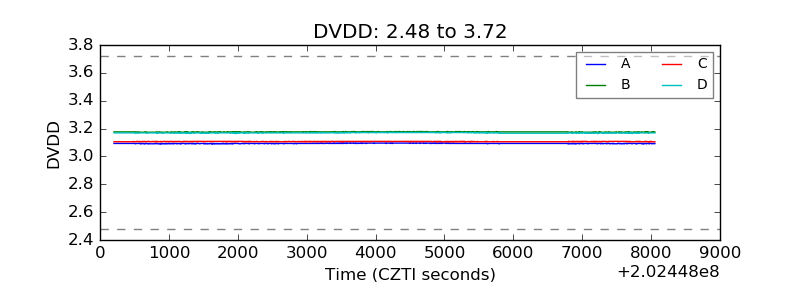 |
| Temperature 1 | 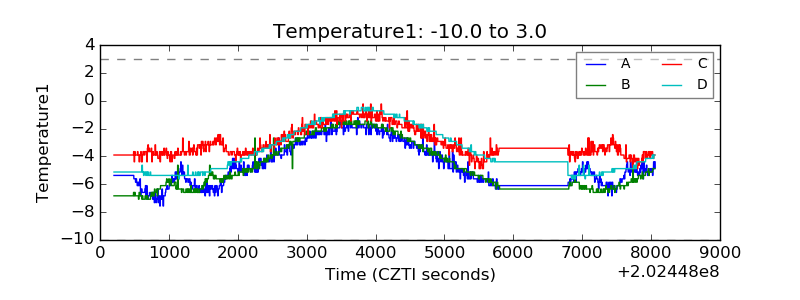 |
| Veto HV Monitor | 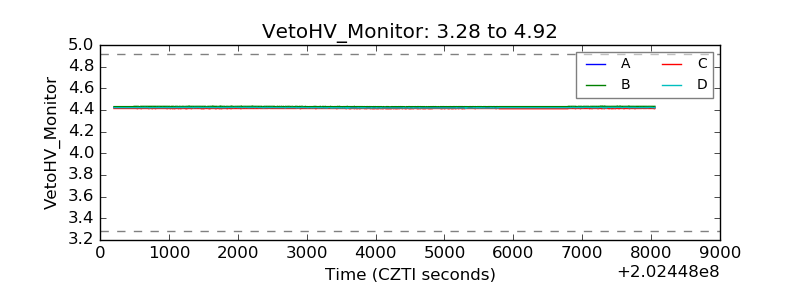 |
| Veto LLD | 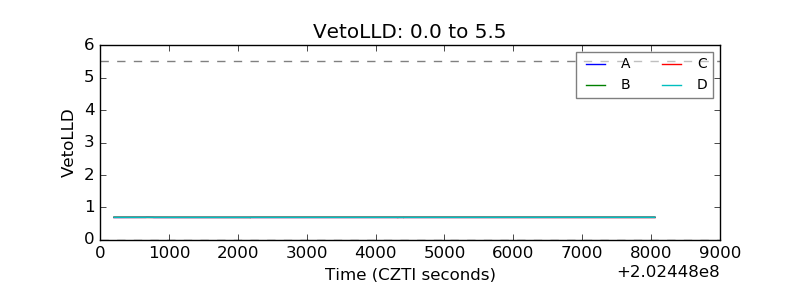 |
| Alpha Counter | 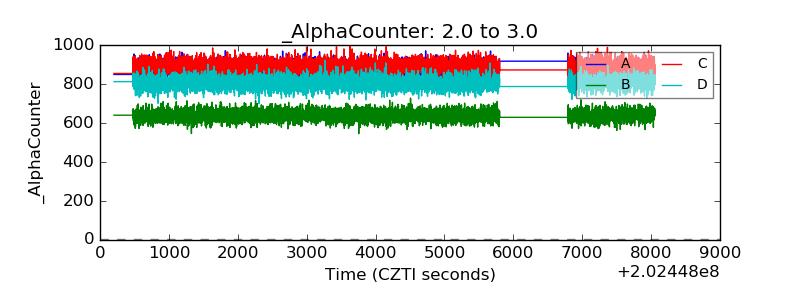 |
| _CPM_Rate | 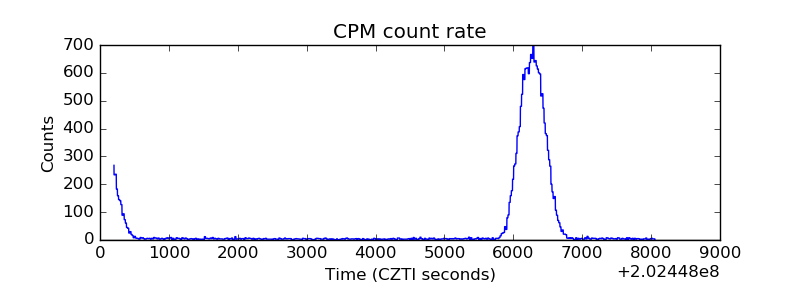 |
| CZT Counter |  |
| +2.5 Volts monitor |  |
| +5 Volts monitor |  |
| Veto Counter | 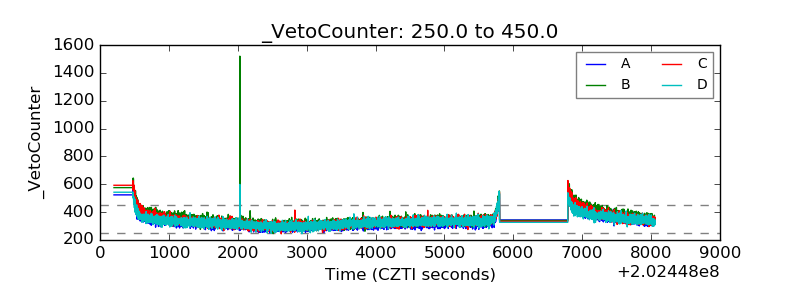 |