| Param | Original file | Final file |
|---|---|---|
| Filename | modeM0/AS1G05_234T02_9000000474_03659cztM0_level2.evt | modeM0/AS1G05_234T02_9000000474_03659cztM0_level2_quad_clean.evt |
| Size (bytes) | 210,504,960 | 30,404,160 |
| Size | 200.8 MB | 29.0 MB |
| Events in quadrant A | 1,562,659 | 173,462 |
| Events in quadrant B | 1,671,743 | 175,098 |
| Events in quadrant C | 1,417,847 | 170,604 |
| Events in quadrant D | 1,496,200 | 166,258 |
| Mode M9 | |||
|---|---|---|---|
| Quadrant | BADHDUFLAG | Total packets | Discarded packets |
| A | 0 | 6 | 0 |
| B | 0 | 6 | 0 |
| C | 0 | 6 | 0 |
| D | 0 | 7 | 0 |
| Mode SS | |||
|---|---|---|---|
| Quadrant | BADHDUFLAG | Total packets | Discarded packets |
| A | 0 | 68 | 2 |
| B | 0 | 68 | 2 |
| C | 0 | 68 | 2 |
| D | 0 | 68 | 0 |
| Mode M0 | |||
|---|---|---|---|
| Quadrant | BADHDUFLAG | Total packets | Discarded packets |
| A | 0 | 6989 | 69 |
| B | 0 | 7126 | 90 |
| C | 0 | 6753 | 65 |
| D | 0 | 7062 | 70 |
| Quadrant | Total seconds | Saturated seconds | Saturation percentage |
|---|---|---|---|
| A | 3304 | 23 | 0.696126% |
| B | 3304 | 16 | 0.484262% |
| C | 3303 | 10 | 0.302755% |
| D | 3300 | 45 | 1.363636% |
Noise dominated data is calculated using 1-second bins in cleaned event files. If a bin has >2000 counts, and if more than 50% of those come from <1% of pixels, then it is considered to be noise-dominated and hence unusable.
| Quadrant | # 1 sec bins | Bins with >0 counts | Bins with >2000 counts | High rate bins dominated by noise | Noise dominated (total time) | Noise dominated (detector-on time) | Marked lightcurve |
|---|---|---|---|---|---|---|---|
| A | 3307 | 3307 | 9 | 9 | 0.27% | 0.27% | 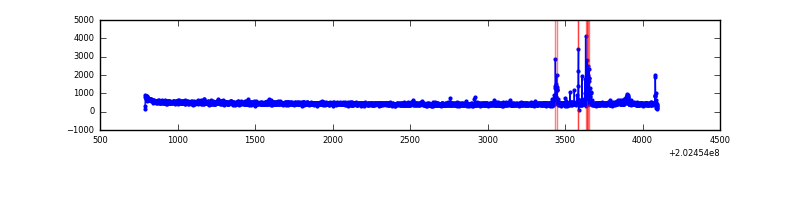 |
| B | 3318 | 3307 | 3 | 3 | 0.09% | 0.09% | 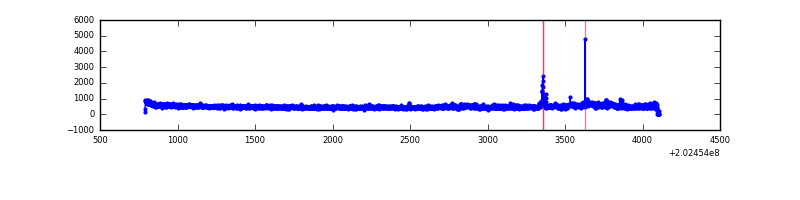 |
| C | 3312 | 3306 | 2 | 2 | 0.06% | 0.06% | 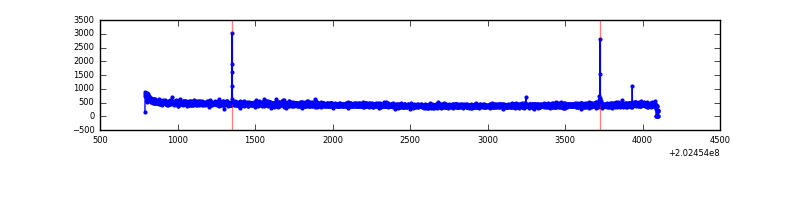 |
| D | 3302 | 3302 | 25 | 25 | 0.76% | 0.76% | 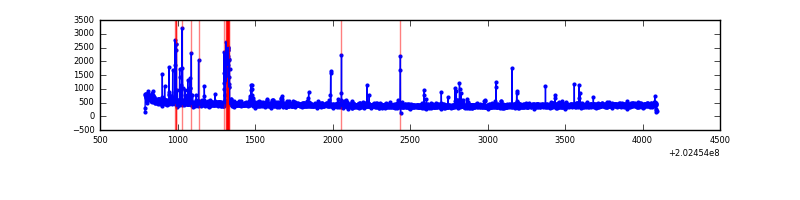 |
Top three noisy pixels from each quadrant. If the there are fewer than three noisy pixels in the level2.evt file, extra rows are filled as -1
| Pixel properties | Quadrant properties | ||||||
|---|---|---|---|---|---|---|---|
| Quadrant | DetID | PixID | Counts | Sigma | Mean | Median | Sigma |
| A | 0 | 50 | 68733 | 884.96 | 377 | 369 | 77.3 |
| A | 13 | 251 | 19176 | 243.45 | 377 | 369 | 77.3 |
| A | 13 | 14 | 8267 | 102.24 | 377 | 369 | 77.3 |
| B | 15 | 204 | 135013 | 1786.88 | 381 | 372 | 75.3 |
| B | 7 | 252 | 19284 | 250.99 | 381 | 372 | 75.3 |
| B | 15 | 54 | 9508 | 121.25 | 381 | 372 | 75.3 |
| C | 7 | 220 | 11764 | 135.36 | 358 | 358 | 84.3 |
| C | 13 | 61 | 2986 | 31.19 | 358 | 358 | 84.3 |
| C | 1 | 16 | 2081 | 20.45 | 358 | 358 | 84.3 |
| D | 13 | 239 | 102776 | 1175.67 | 356 | 346 | 87.1 |
| D | 2 | 14 | 13798 | 154.4 | 356 | 346 | 87.1 |
| D | 13 | 223 | 13424 | 150.11 | 356 | 346 | 87.1 |
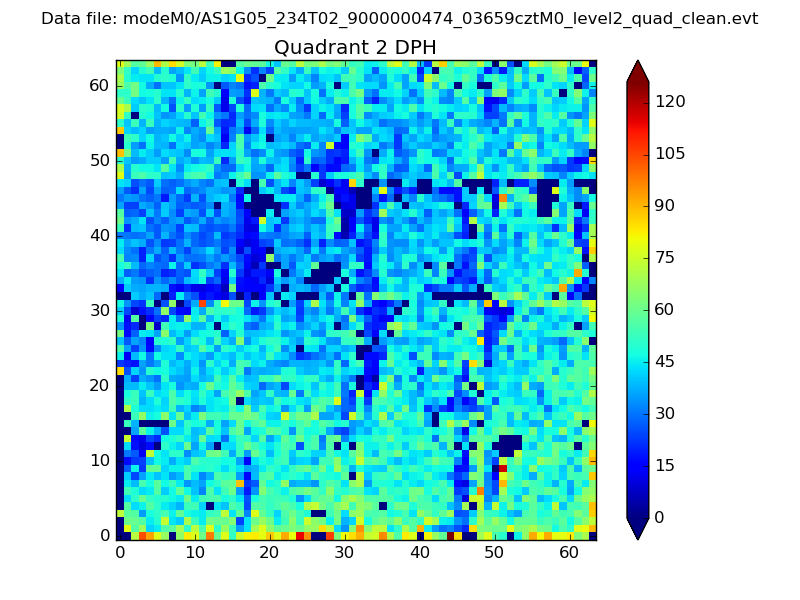
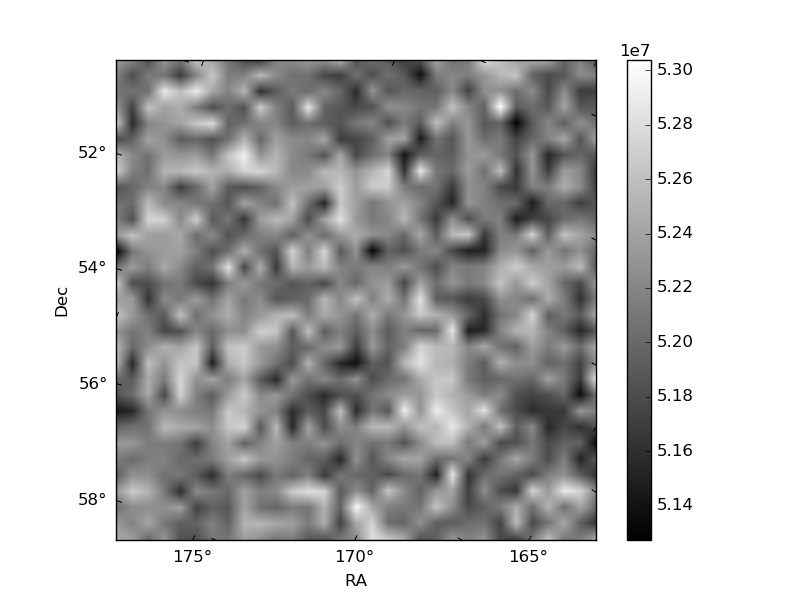
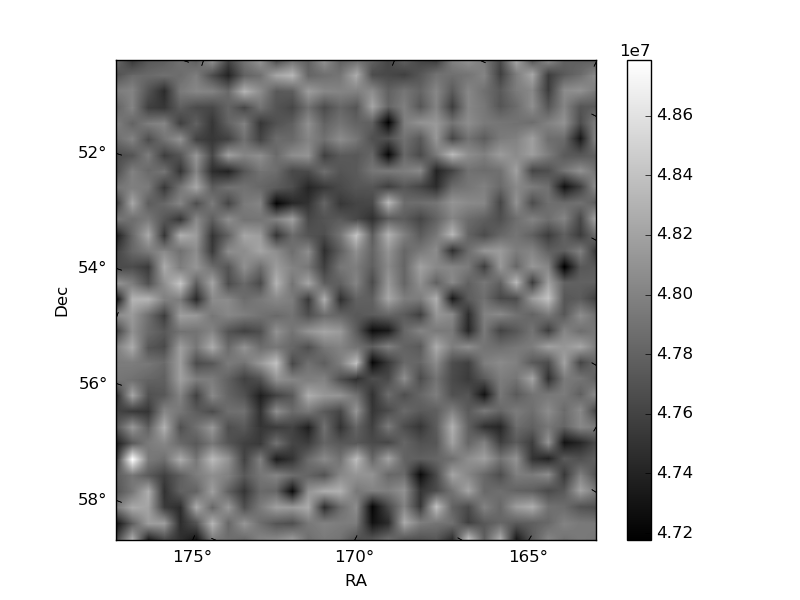
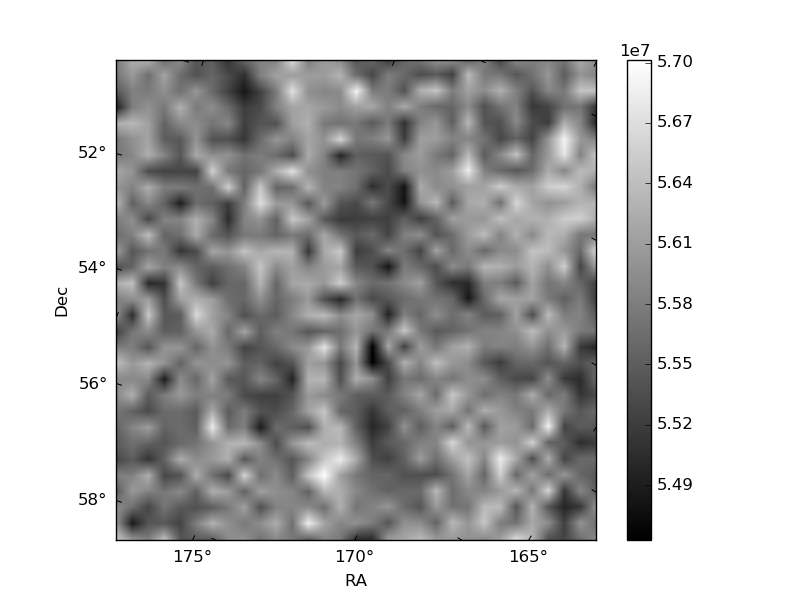
Histogram calculated using DETX and DETY for each event in the final _common_clean file
| Quadrant A | 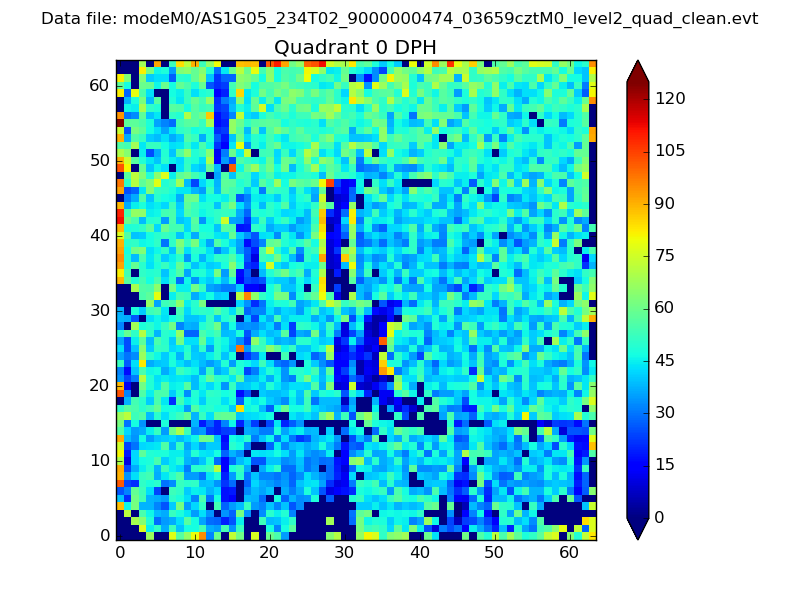 |
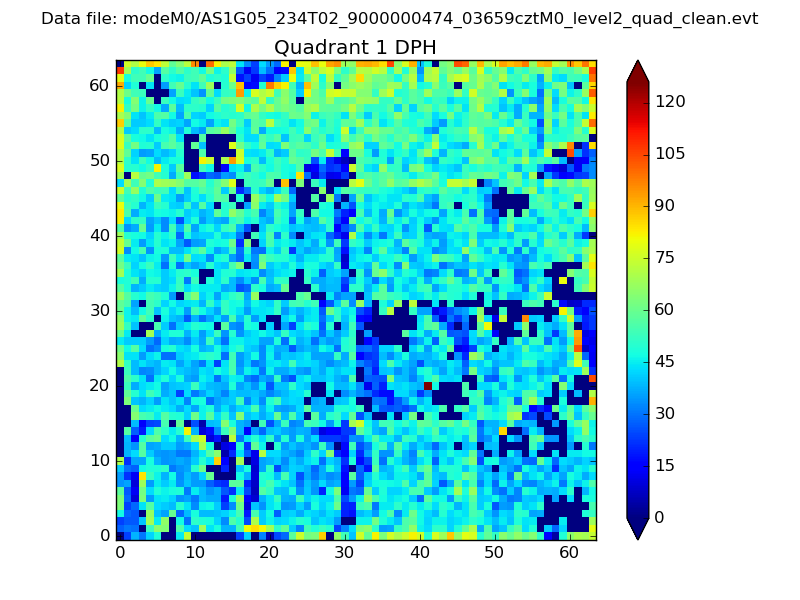 |
Quadrant B |
|---|---|---|---|
| Quadrant D | 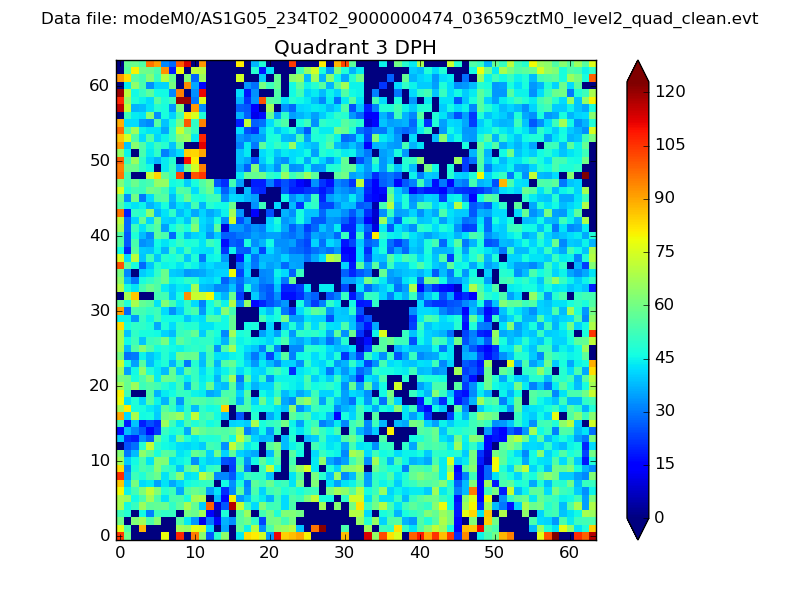 |
 |
Quadrant C |
| Plot type | Count rate plots | Images |
|---|---|---|
| Comparison with Poisson distribution Blue bars denote a histogram of data divided into 1 sec bins. Red curve is a Poisson curve with rate = median count rate of data. |
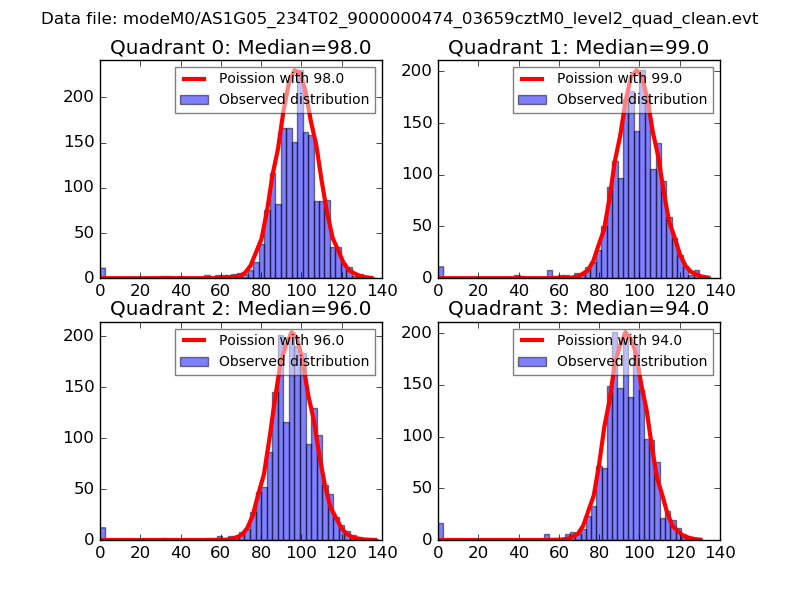 |
 |
| Quadrant-wise count rates Data is divided into 100 sec bins |
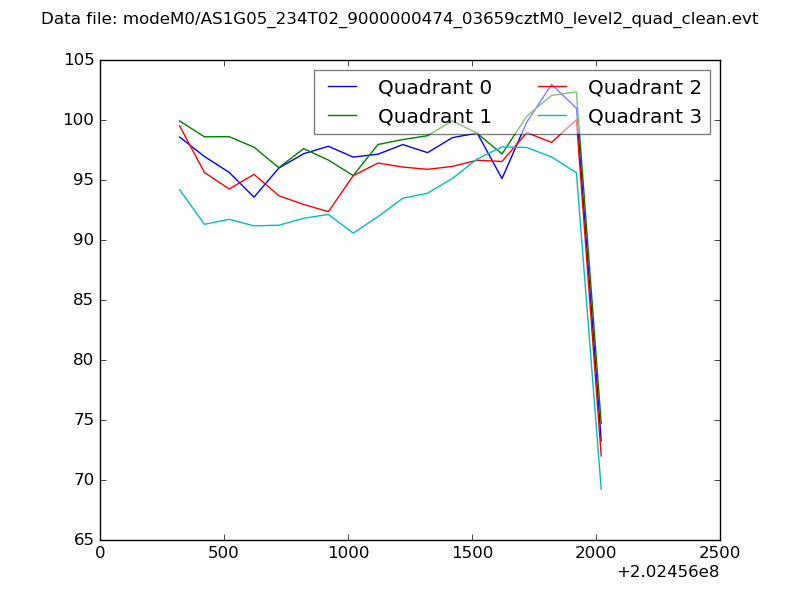 |
|
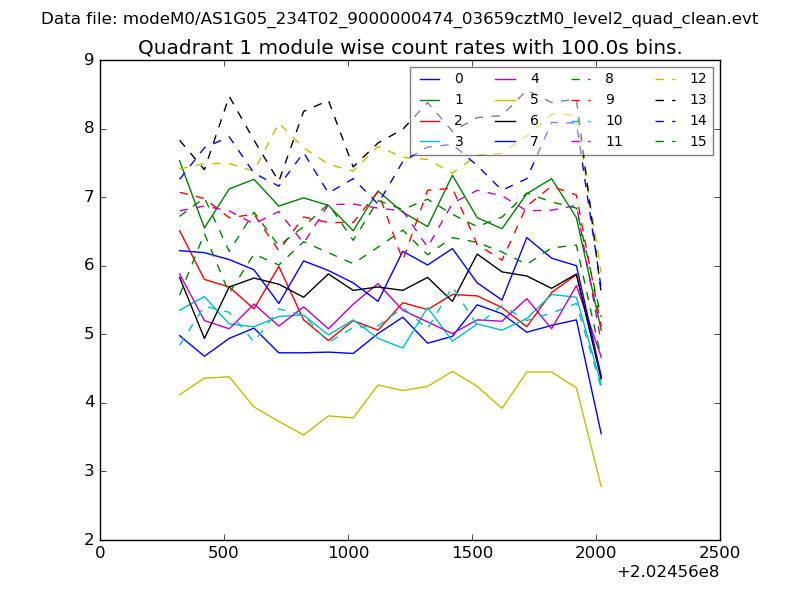
| Module-wise count rates for Quadrant A Data is divided into 100 sec bins |
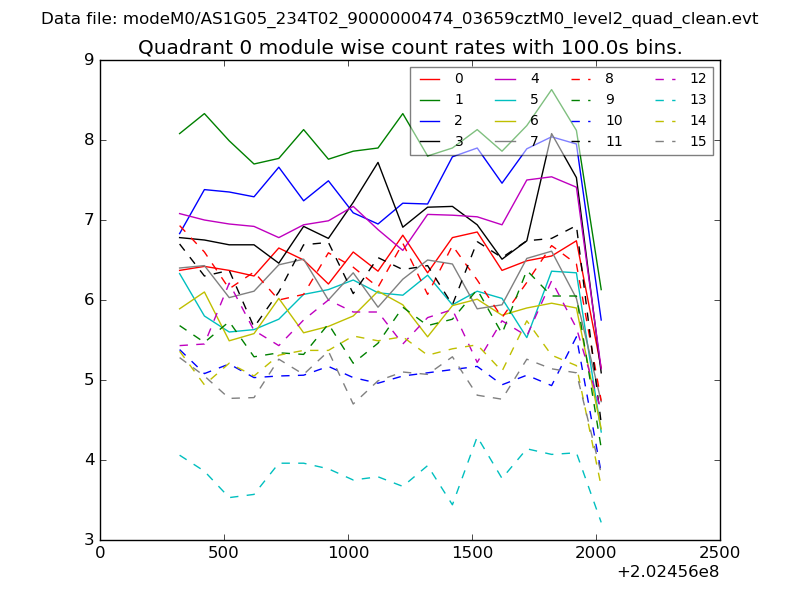 |
 |
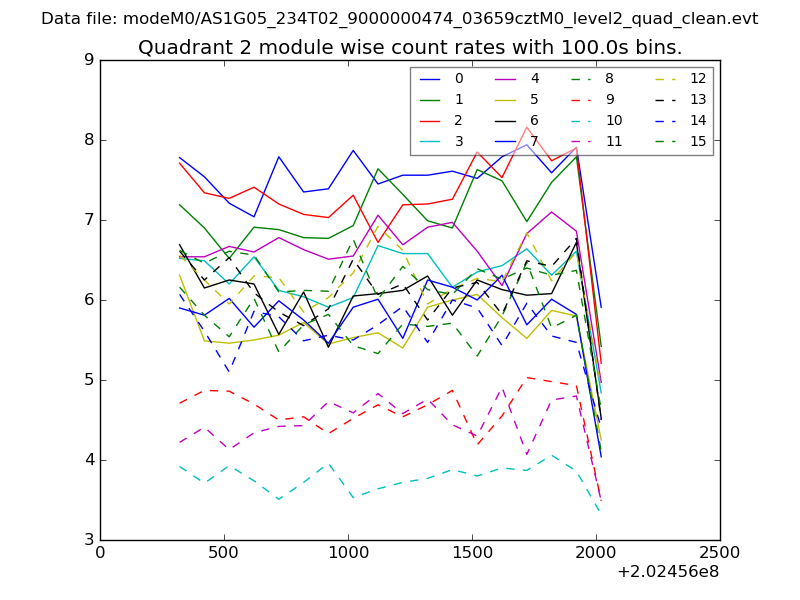
| Module-wise count rates for Quadrant B Data is divided into 100 sec bins |
 |
 |
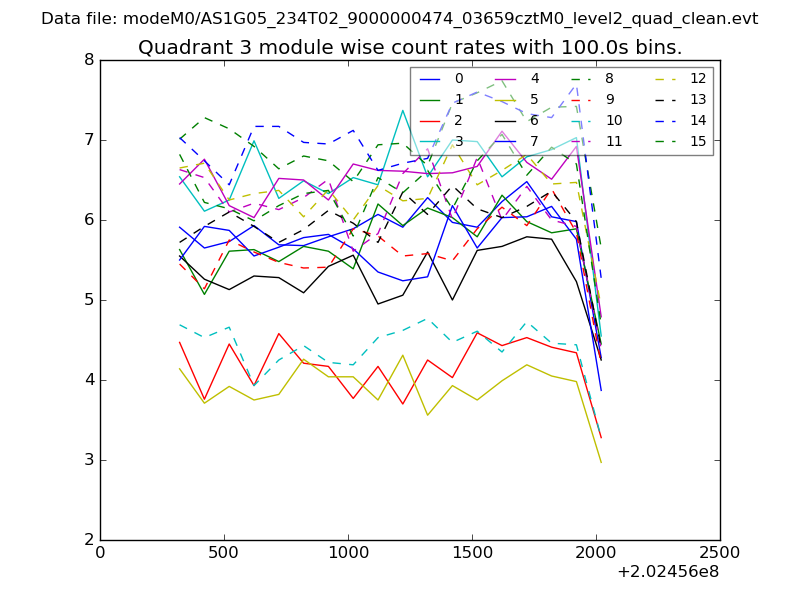
| Module-wise count rates for Quadrant C Data is divided into 100 sec bins |
 |
 |
| Module-wise count rates for Quadrant D Data is divided into 100 sec bins |
 |
 |
| Parameter | Plot |
|---|---|
| CZT HV Monitor | 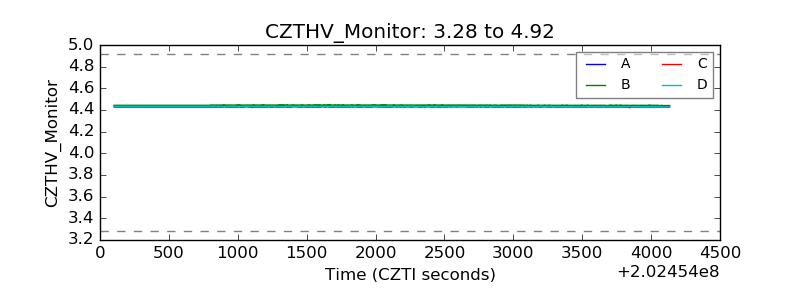 |
| D_VDD |  |
| Temperature 1 | 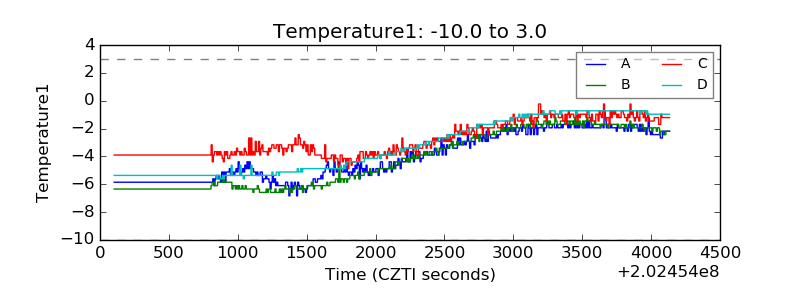 |
| Veto HV Monitor |  |
| Veto LLD | 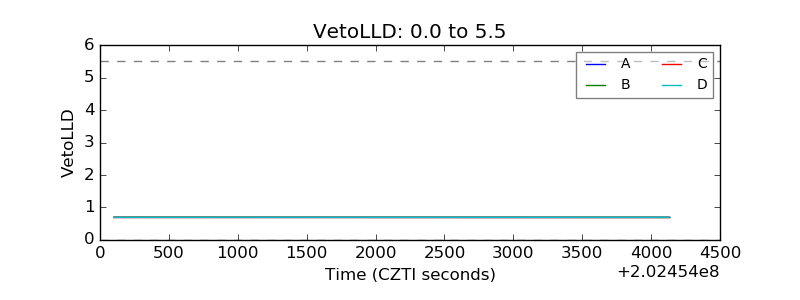 |
| Alpha Counter | 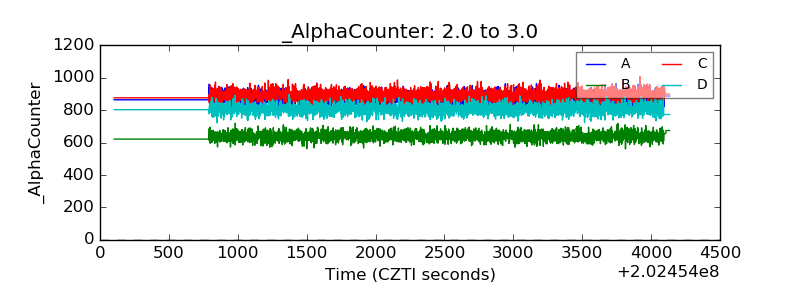 |
| _CPM_Rate | 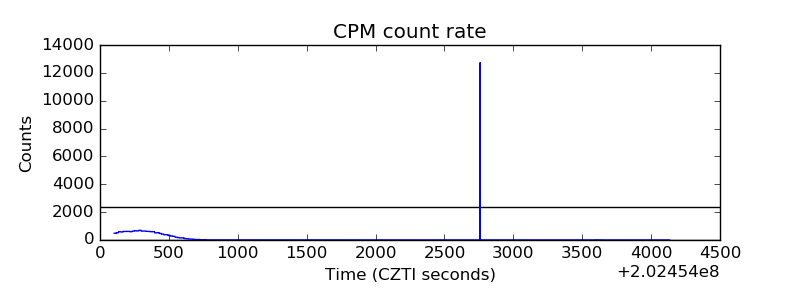 |
| CZT Counter | 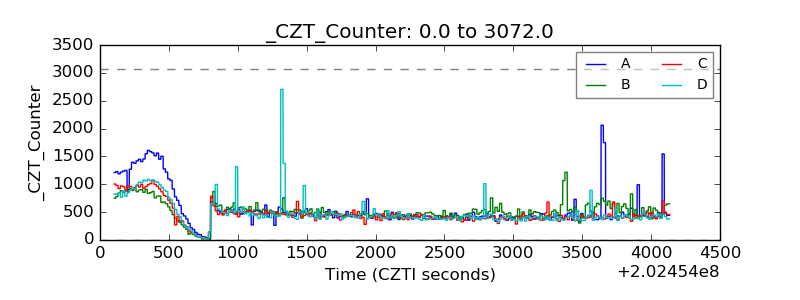 |
| +2.5 Volts monitor |  |
| +5 Volts monitor |  |
| Veto Counter | 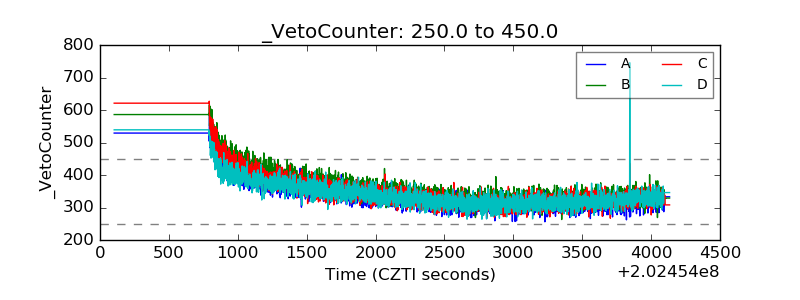 |