| Param | Original file | Final file |
|---|---|---|
| Filename | modeM0/AS1G05_234T02_9000000474_03660cztM0_level2.evt | modeM0/AS1G05_234T02_9000000474_03660cztM0_level2_quad_clean.evt |
| Size (bytes) | 444,225,600 | 77,921,280 |
| Size | 423.6 MB | 74.3 MB |
| Events in quadrant A | 3,462,591 | 485,269 |
| Events in quadrant B | 3,485,365 | 485,589 |
| Events in quadrant C | 2,952,583 | 477,613 |
| Events in quadrant D | 3,115,756 | 462,438 |
| Mode M9 | |||
|---|---|---|---|
| Quadrant | BADHDUFLAG | Total packets | Discarded packets |
| A | 0 | 12 | 0 |
| B | 0 | 12 | 0 |
| C | 0 | 12 | 0 |
| D | 0 | 12 | 0 |
| Mode SS | |||
|---|---|---|---|
| Quadrant | BADHDUFLAG | Total packets | Discarded packets |
| A | 0 | 130 | 0 |
| B | 0 | 130 | 0 |
| C | 0 | 130 | 0 |
| D | 0 | 130 | 0 |
| Mode M0 | |||
|---|---|---|---|
| Quadrant | BADHDUFLAG | Total packets | Discarded packets |
| A | 0 | 14503 | 3 |
| B | 0 | 14413 | 2 |
| C | 0 | 13173 | 2 |
| D | 0 | 13736 | 2 |
| Quadrant | Total seconds | Saturated seconds | Saturation percentage |
|---|---|---|---|
| A | 6431 | 148 | 2.301353% |
| B | 6431 | 96 | 1.492769% |
| C | 6431 | 68 | 1.057378% |
| D | 6432 | 93 | 1.445896% |
Noise dominated data is calculated using 1-second bins in cleaned event files. If a bin has >2000 counts, and if more than 50% of those come from <1% of pixels, then it is considered to be noise-dominated and hence unusable.
| Quadrant | # 1 sec bins | Bins with >0 counts | Bins with >2000 counts | High rate bins dominated by noise | Noise dominated (total time) | Noise dominated (detector-on time) | Marked lightcurve |
|---|---|---|---|---|---|---|---|
| A | 7611 | 6432 | 45 | 45 | 0.59% | 0.70% | 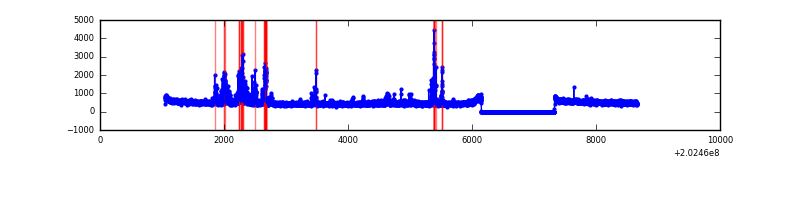 |
| B | 7611 | 6432 | 2 | 2 | 0.03% | 0.03% | 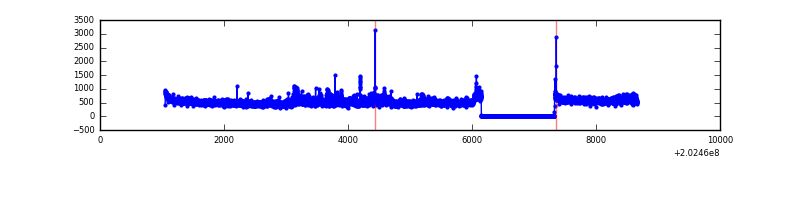 |
| C | 7611 | 6432 | 0 | 0 | 0.00% | 0.00% | 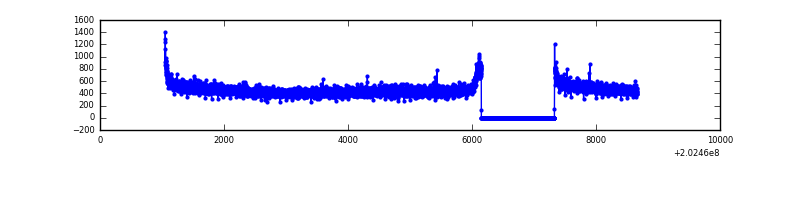 |
| D | 7612 | 6433 | 21 | 21 | 0.28% | 0.33% | 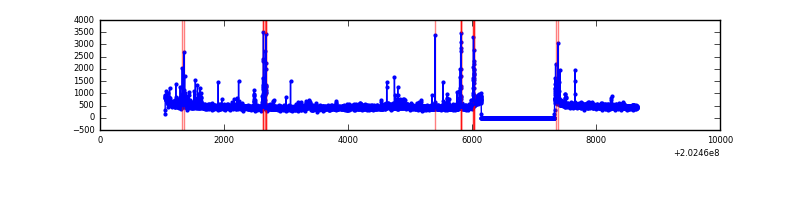 |
Top three noisy pixels from each quadrant. If the there are fewer than three noisy pixels in the level2.evt file, extra rows are filled as -1
| Pixel properties | Quadrant properties | ||||||
|---|---|---|---|---|---|---|---|
| Quadrant | DetID | PixID | Counts | Sigma | Mean | Median | Sigma |
| A | 13 | 164 | 290046 | 1796.49 | 784 | 767 | 161.0 |
| A | 0 | 50 | 78648 | 483.66 | 784 | 767 | 161.0 |
| A | 13 | 251 | 36450 | 221.6 | 784 | 767 | 161.0 |
| B | 15 | 204 | 305262 | 2009.47 | 790 | 773 | 151.5 |
| B | 4 | 81 | 34944 | 225.51 | 790 | 773 | 151.5 |
| B | 4 | 172 | 17952 | 113.37 | 790 | 773 | 151.5 |
| C | 9 | 247 | 10368 | 55.09 | 752 | 755 | 174.5 |
| C | 13 | 61 | 6458 | 32.68 | 752 | 755 | 174.5 |
| C | 12 | 4 | 3016 | 12.96 | 752 | 755 | 174.5 |
| D | 13 | 223 | 108286 | 592.98 | 756 | 736 | 181.4 |
| D | 13 | 239 | 62594 | 341.06 | 756 | 736 | 181.4 |
| D | 8 | 195 | 24170 | 129.2 | 756 | 736 | 181.4 |
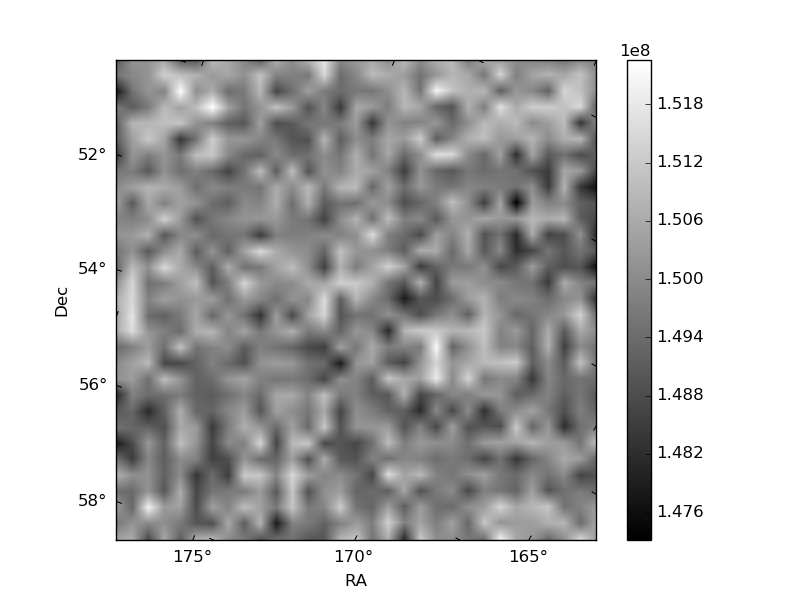
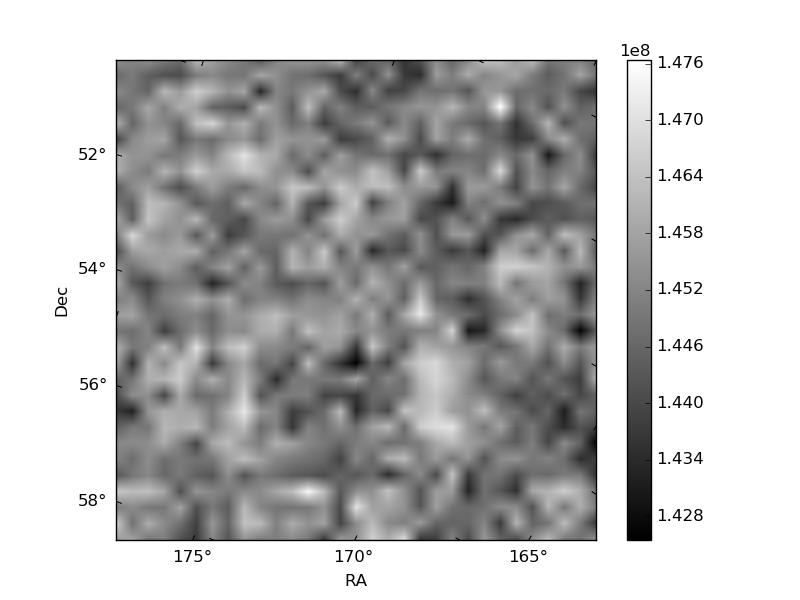
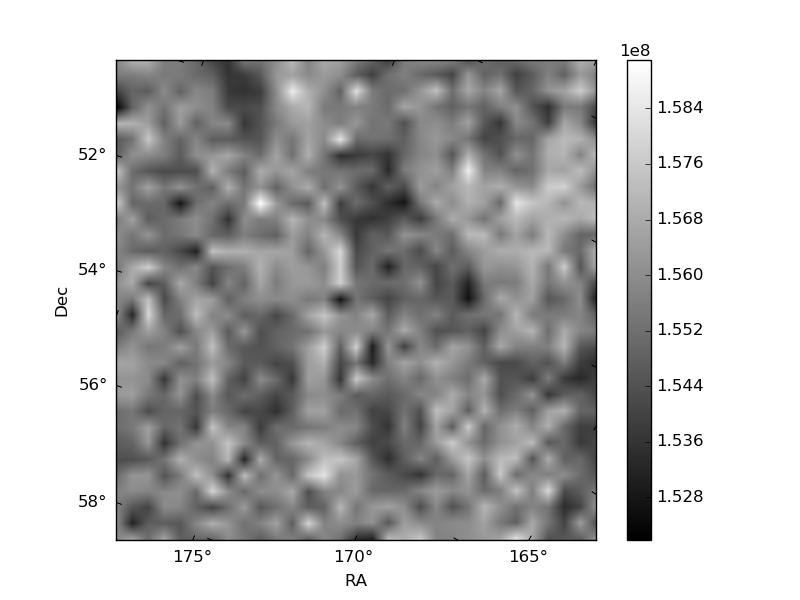
Histogram calculated using DETX and DETY for each event in the final _common_clean file
| Quadrant A | 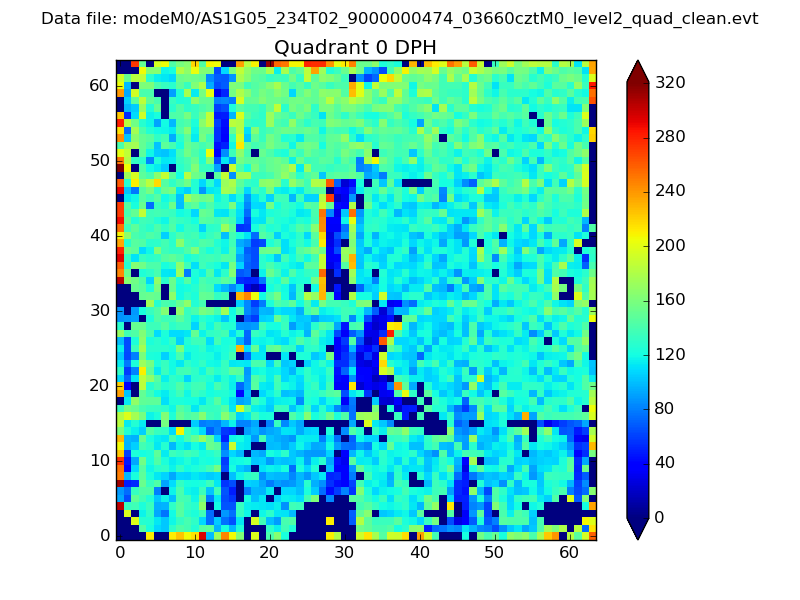 |
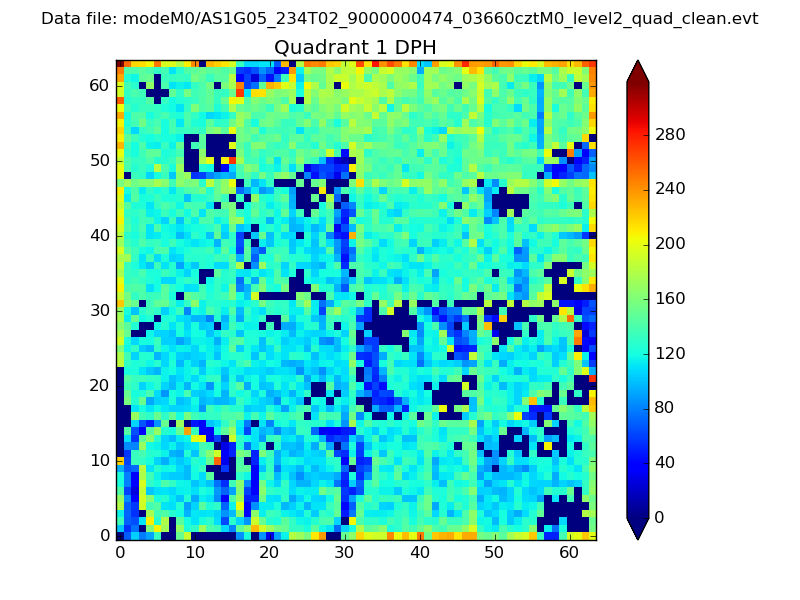 |
Quadrant B |
|---|---|---|---|
| Quadrant D | 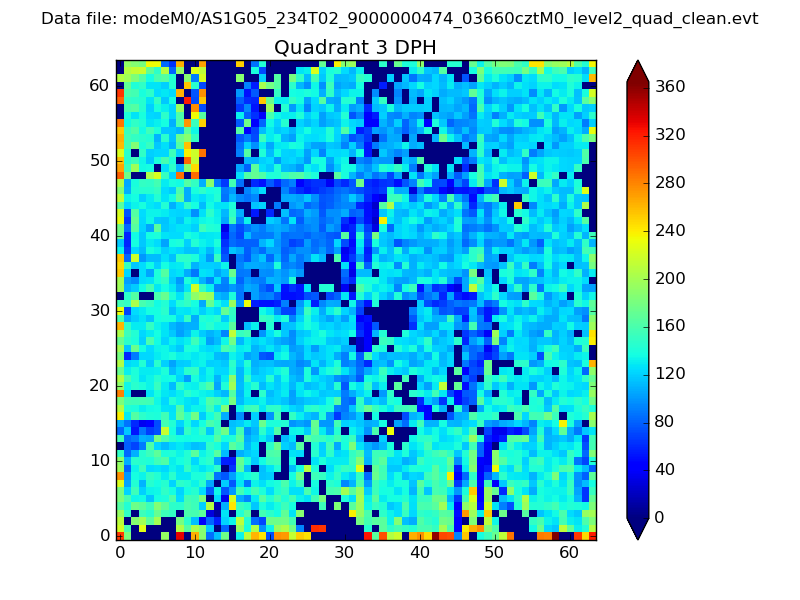 |
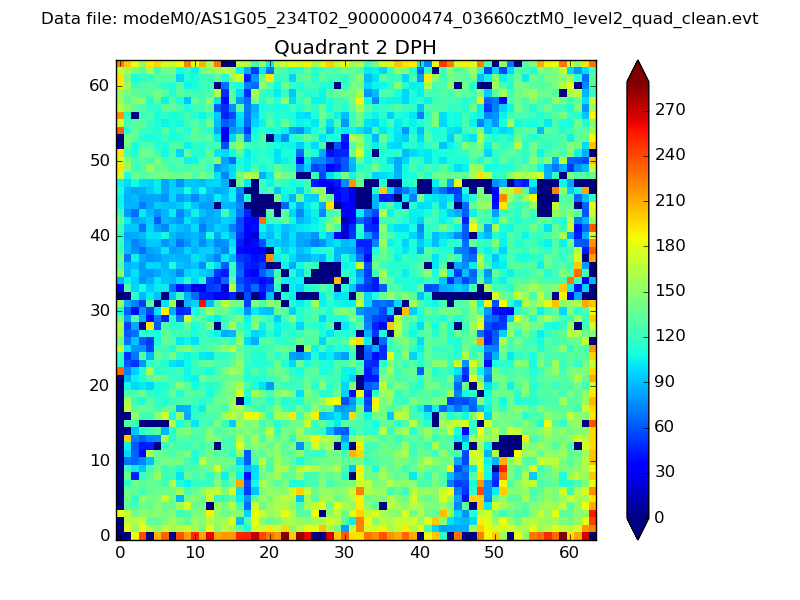 |
Quadrant C |
| Plot type | Count rate plots | Images |
|---|---|---|
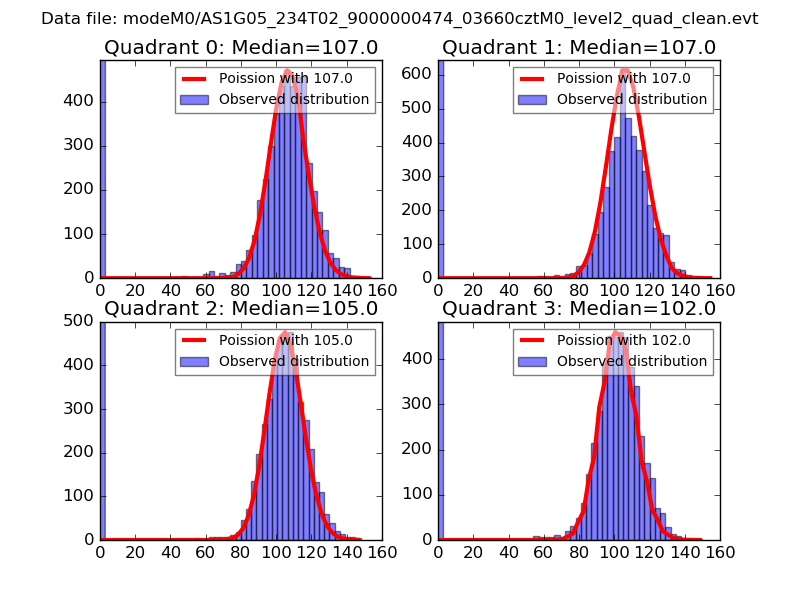
| Comparison with Poisson distribution Blue bars denote a histogram of data divided into 1 sec bins. Red curve is a Poisson curve with rate = median count rate of data. |
 |
 |
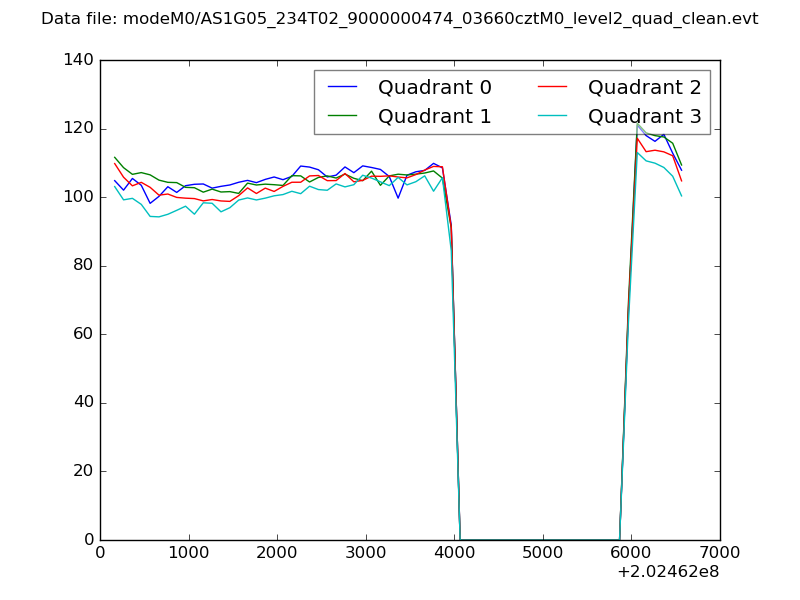
| Quadrant-wise count rates Data is divided into 100 sec bins |
 |
|
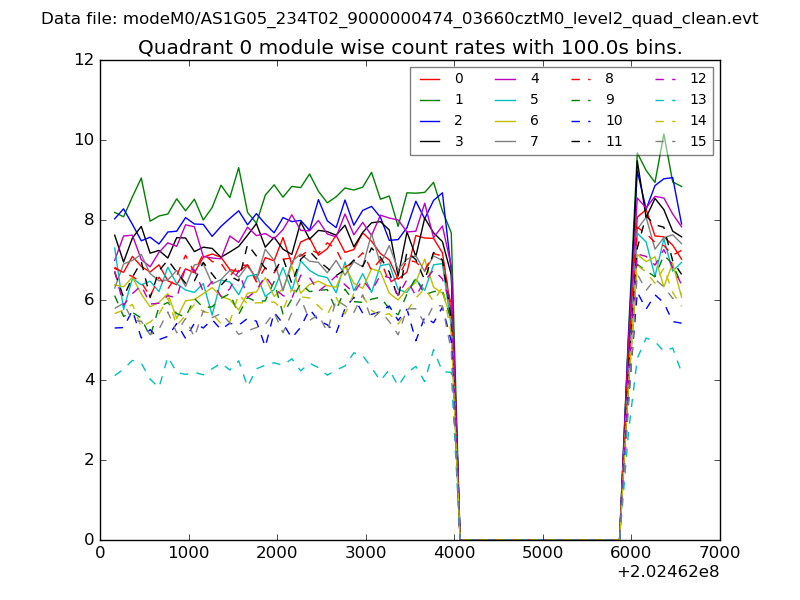
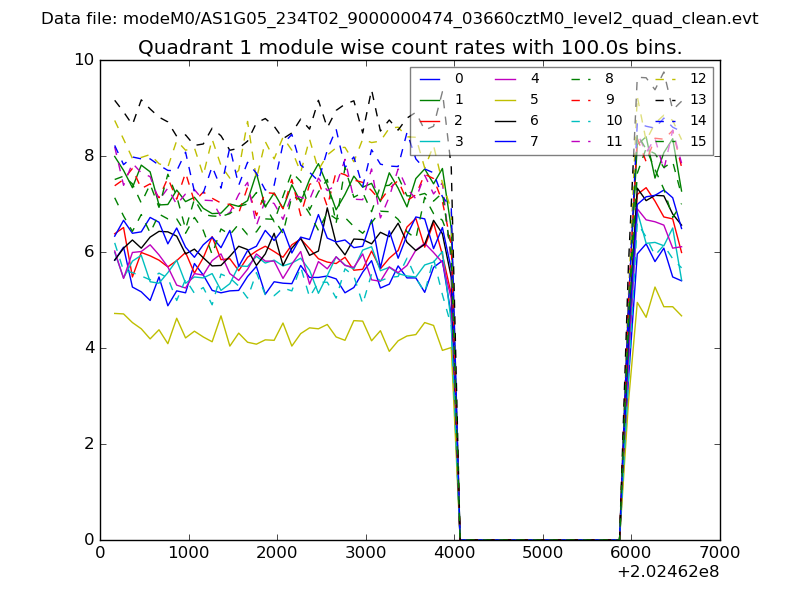
| Module-wise count rates for Quadrant A Data is divided into 100 sec bins |
 |
 |
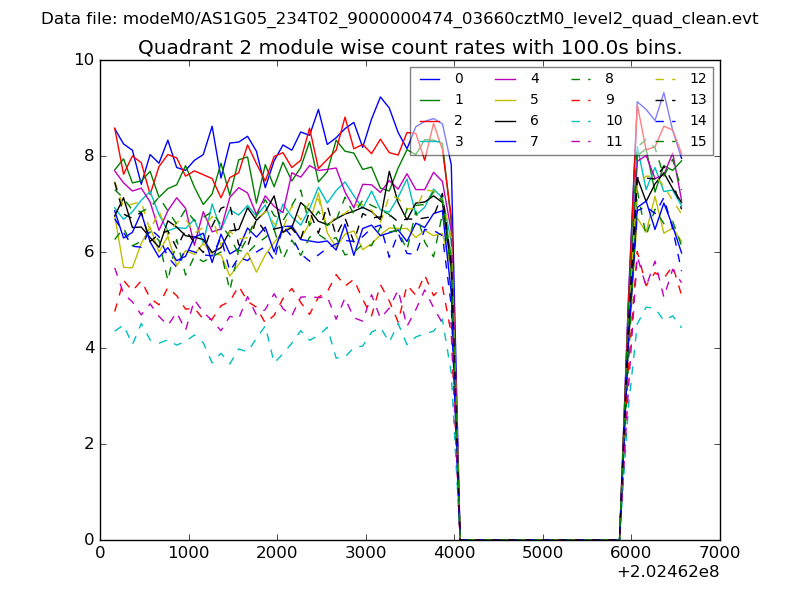
| Module-wise count rates for Quadrant B Data is divided into 100 sec bins |
 |
 |
| Module-wise count rates for Quadrant C Data is divided into 100 sec bins |
 |
 |
| Module-wise count rates for Quadrant D Data is divided into 100 sec bins |
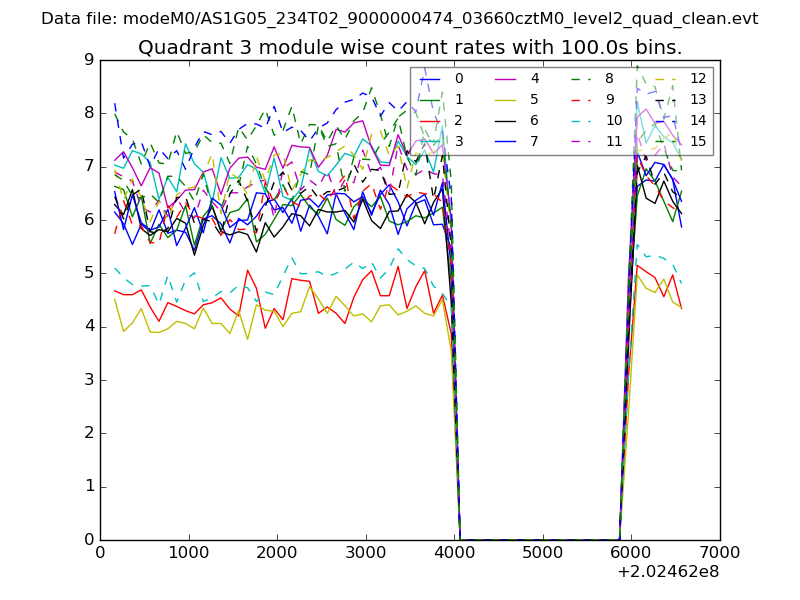 |
 |
| Parameter | Plot |
|---|---|
| CZT HV Monitor | 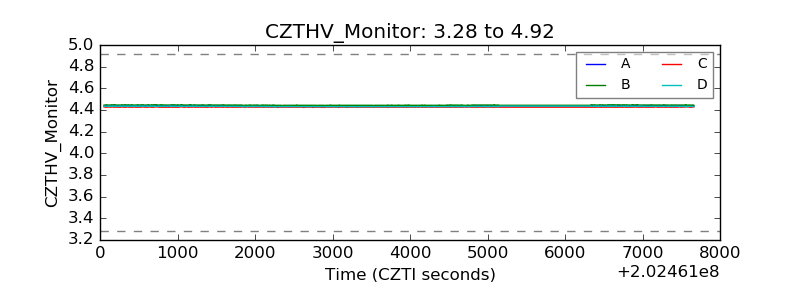 |
| D_VDD | 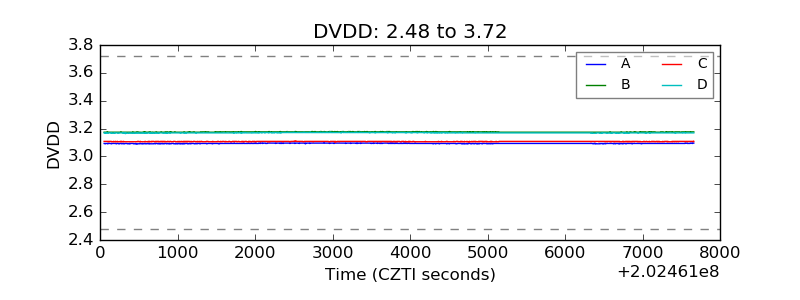 |
| Temperature 1 | 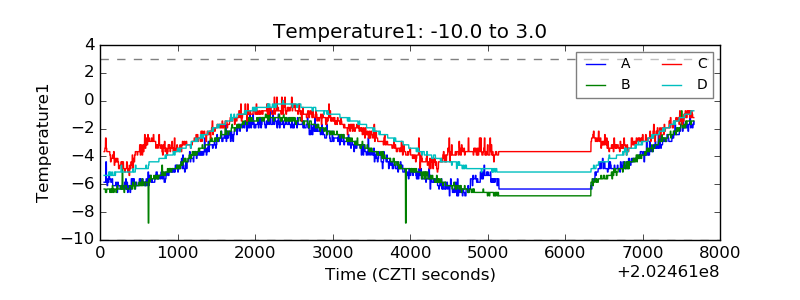 |
| Veto HV Monitor |  |
| Veto LLD | 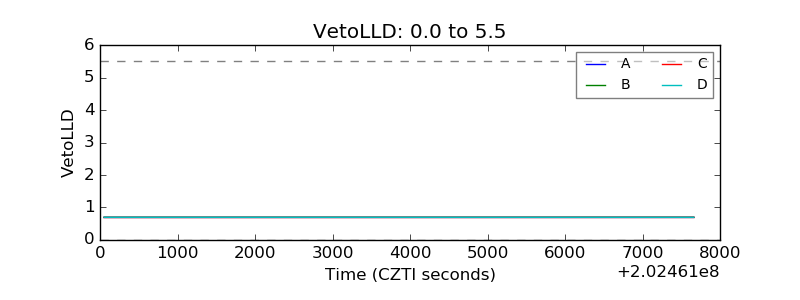 |
| Alpha Counter | 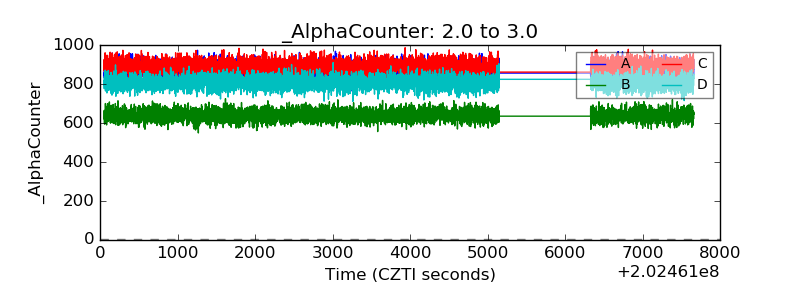 |
| _CPM_Rate | 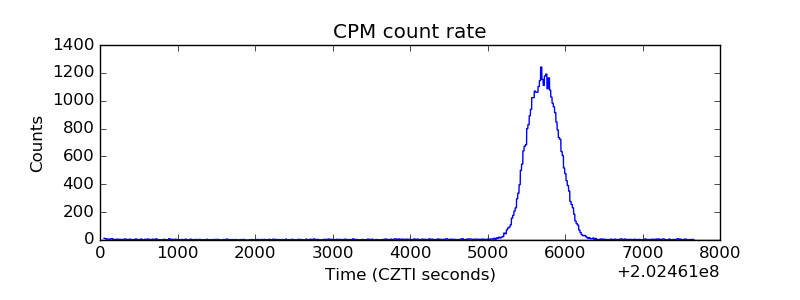 |
| CZT Counter | 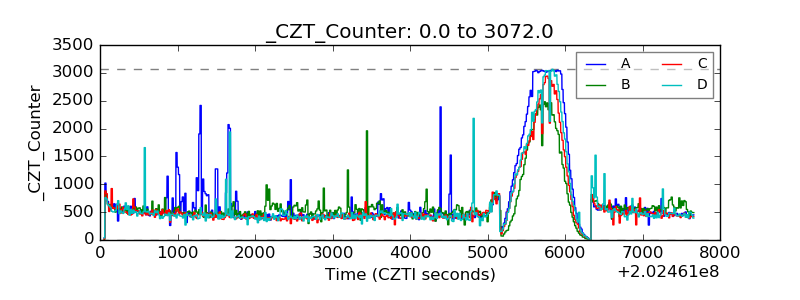 |
| +2.5 Volts monitor |  |
| +5 Volts monitor |  |
| Veto Counter | 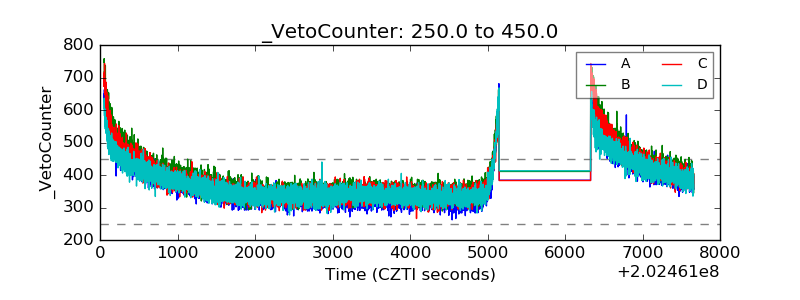 |