| Param | Original file | Final file |
|---|---|---|
| Filename | modeM0/AS1G05_234T02_9000000474_03661cztM0_level2.evt | modeM0/AS1G05_234T02_9000000474_03661cztM0_level2_quad_clean.evt |
| Size (bytes) | 950,780,160 | 185,221,440 |
| Size | 906.7 MB | 176.6 MB |
| Events in quadrant A | 7,043,196 | 1,182,029 |
| Events in quadrant B | 8,218,681 | 1,167,239 |
| Events in quadrant C | 6,182,540 | 1,161,131 |
| Events in quadrant D | 6,402,782 | 1,133,246 |
| Mode M9 | |||
|---|---|---|---|
| Quadrant | BADHDUFLAG | Total packets | Discarded packets |
| A | 0 | 23 | 0 |
| B | 0 | 23 | 0 |
| C | 0 | 23 | 0 |
| D | 0 | 23 | 0 |
| Mode SS | |||
|---|---|---|---|
| Quadrant | BADHDUFLAG | Total packets | Discarded packets |
| A | 0 | 284 | 0 |
| B | 0 | 284 | 0 |
| C | 0 | 284 | 0 |
| D | 0 | 284 | 0 |
| Mode M0 | |||
|---|---|---|---|
| Quadrant | BADHDUFLAG | Total packets | Discarded packets |
| A | 0 | 30437 | 2 |
| B | 0 | 33473 | 2 |
| C | 0 | 28405 | 2 |
| D | 0 | 29229 | 2 |
| Quadrant | Total seconds | Saturated seconds | Saturation percentage |
|---|---|---|---|
| A | 13991 | 240 | 1.715388% |
| B | 13991 | 300 | 2.144236% |
| C | 13991 | 101 | 0.721893% |
| D | 13991 | 131 | 0.936316% |
Noise dominated data is calculated using 1-second bins in cleaned event files. If a bin has >2000 counts, and if more than 50% of those come from <1% of pixels, then it is considered to be noise-dominated and hence unusable.
| Quadrant | # 1 sec bins | Bins with >0 counts | Bins with >2000 counts | High rate bins dominated by noise | Noise dominated (total time) | Noise dominated (detector-on time) | Marked lightcurve |
|---|---|---|---|---|---|---|---|
| A | 16256 | 13993 | 77 | 77 | 0.47% | 0.55% | 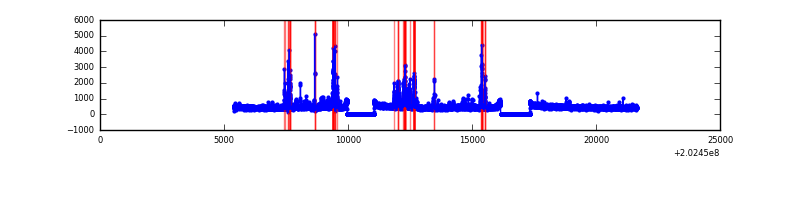 |
| B | 16256 | 13993 | 154 | 154 | 0.95% | 1.10% |  |
| C | 16256 | 13993 | 1 | 1 | 0.01% | 0.01% | 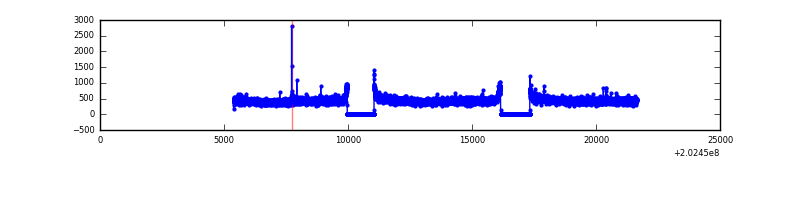 |
| D | 16256 | 13993 | 33 | 33 | 0.20% | 0.24% |  |
Top three noisy pixels from each quadrant. If the there are fewer than three noisy pixels in the level2.evt file, extra rows are filled as -1
| Pixel properties | Quadrant properties | ||||||
|---|---|---|---|---|---|---|---|
| Quadrant | DetID | PixID | Counts | Sigma | Mean | Median | Sigma |
| A | 13 | 164 | 292530 | 880.09 | 1630 | 1591 | 330.6 |
| A | 0 | 50 | 271724 | 817.15 | 1630 | 1591 | 330.6 |
| A | 13 | 251 | 135611 | 405.41 | 1630 | 1591 | 330.6 |
| B | 15 | 204 | 1099868 | 3498.36 | 1640 | 1600 | 313.9 |
| B | 14 | 167 | 434990 | 1380.5 | 1640 | 1600 | 313.9 |
| B | 0 | 182 | 90606 | 283.51 | 1640 | 1600 | 313.9 |
| C | 13 | 61 | 13345 | 32.34 | 1574 | 1578 | 363.9 |
| C | 9 | 247 | 12240 | 29.3 | 1574 | 1578 | 363.9 |
| C | 12 | 4 | 9396 | 21.49 | 1574 | 1578 | 363.9 |
| D | 13 | 223 | 121200 | 314.16 | 1583 | 1542 | 380.9 |
| D | 13 | 239 | 80720 | 207.88 | 1583 | 1542 | 380.9 |
| D | 14 | 34 | 36237 | 91.09 | 1583 | 1542 | 380.9 |
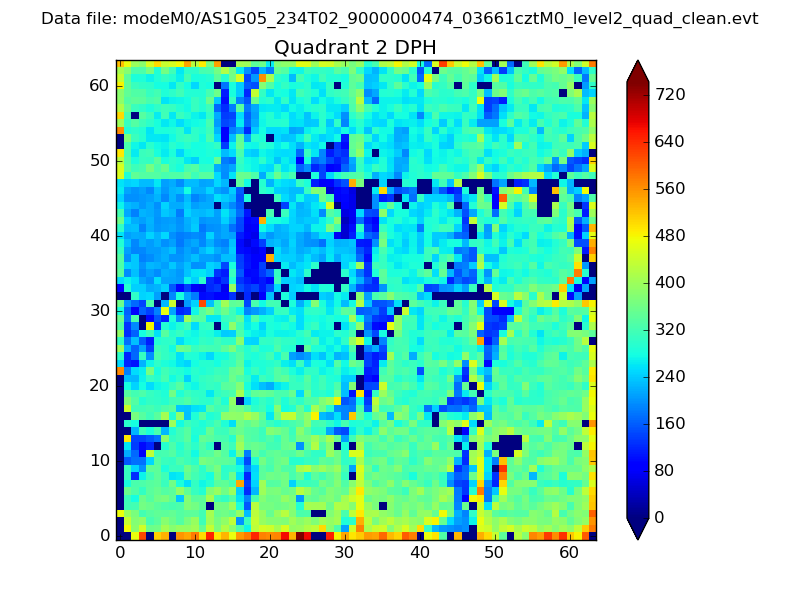
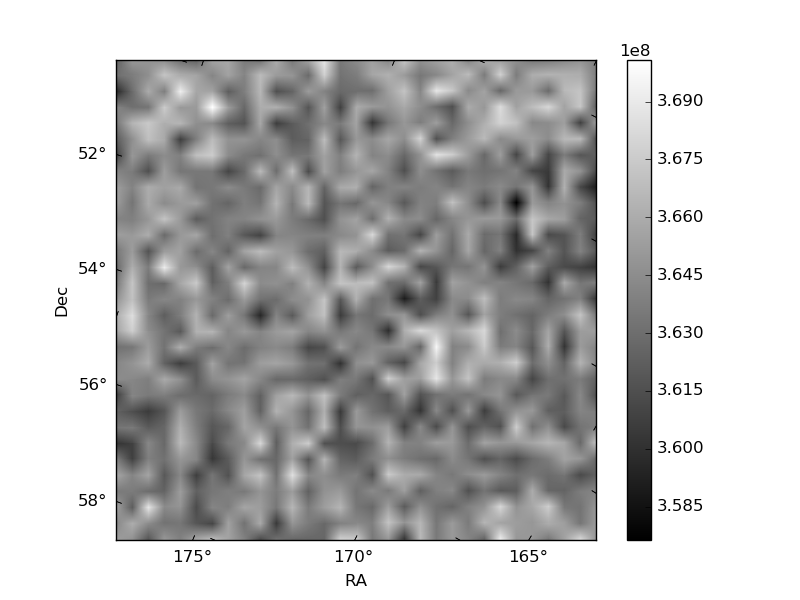
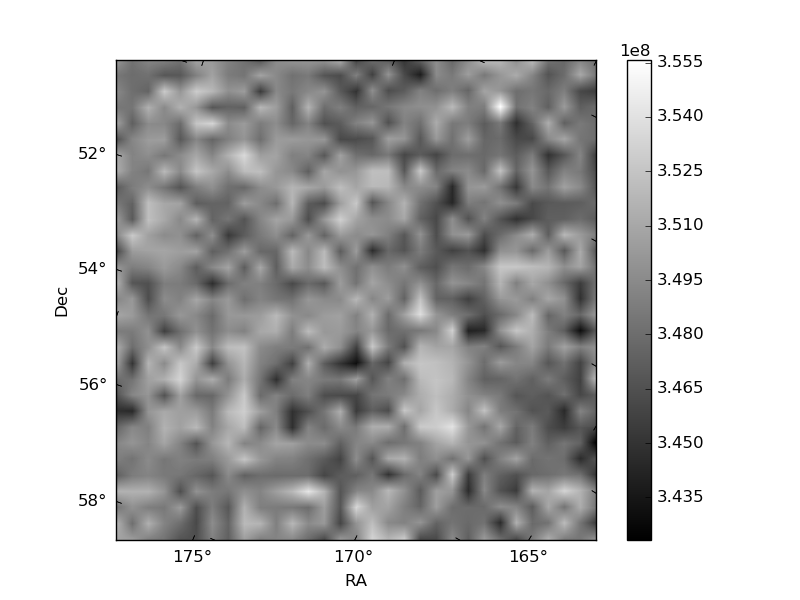
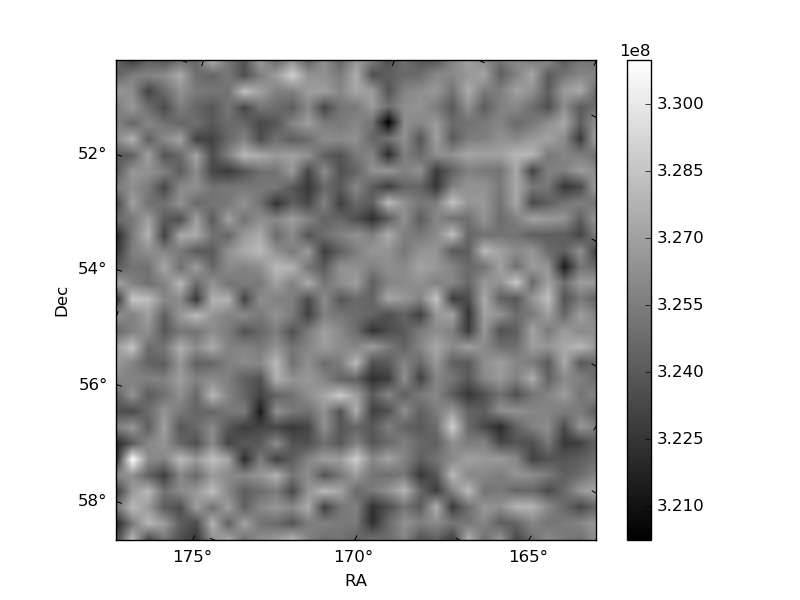
Histogram calculated using DETX and DETY for each event in the final _common_clean file
| Quadrant A | 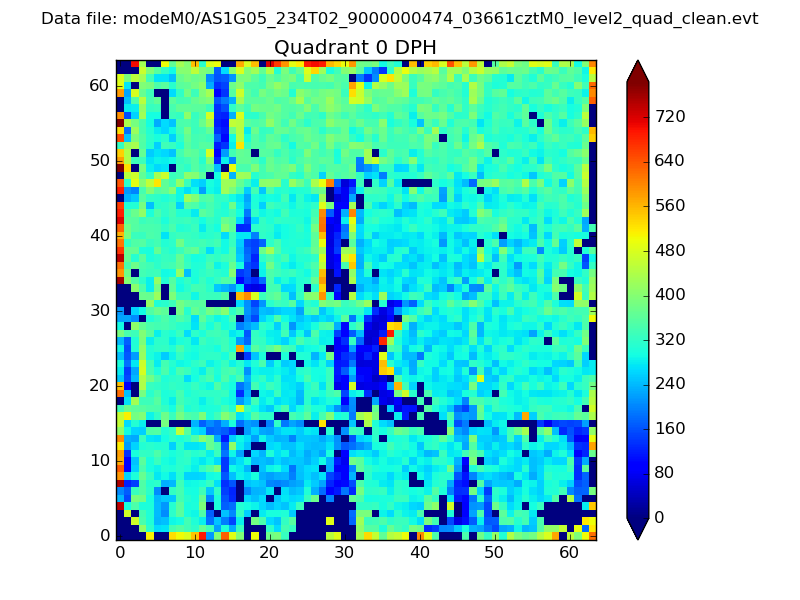 |
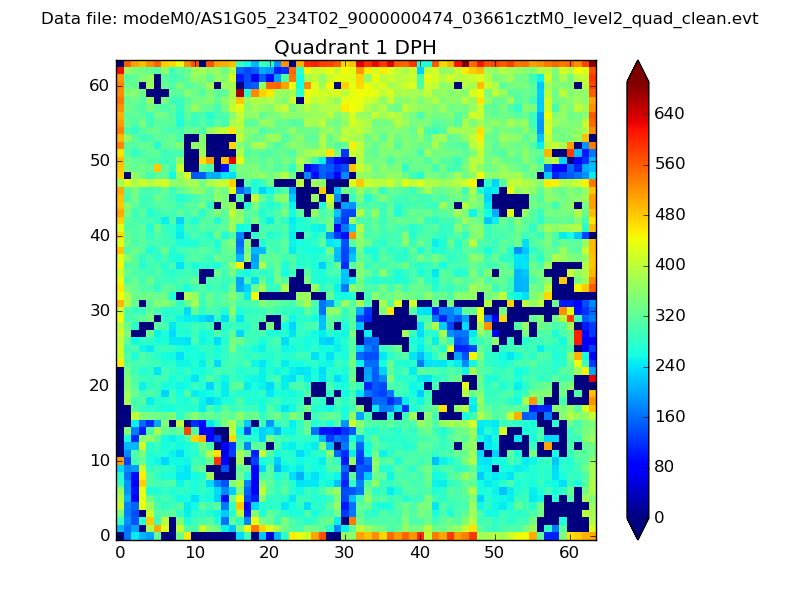 |
Quadrant B |
|---|---|---|---|
| Quadrant D | 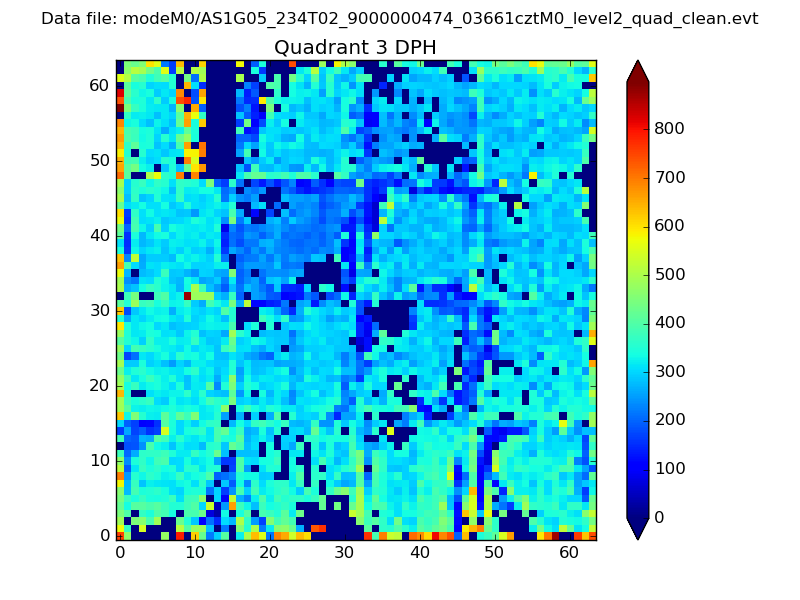 |
 |
Quadrant C |
| Plot type | Count rate plots | Images |
|---|---|---|
| Comparison with Poisson distribution Blue bars denote a histogram of data divided into 1 sec bins. Red curve is a Poisson curve with rate = median count rate of data. |
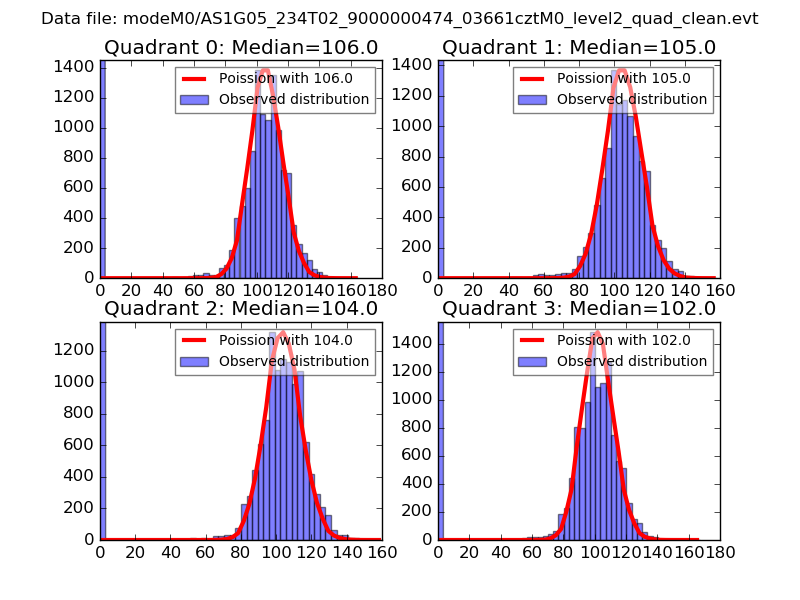 |
 |
| Quadrant-wise count rates Data is divided into 100 sec bins |
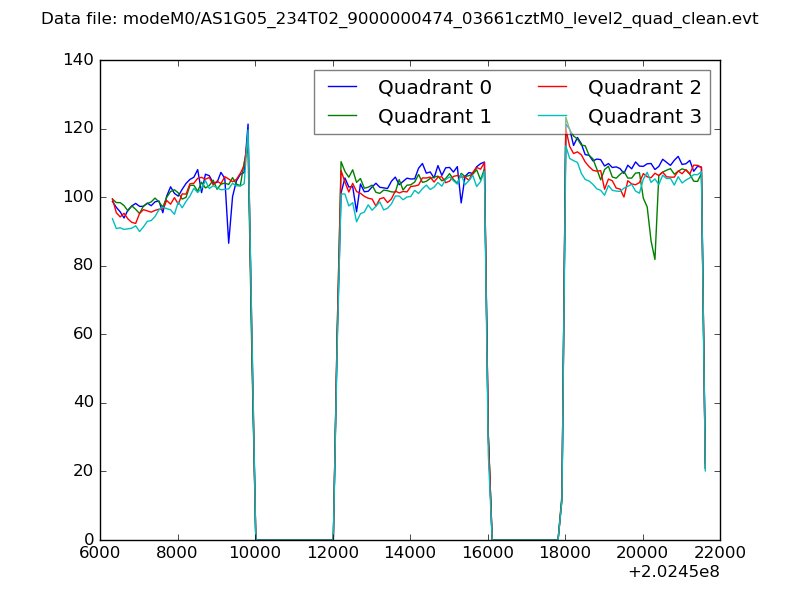 |
|
| Module-wise count rates for Quadrant A Data is divided into 100 sec bins |
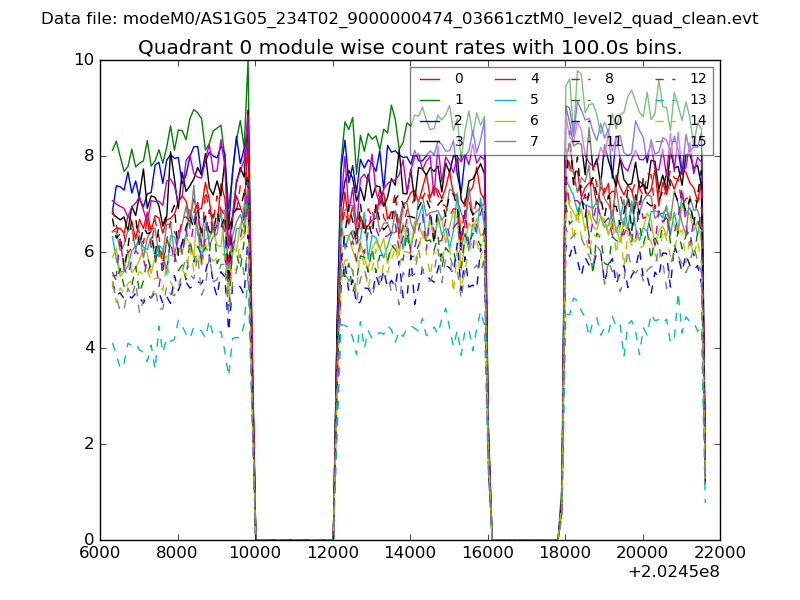 |
 |
| Module-wise count rates for Quadrant B Data is divided into 100 sec bins |
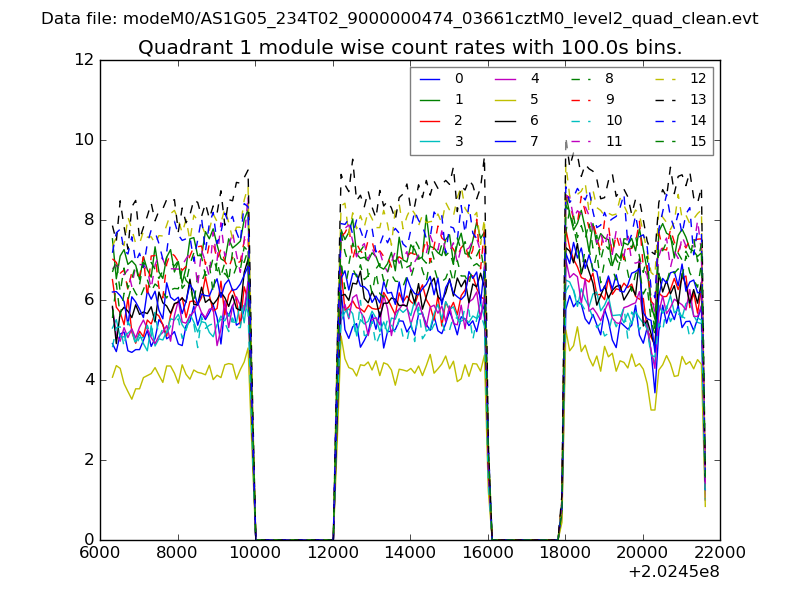 |
 |
| Module-wise count rates for Quadrant C Data is divided into 100 sec bins |
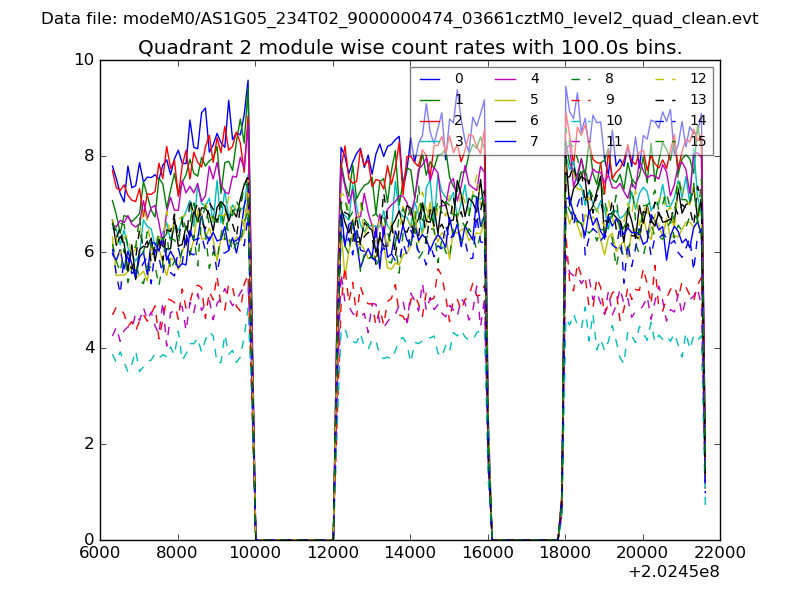 |
 |
| Module-wise count rates for Quadrant D Data is divided into 100 sec bins |
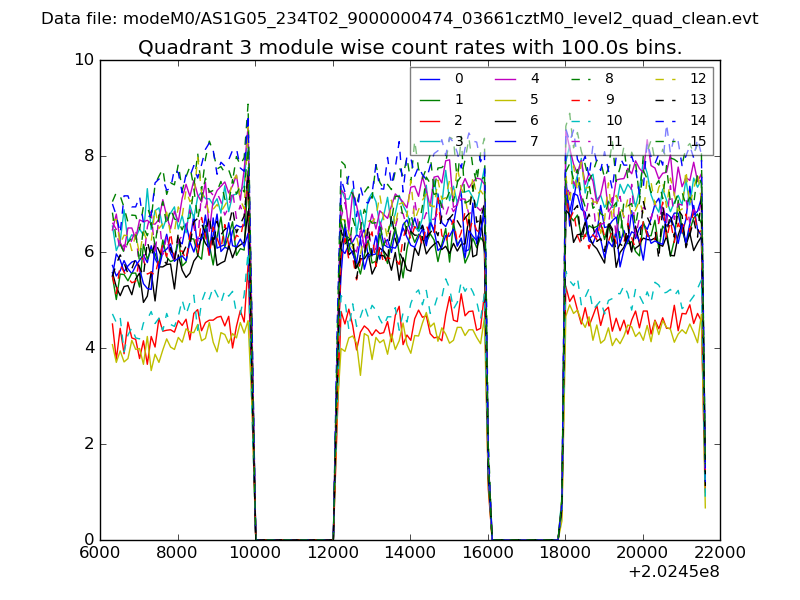 |
 |
| Parameter | Plot |
|---|---|
| CZT HV Monitor | 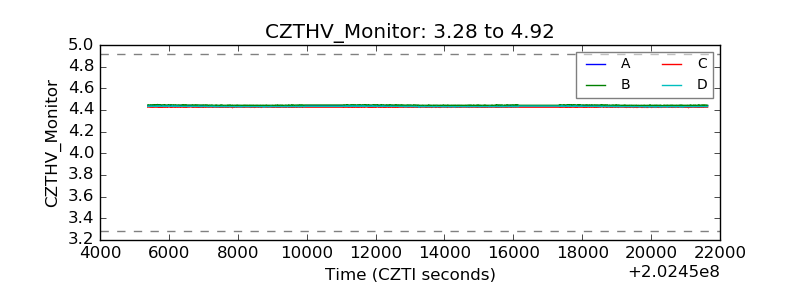 |
| D_VDD |  |
| Temperature 1 | 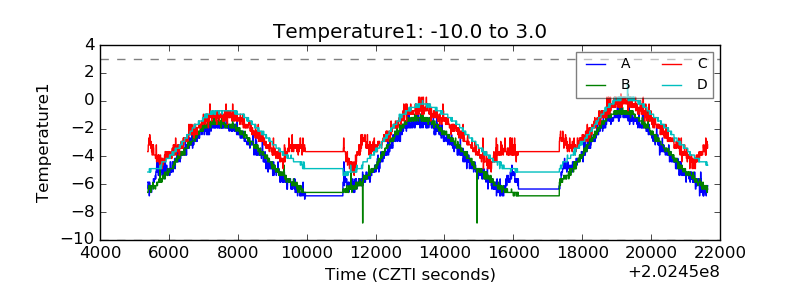 |
| Veto HV Monitor |  |
| Veto LLD | 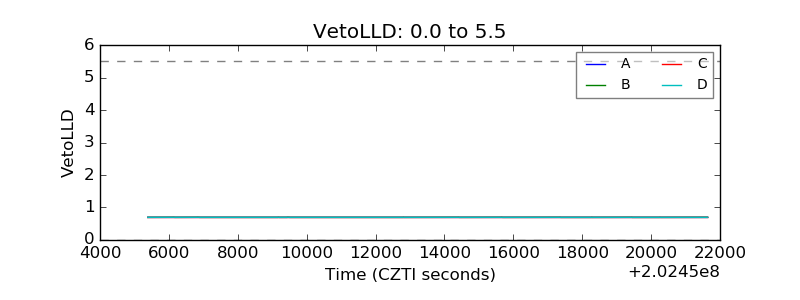 |
| Alpha Counter | 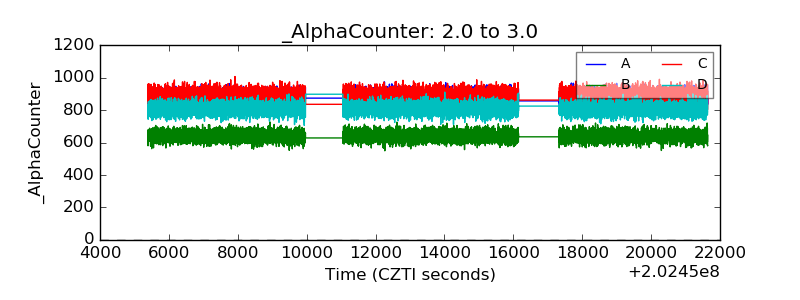 |
| _CPM_Rate | 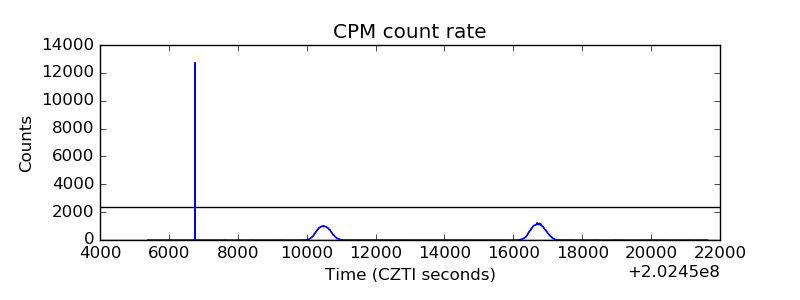 |
| CZT Counter | 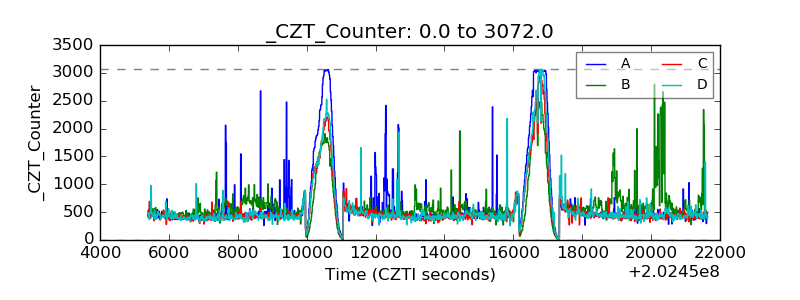 |
| +2.5 Volts monitor |  |
| +5 Volts monitor | 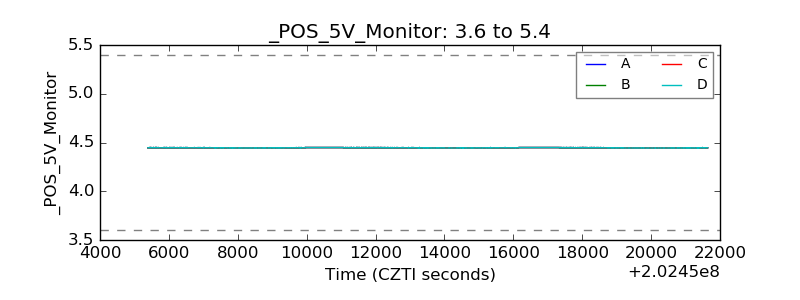 |
| Veto Counter | 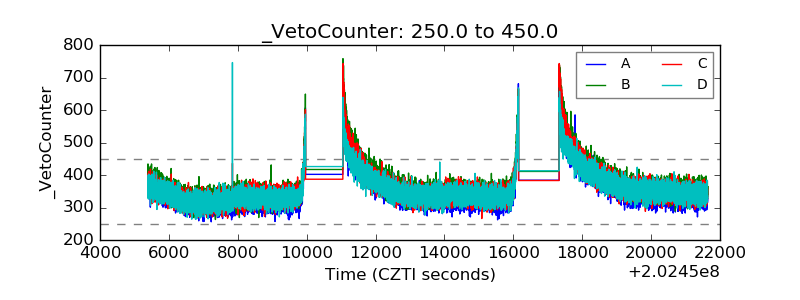 |