| Param | Original file | Final file |
|---|---|---|
| Filename | modeM0/AS1SLEW_01234_9000000473_03606cztM0_level2.evt | modeM0/AS1SLEW_01234_9000000473_03606cztM0_level2_quad_clean.evt |
| Size (bytes) | 22,896,000 | 6,491,520 |
| Size | 21.8 MB | 6.2 MB |
| Events in quadrant A | 150,190 | 40,141 |
| Events in quadrant B | 173,141 | 39,633 |
| Events in quadrant C | 160,802 | 40,245 |
| Events in quadrant D | 178,288 | 39,770 |
| Mode M0 | |||
|---|---|---|---|
| Quadrant | BADHDUFLAG | Total packets | Discarded packets |
| A | 0 | 804 | 0 |
| B | 0 | 807 | 0 |
| C | 0 | 809 | 0 |
| D | 0 | 886 | 0 |
| Mode SS | |||
|---|---|---|---|
| Quadrant | BADHDUFLAG | Total packets | Discarded packets |
| A | 0 | 8 | 0 |
| B | 0 | 8 | 0 |
| C | 0 | 8 | 0 |
| D | 0 | 8 | 0 |
| Quadrant | Total seconds | Saturated seconds | Saturation percentage |
|---|---|---|---|
| A | 402 | 0 | 0.000000% |
| B | 402 | 0 | 0.000000% |
| C | 402 | 0 | 0.000000% |
| D | 402 | 6 | 1.492537% |
Noise dominated data is calculated using 1-second bins in cleaned event files. If a bin has >2000 counts, and if more than 50% of those come from <1% of pixels, then it is considered to be noise-dominated and hence unusable.
| Quadrant | # 1 sec bins | Bins with >0 counts | Bins with >2000 counts | High rate bins dominated by noise | Noise dominated (total time) | Noise dominated (detector-on time) | Marked lightcurve |
|---|---|---|---|---|---|---|---|
| A | 402 | 402 | 0 | 0 | 0.00% | 0.00% | 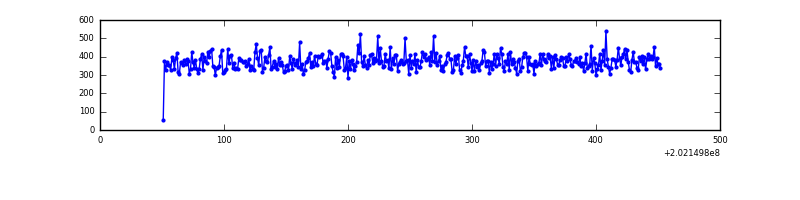 |
| B | 402 | 402 | 0 | 0 | 0.00% | 0.00% | 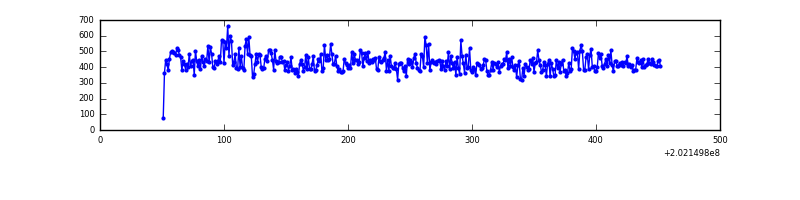 |
| C | 402 | 402 | 0 | 0 | 0.00% | 0.00% | 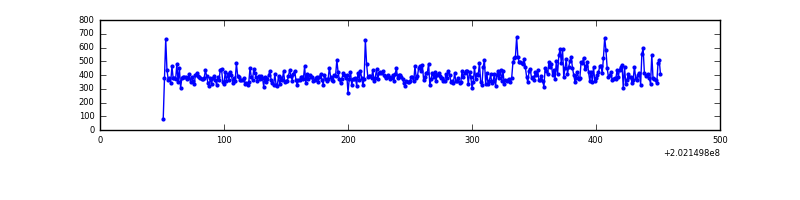 |
| D | 402 | 402 | 5 | 5 | 1.24% | 1.24% | 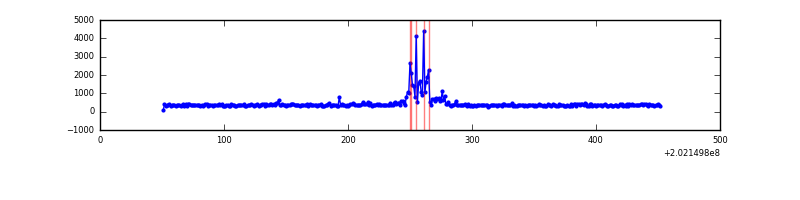 |
Top three noisy pixels from each quadrant. If the there are fewer than three noisy pixels in the level2.evt file, extra rows are filled as -1
| Pixel properties | Quadrant properties | ||||||
|---|---|---|---|---|---|---|---|
| Quadrant | DetID | PixID | Counts | Sigma | Mean | Median | Sigma |
| A | 8 | 15 | 501 | 45.7 | 38 | 37 | 10.2 |
| A | 12 | 194 | 414 | 37.13 | 38 | 37 | 10.2 |
| A | 0 | 226 | 391 | 34.86 | 38 | 37 | 10.2 |
| B | 15 | 204 | 15531 | 1604.42 | 39 | 38 | 9.7 |
| B | 4 | 81 | 1945 | 197.48 | 39 | 38 | 9.7 |
| B | 0 | 228 | 1325 | 133.28 | 39 | 38 | 9.7 |
| C | 15 | 208 | 5664 | 513.86 | 38 | 38 | 10.9 |
| C | 2 | 53 | 2520 | 226.7 | 38 | 38 | 10.9 |
| C | 13 | 61 | 301 | 24.02 | 38 | 38 | 10.9 |
| D | 13 | 223 | 30458 | 2807.33 | 37 | 36 | 10.8 |
| D | 13 | 46 | 3047 | 277.85 | 37 | 36 | 10.8 |
| D | 2 | 14 | 1533 | 138.14 | 37 | 36 | 10.8 |
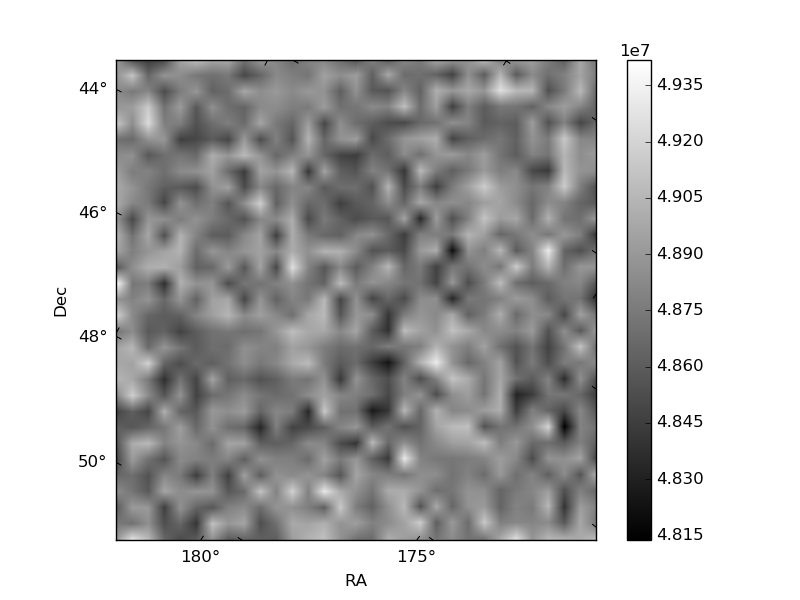
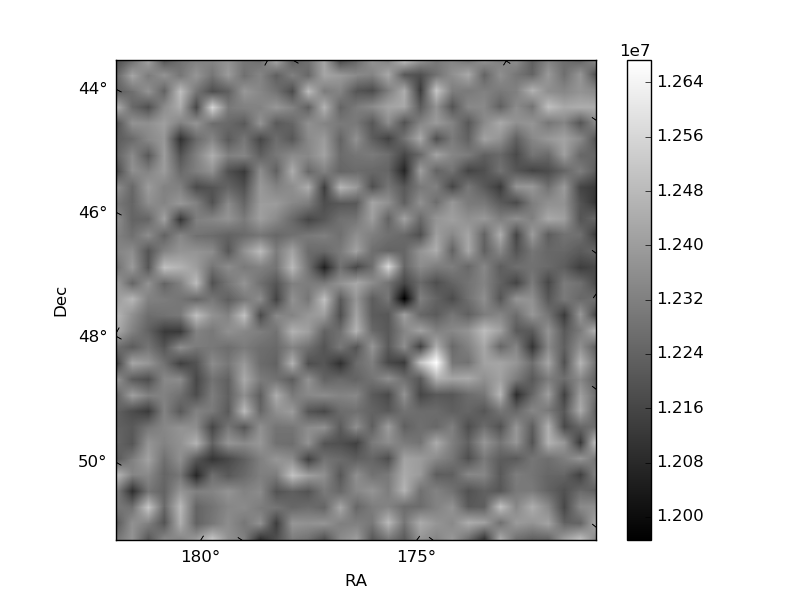
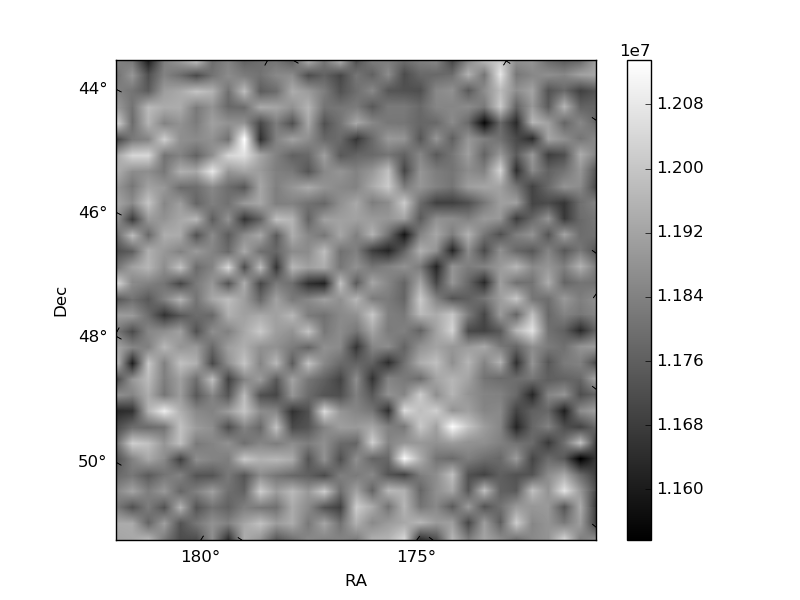
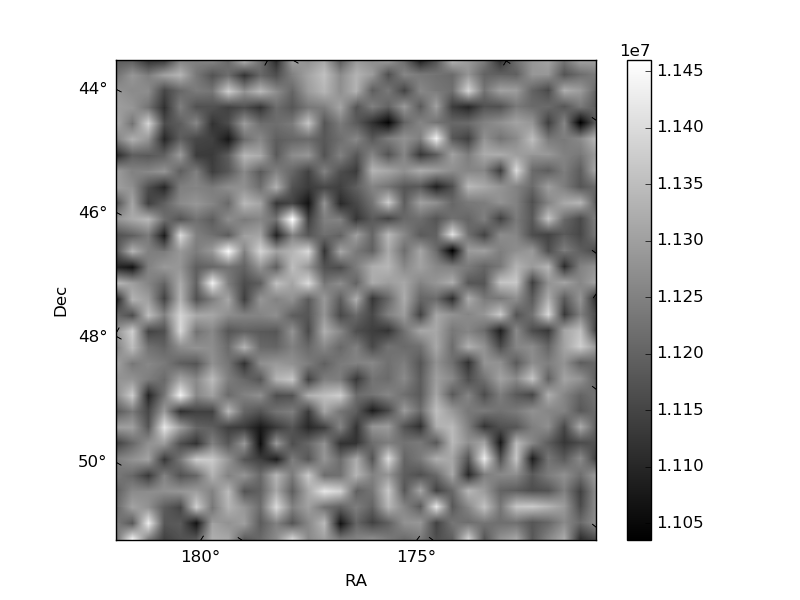
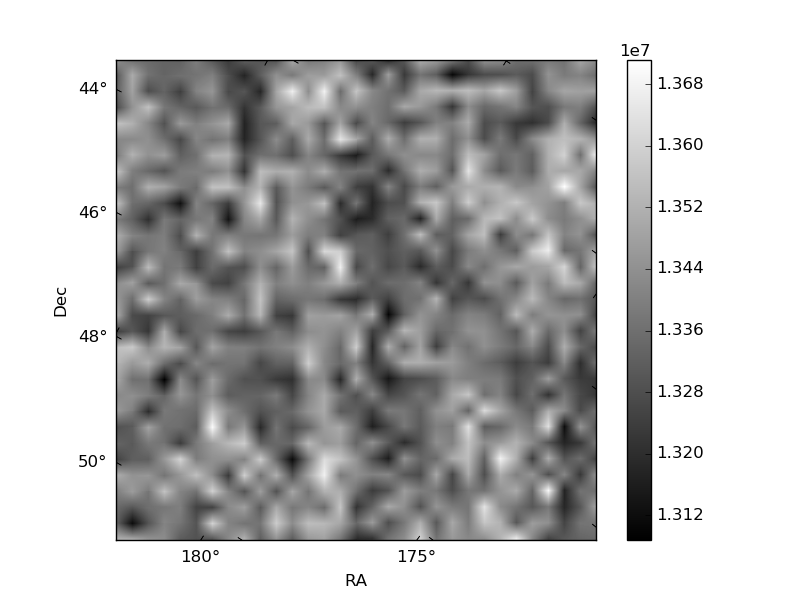
Histogram calculated using DETX and DETY for each event in the final _common_clean file
| Quadrant A | 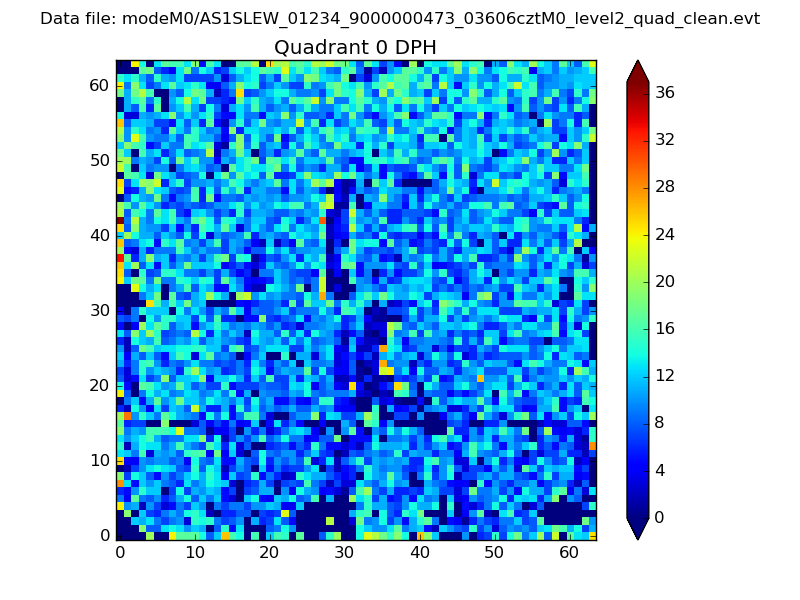 |
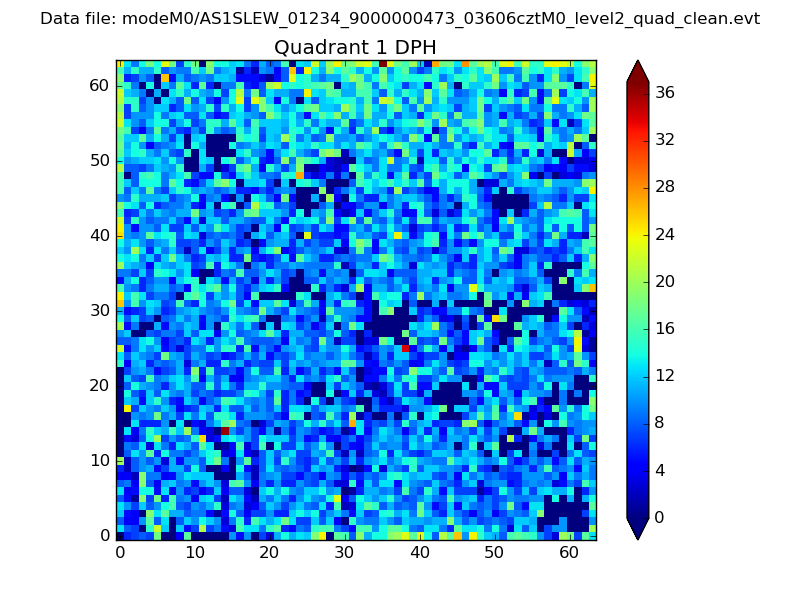 |
Quadrant B |
|---|---|---|---|
| Quadrant D | 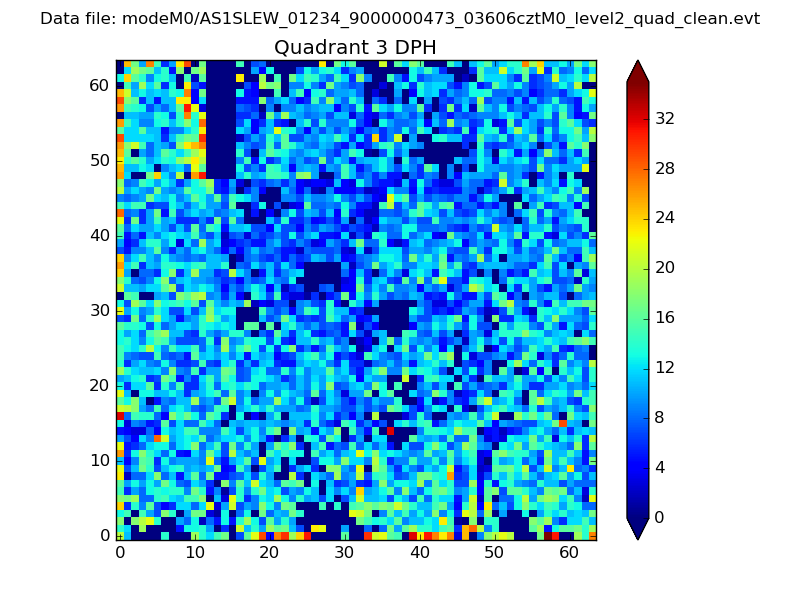 |
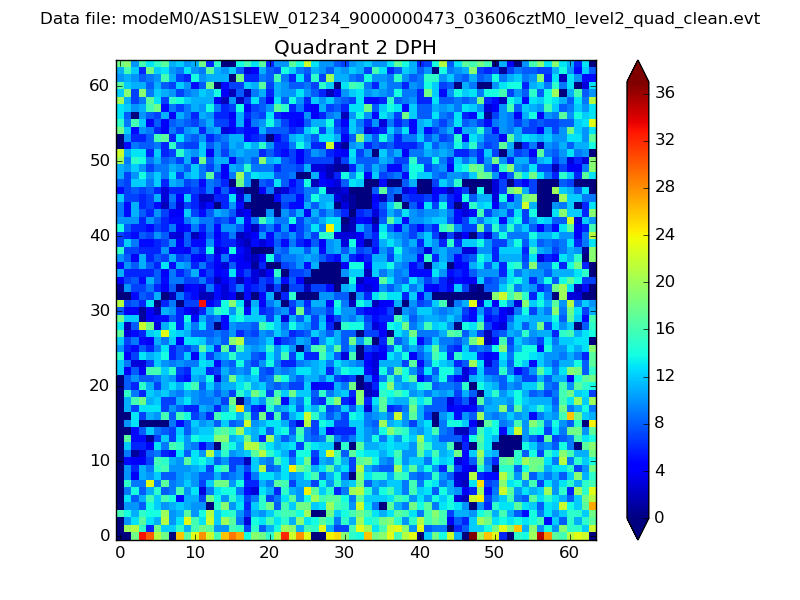 |
Quadrant C |
| Plot type | Count rate plots | Images |
|---|---|---|
| Comparison with Poisson distribution Blue bars denote a histogram of data divided into 1 sec bins. Red curve is a Poisson curve with rate = median count rate of data. |
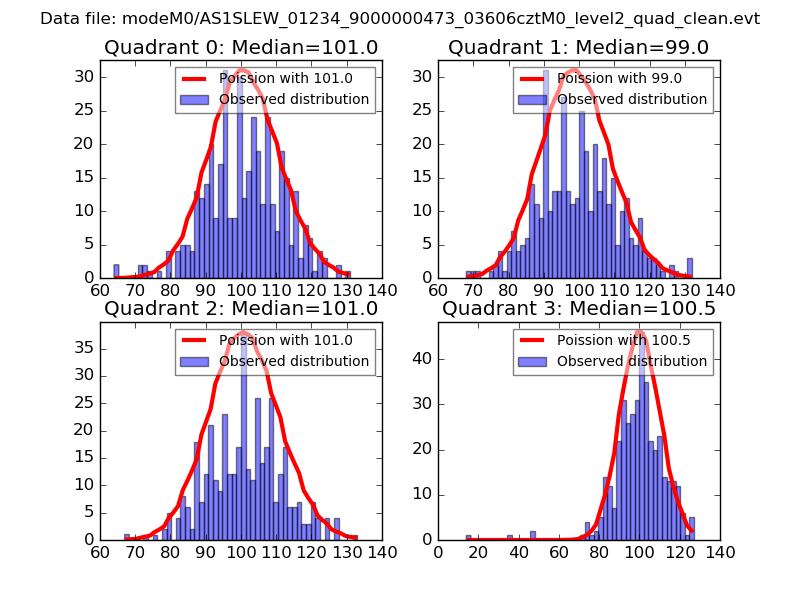 |
 |
| Quadrant-wise count rates Data is divided into 100 sec bins |
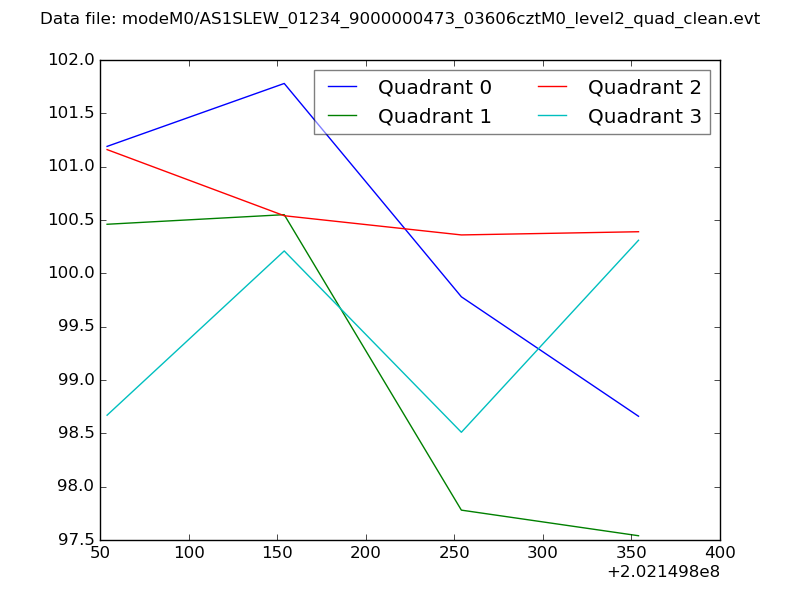 |
|
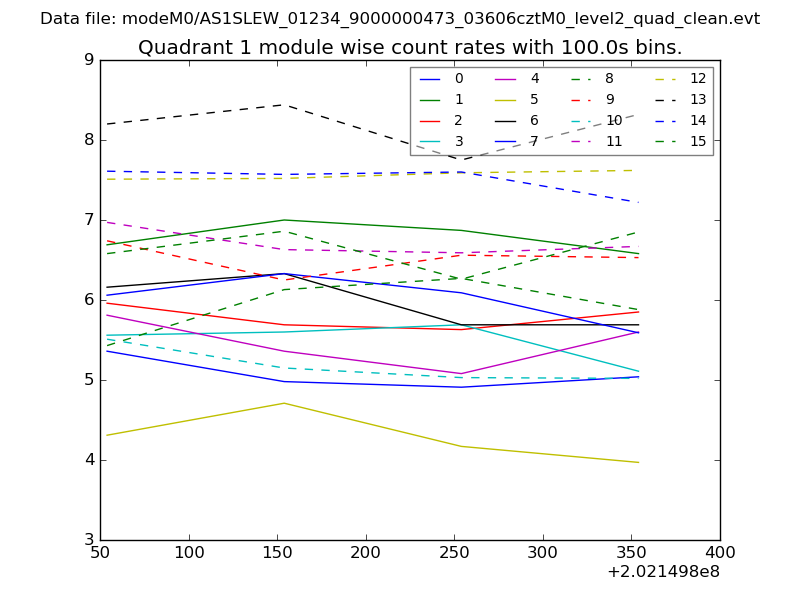
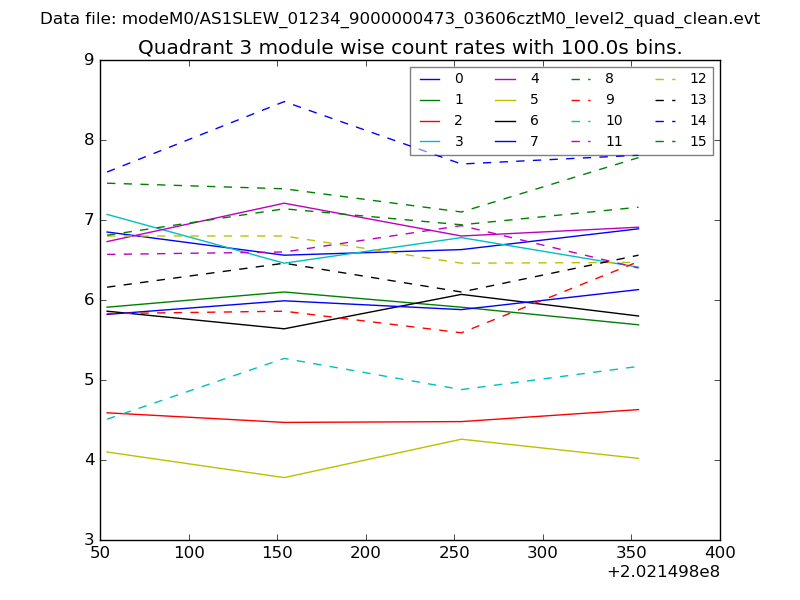
| Module-wise count rates for Quadrant A Data is divided into 100 sec bins |
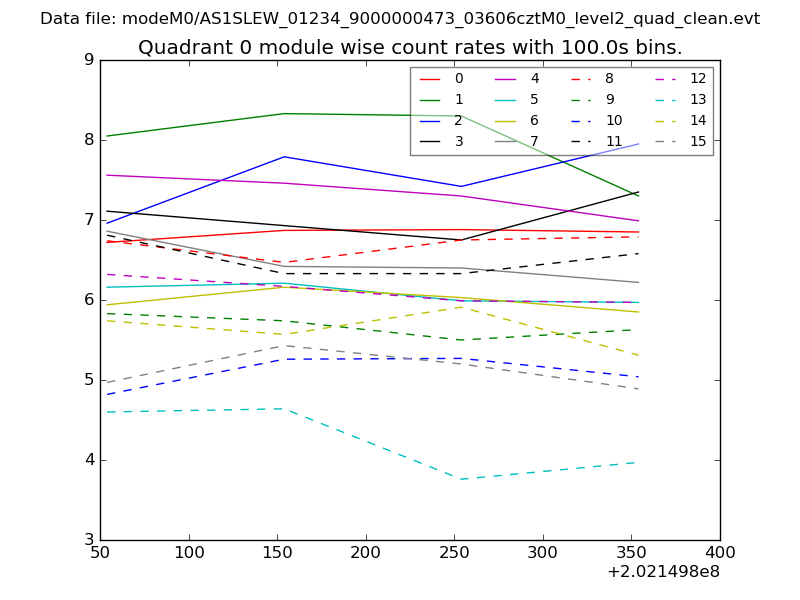 |
 |
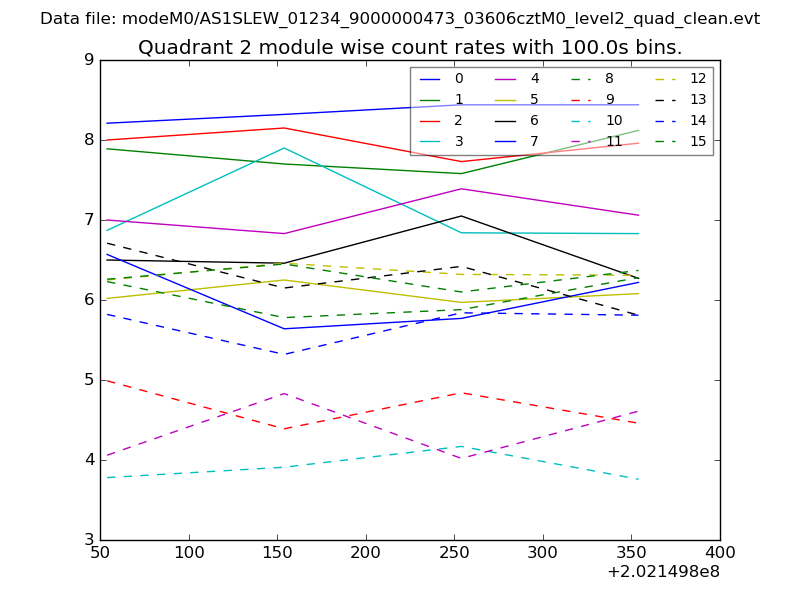
| Module-wise count rates for Quadrant B Data is divided into 100 sec bins |
 |
 |
| Module-wise count rates for Quadrant C Data is divided into 100 sec bins |
 |
 |
| Module-wise count rates for Quadrant D Data is divided into 100 sec bins |
 |
 |
| Parameter | Plot |
|---|---|
| CZT HV Monitor | 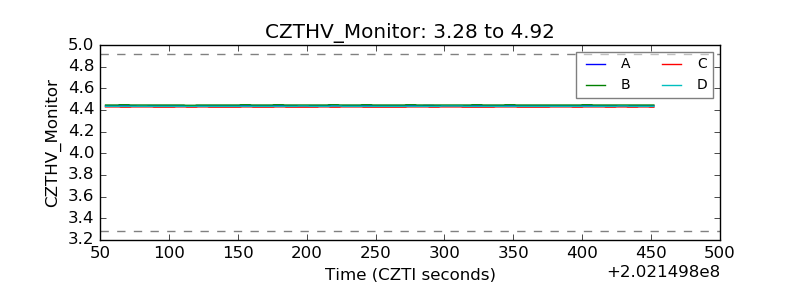 |
| D_VDD | 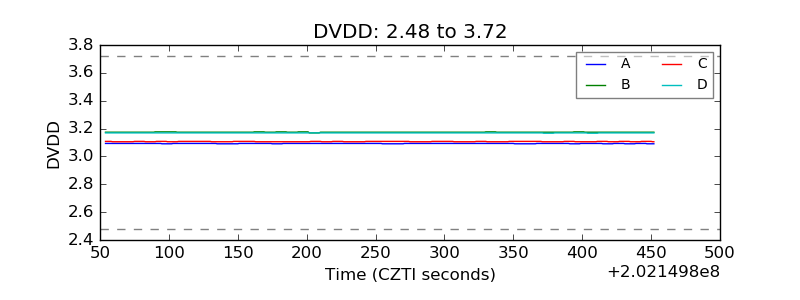 |
| Temperature 1 | 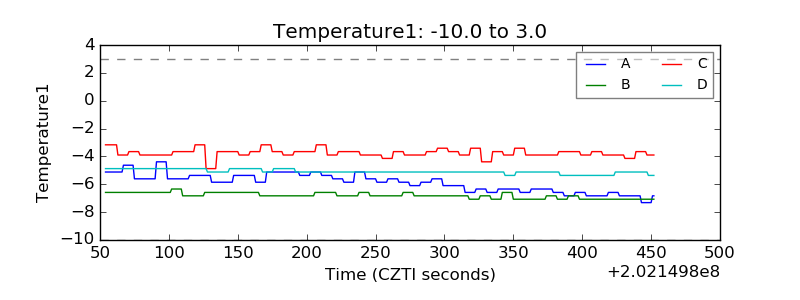 |
| Veto HV Monitor | 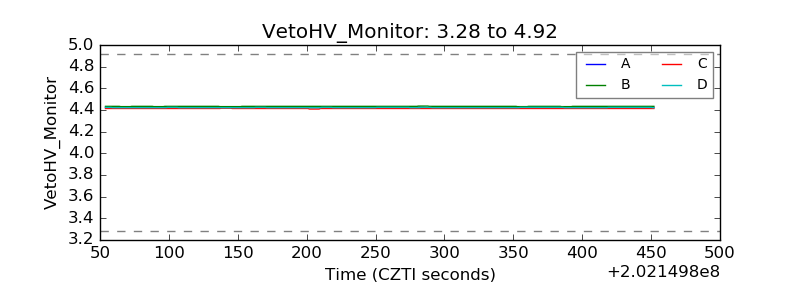 |
| Veto LLD |  |
| Alpha Counter | 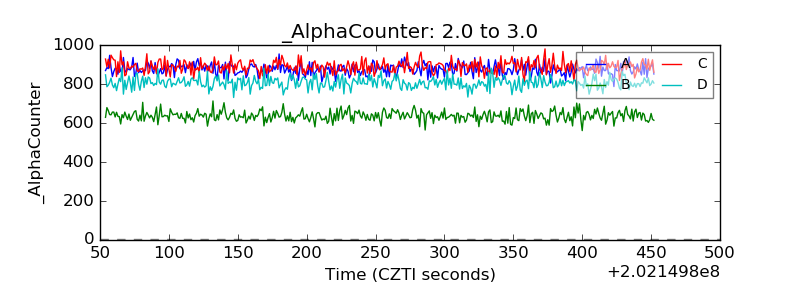 |
| _CPM_Rate | 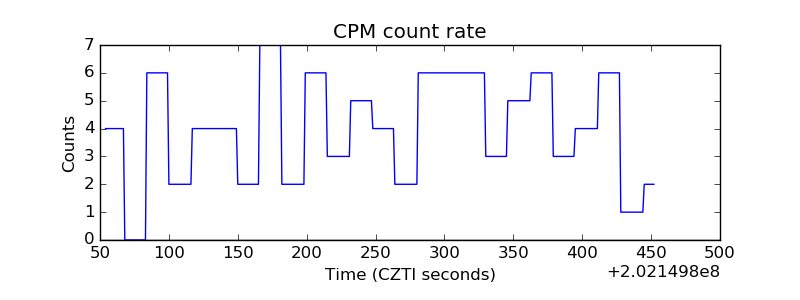 |
| CZT Counter | 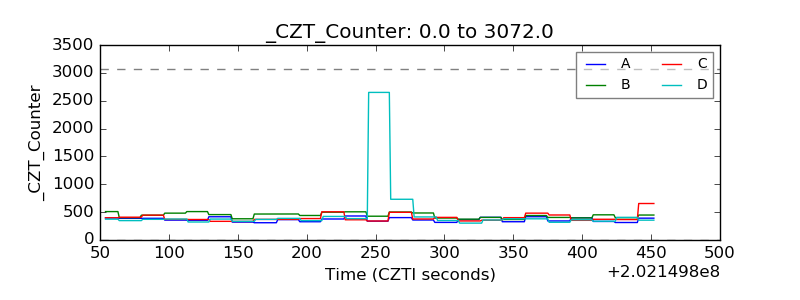 |
| +2.5 Volts monitor |  |
| +5 Volts monitor | 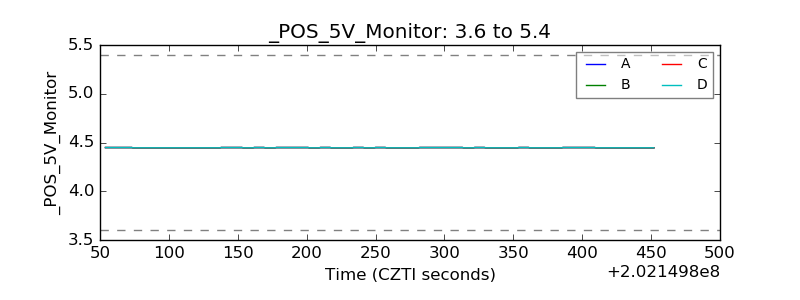 |
| Veto Counter | 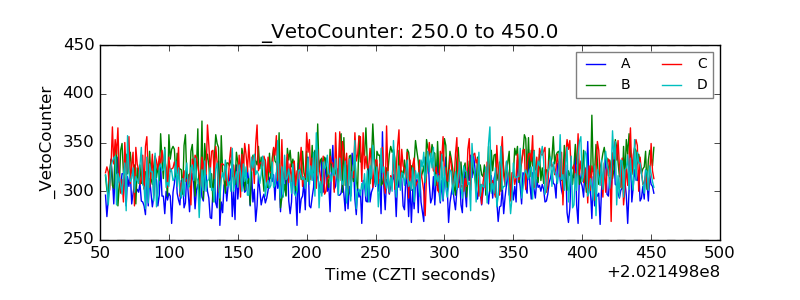 |