| Param | Original file | Final file |
|---|---|---|
| Filename | modeM0/AS1G05_191T01_9000000476cztM0_level2.fits | modeM0/AS1G05_191T01_9000000476cztM0_level2_quad_clean.evt |
| Size (bytes) | 471,421,440 | 555,068,160 |
| Size | 449.6 MB | 529.4 MB |
| Events in quadrant A | 2,817,832 | 3,476,811 |
| Events in quadrant B | 2,726,272 | 3,452,140 |
| Events in quadrant C | 2,799,054 | 3,319,492 |
| Events in quadrant D | 2,393,404 | 3,023,830 |
| Mode M0 | |||
|---|---|---|---|
| Quadrant | BADHDUFLAG | Total packets | Discarded packets |
| A | 0 | 118827 | 0 |
| B | 0 | 112737 | 0 |
| C | 0 | 106909 | 0 |
| D | 0 | 129817 | 0 |
| Mode SS | |||
|---|---|---|---|
| Quadrant | BADHDUFLAG | Total packets | Discarded packets |
| A | 0 | 1050 | 0 |
| B | 0 | 1050 | 0 |
| C | 0 | 1050 | 0 |
| D | 0 | 1050 | 0 |
| Mode M9 | |||
|---|---|---|---|
| Quadrant | BADHDUFLAG | Total packets | Discarded packets |
| A | 0 | 63 | 0 |
| B | 0 | 63 | 0 |
| C | 0 | 63 | 0 |
| D | 0 | 63 | 0 |
| Quadrant | Total seconds | Saturated seconds | Saturation percentage |
|---|---|---|---|
| A | 51578 | 1052 | 2.039629% |
| B | 51582 | 802 | 1.554806% |
| C | 51582 | 524 | 1.015858% |
| D | 51583 | 1965 | 3.809395% |
Noise dominated data is calculated using 1-second bins in cleaned event files. If a bin has >2000 counts, and if more than 50% of those come from <1% of pixels, then it is considered to be noise-dominated and hence unusable.
| Quadrant | # 1 sec bins | Bins with >0 counts | Bins with >2000 counts | High rate bins dominated by noise | Noise dominated (total time) | Noise dominated (detector-on time) | Marked lightcurve |
|---|---|---|---|---|---|---|---|
| A | 57889 | 51579 | 0 | 0 | 0.00% | 0.00% |  |
| B | 57889 | 51585 | 0 | 0 | 0.00% | 0.00% |  |
| C | 57889 | 51583 | 0 | 0 | 0.00% | 0.00% |  |
| D | 57889 | 51582 | 0 | 0 | 0.00% | 0.00% |  |
Top three noisy pixels from each quadrant. If the there are fewer than three noisy pixels in the level2.evt file, extra rows are filled as -1
| Pixel properties | Quadrant properties | ||||||
|---|---|---|---|---|---|---|---|
| Quadrant | DetID | PixID | Counts | Sigma | Mean | Median | Sigma |
| A | 0 | 29 | 2955 | 12.02 | 730 | 680 | 189.3 |
| A | 14 | 188 | 2811 | 11.26 | 730 | 680 | 189.3 |
| A | 14 | 204 | 2480 | 9.51 | 730 | 680 | 189.3 |
| B | 2 | 9 | 2395 | 11.53 | 720 | 684 | 148.4 |
| B | 12 | 226 | 2006 | 8.91 | 720 | 684 | 148.4 |
| B | 5 | 225 | 1874 | 8.02 | 720 | 684 | 148.4 |
| C | 1 | 81 | 2077 | 7.01 | 738 | 683 | 199.0 |
| C | 1 | 80 | 2062 | 6.93 | 738 | 683 | 199.0 |
| C | 1 | 65 | 1997 | 6.6 | 738 | 683 | 199.0 |
| D | 11 | 82 | 2215 | 8.65 | 681 | 619 | 184.5 |
| D | 1 | 19 | 1795 | 6.37 | 681 | 619 | 184.5 |
| D | 3 | 14 | 1792 | 6.36 | 681 | 619 | 184.5 |
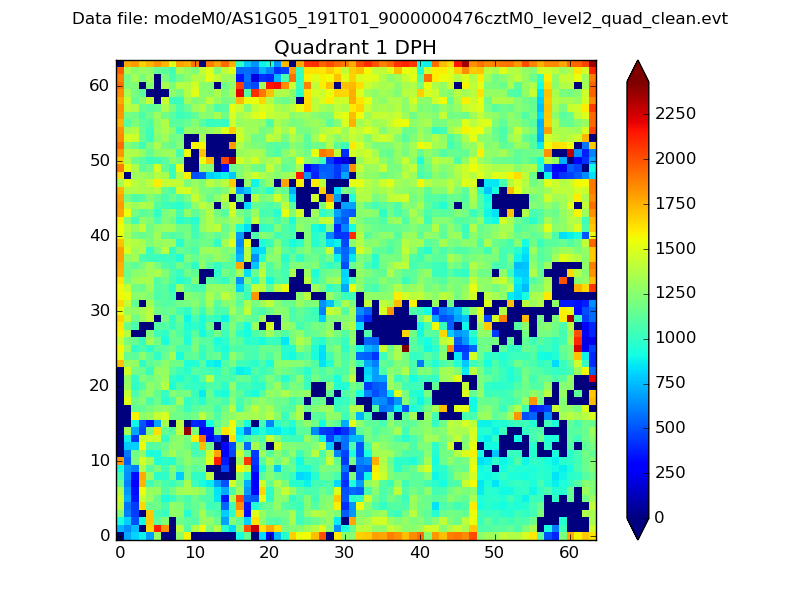
Histogram calculated using DETX and DETY for each event in the final _common_clean file
| Quadrant A |  |
 |
Quadrant B |
|---|---|---|---|
| Quadrant D |  |
 |
Quadrant C |
| Plot type | Count rate plots | Images |
|---|---|---|
| Comparison with Poisson distribution Blue bars denote a histogram of data divided into 1 sec bins. Red curve is a Poisson curve with rate = median count rate of data. |
 |
 |
| Quadrant-wise count rates Data is divided into 100 sec bins |
 |
|
| Module-wise count rates for Quadrant A Data is divided into 100 sec bins |
 |
 |
| Module-wise count rates for Quadrant B Data is divided into 100 sec bins |
 |
 |
| Module-wise count rates for Quadrant C Data is divided into 100 sec bins |
 |
 |
| Module-wise count rates for Quadrant D Data is divided into 100 sec bins |
 |
 |
| Parameter | Plot |
|---|---|
| CZT HV Monitor |  |
| D_VDD | 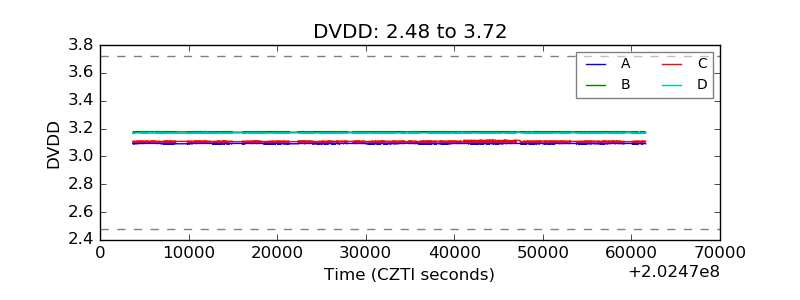 |
| Temperature 1 |  |
| Veto HV Monitor |  |
| Veto LLD |  |
| Alpha Counter |  |
| _CPM_Rate |  |
| CZT Counter |  |
| +2.5 Volts monitor |  |
| +5 Volts monitor |  |
| _ROLL_ROT |  |
| _Roll_DEC |  |
| _Roll_RA |  |
| Veto Counter |  |