| Param | Original file | Final file |
|---|---|---|
| Filename | modeM0/AS1G05_191T01_9000000476_03662cztM0_level2.evt | modeM0/AS1G05_191T01_9000000476_03662cztM0_level2_quad_clean.evt |
| Size (bytes) | 450,195,840 | 61,986,240 |
| Size | 429.3 MB | 59.1 MB |
| Events in quadrant A | 3,249,083 | 364,658 |
| Events in quadrant B | 3,555,554 | 359,657 |
| Events in quadrant C | 3,106,791 | 357,738 |
| Events in quadrant D | 3,283,781 | 344,112 |
| Mode M0 | |||
|---|---|---|---|
| Quadrant | BADHDUFLAG | Total packets | Discarded packets |
| A | 0 | 13485 | 2 |
| B | 0 | 14389 | 1 |
| C | 0 | 13318 | 1 |
| D | 0 | 13941 | 1 |
| Mode SS | |||
|---|---|---|---|
| Quadrant | BADHDUFLAG | Total packets | Discarded packets |
| A | 0 | 130 | 0 |
| B | 0 | 130 | 0 |
| C | 0 | 130 | 0 |
| D | 0 | 130 | 0 |
| Mode M9 | |||
|---|---|---|---|
| Quadrant | BADHDUFLAG | Total packets | Discarded packets |
| A | 0 | 12 | 0 |
| B | 0 | 12 | 0 |
| C | 0 | 12 | 0 |
| D | 0 | 12 | 0 |
| Quadrant | Total seconds | Saturated seconds | Saturation percentage |
|---|---|---|---|
| A | 6460 | 121 | 1.873065% |
| B | 6460 | 132 | 2.043344% |
| C | 6460 | 91 | 1.408669% |
| D | 6460 | 140 | 2.167183% |
Noise dominated data is calculated using 1-second bins in cleaned event files. If a bin has >2000 counts, and if more than 50% of those come from <1% of pixels, then it is considered to be noise-dominated and hence unusable.
| Quadrant | # 1 sec bins | Bins with >0 counts | Bins with >2000 counts | High rate bins dominated by noise | Noise dominated (total time) | Noise dominated (detector-on time) | Marked lightcurve |
|---|---|---|---|---|---|---|---|
| A | 7675 | 6461 | 1 | 1 | 0.01% | 0.02% | 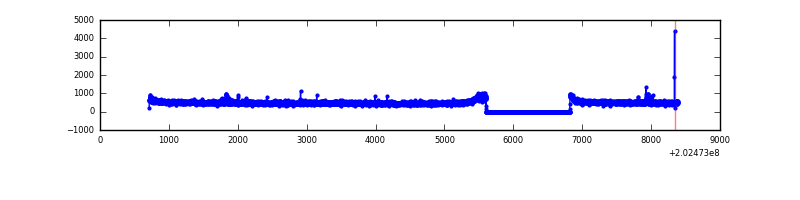 |
| B | 7675 | 6461 | 4 | 4 | 0.05% | 0.06% | 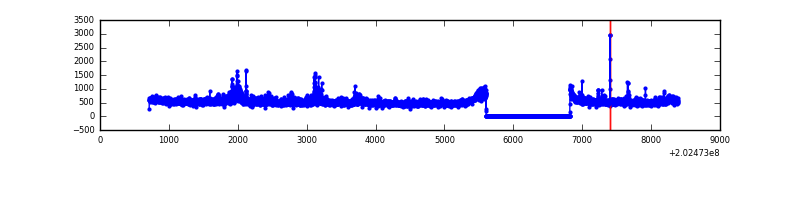 |
| C | 7675 | 6461 | 0 | 0 | 0.00% | 0.00% | 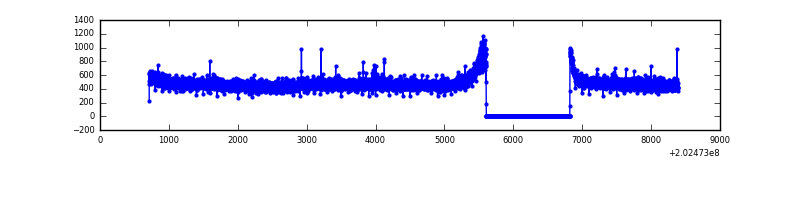 |
| D | 7675 | 6461 | 34 | 34 | 0.44% | 0.53% | 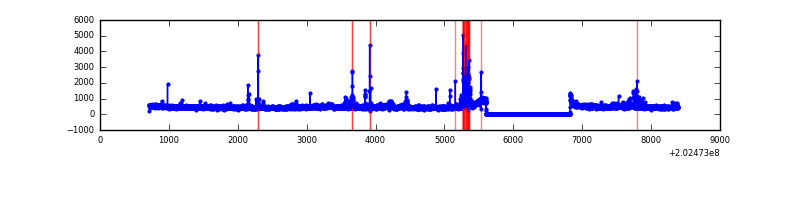 |
Top three noisy pixels from each quadrant. If the there are fewer than three noisy pixels in the level2.evt file, extra rows are filled as -1
| Pixel properties | Quadrant properties | ||||||
|---|---|---|---|---|---|---|---|
| Quadrant | DetID | PixID | Counts | Sigma | Mean | Median | Sigma |
| A | 8 | 15 | 27937 | 162.73 | 826 | 814 | 166.7 |
| A | 0 | 50 | 18305 | 104.94 | 826 | 814 | 166.7 |
| A | 0 | 226 | 8990 | 49.05 | 826 | 814 | 166.7 |
| B | 15 | 204 | 222225 | 1396.93 | 828 | 811 | 158.5 |
| B | 0 | 199 | 24852 | 151.68 | 828 | 811 | 158.5 |
| B | 5 | 172 | 17637 | 106.16 | 828 | 811 | 158.5 |
| C | 9 | 247 | 7683 | 37.65 | 792 | 798 | 182.9 |
| C | 13 | 61 | 6912 | 33.44 | 792 | 798 | 182.9 |
| C | 10 | 34 | 2743 | 10.64 | 792 | 798 | 182.9 |
| D | 13 | 223 | 149724 | 787.9 | 793 | 771 | 189.0 |
| D | 2 | 37 | 52388 | 273.03 | 793 | 771 | 189.0 |
| D | 13 | 172 | 32625 | 168.5 | 793 | 771 | 189.0 |
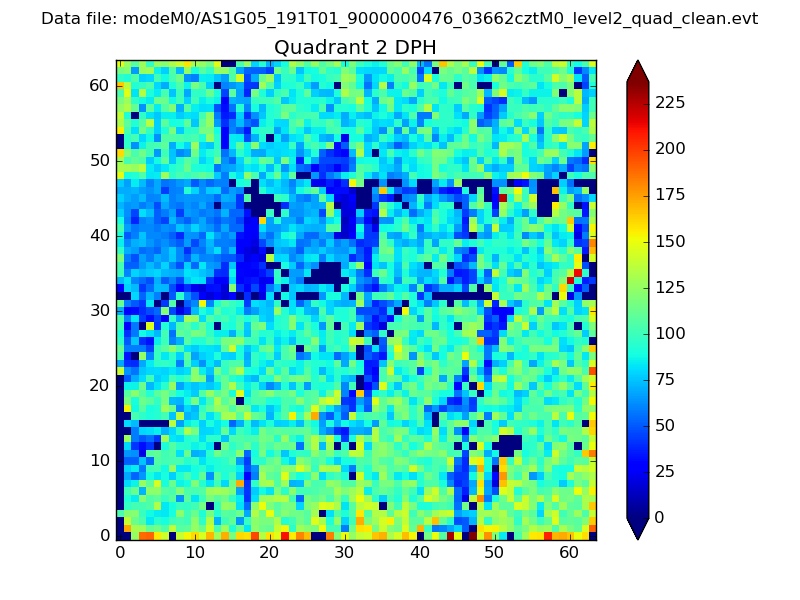
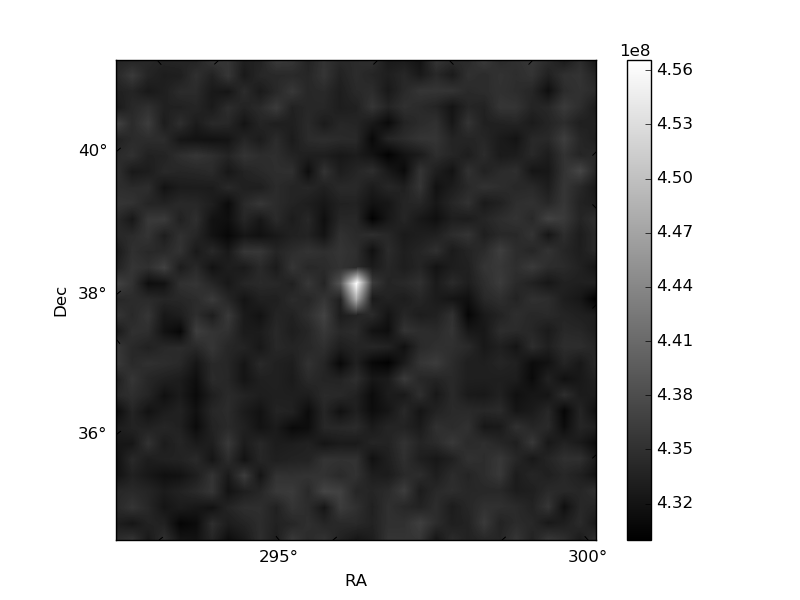
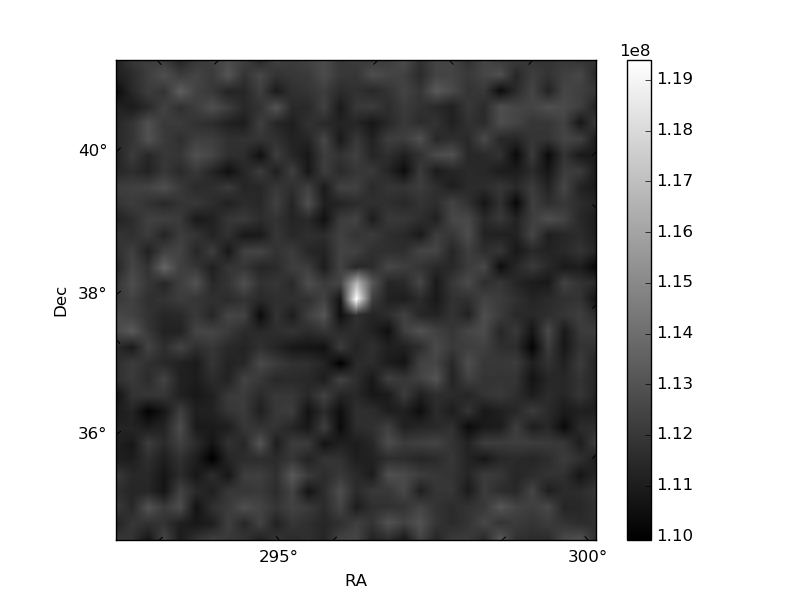
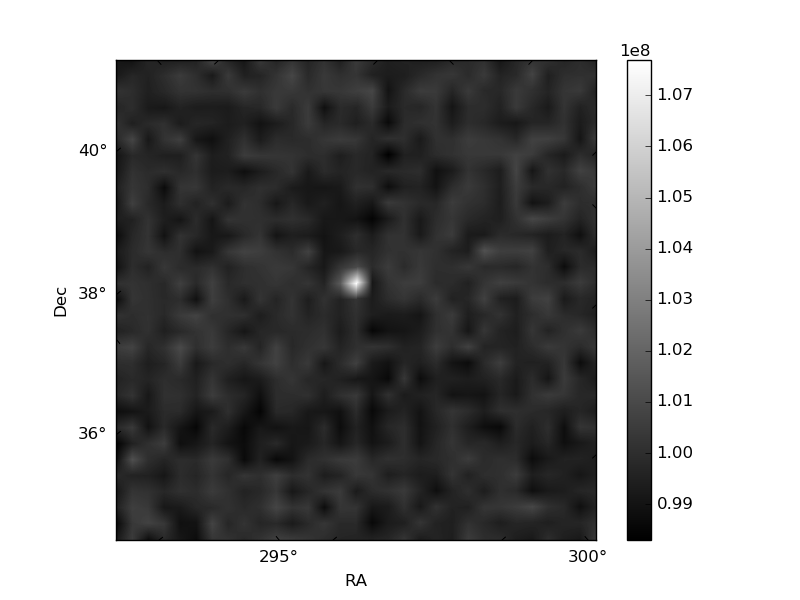
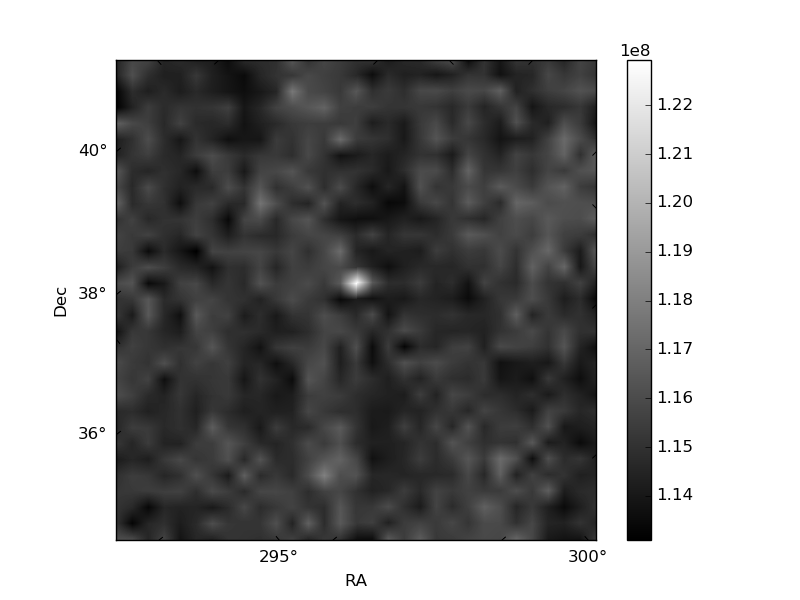
Histogram calculated using DETX and DETY for each event in the final _common_clean file
| Quadrant A | 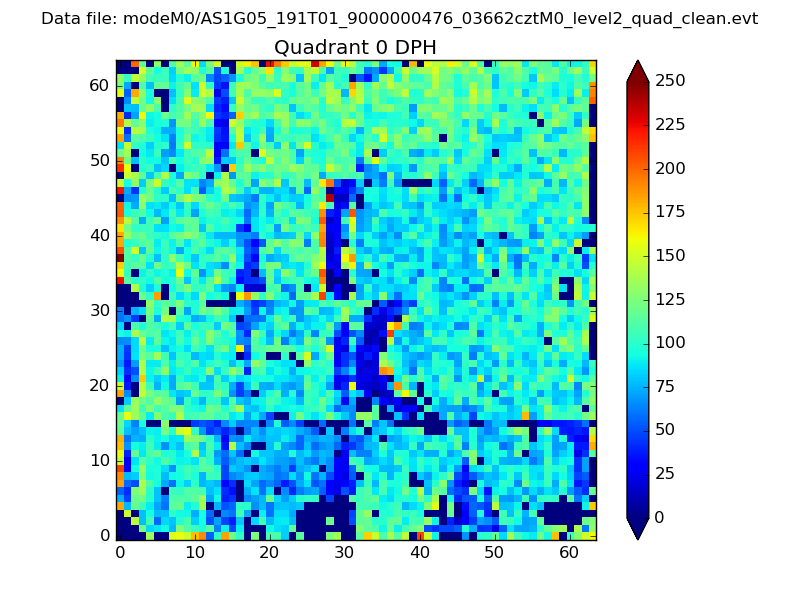 |
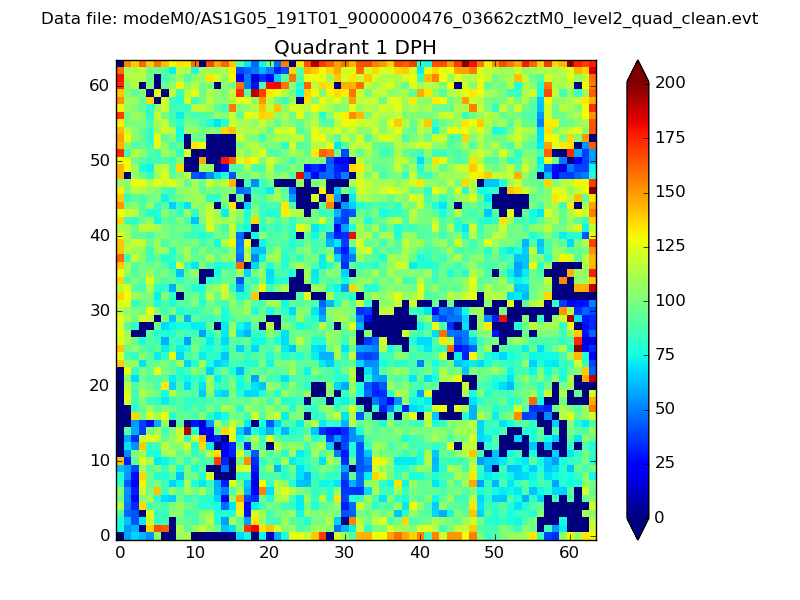 |
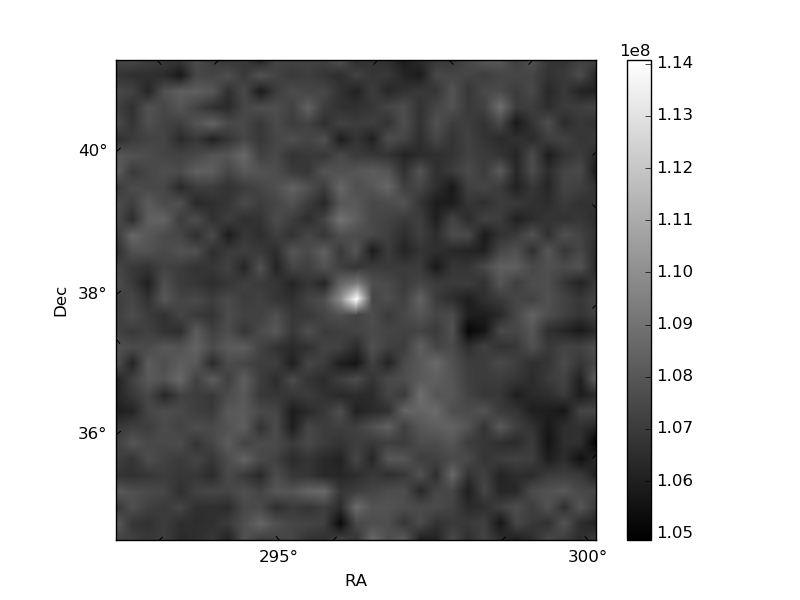
Quadrant B |
|---|---|---|---|
| Quadrant D | 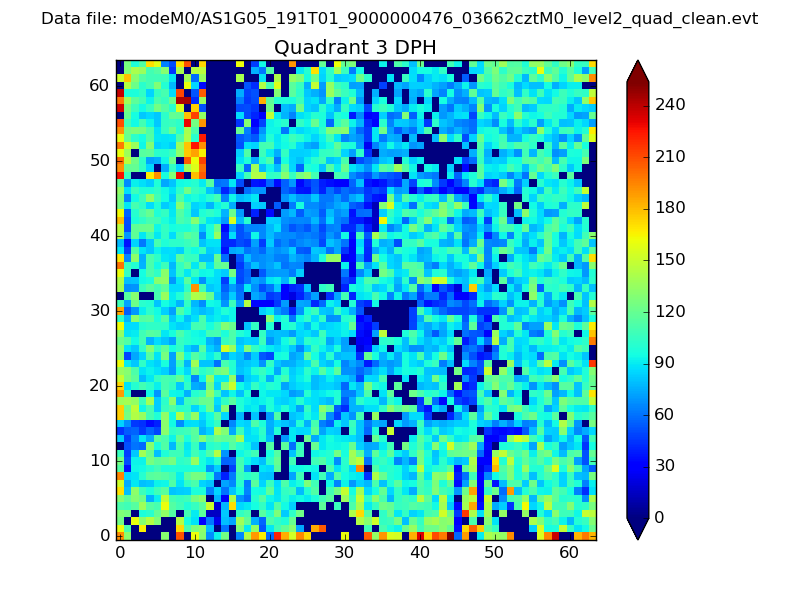 |
 |
Quadrant C |
| Plot type | Count rate plots | Images |
|---|---|---|
| Comparison with Poisson distribution Blue bars denote a histogram of data divided into 1 sec bins. Red curve is a Poisson curve with rate = median count rate of data. |
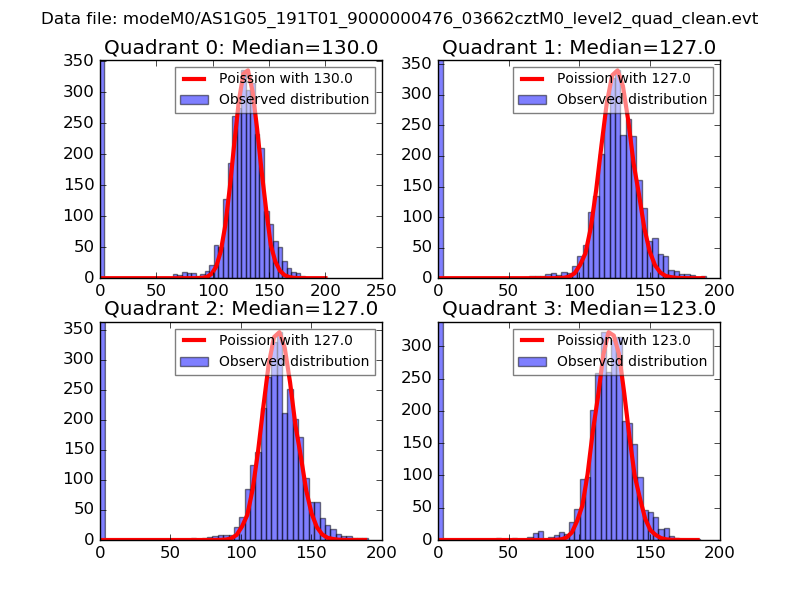 |
 |
| Quadrant-wise count rates Data is divided into 100 sec bins |
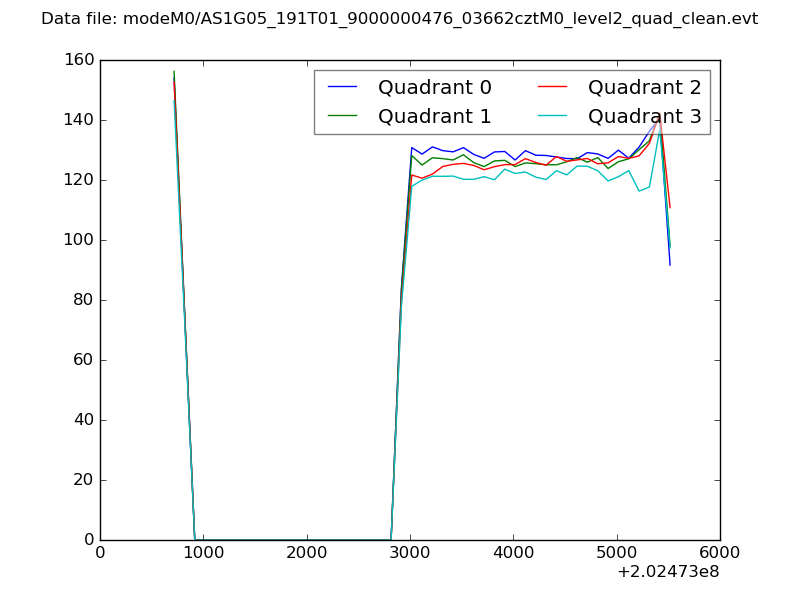 |
|
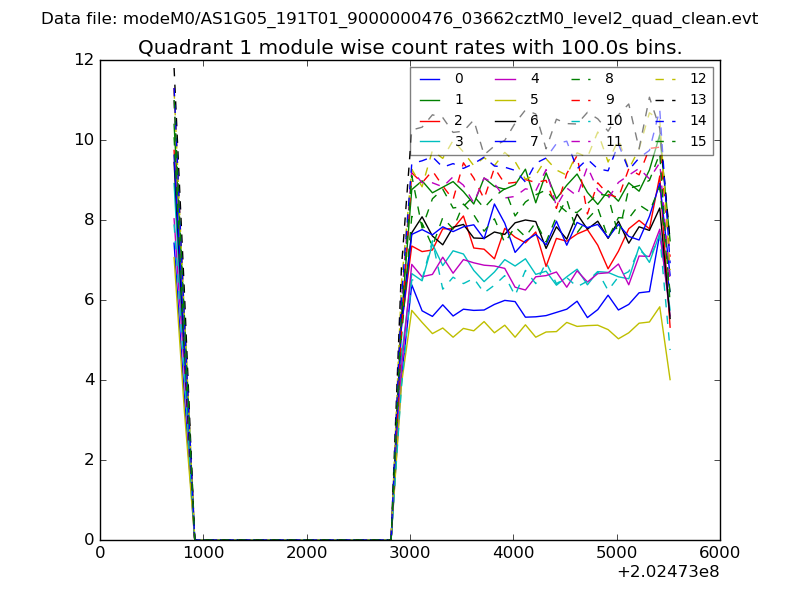
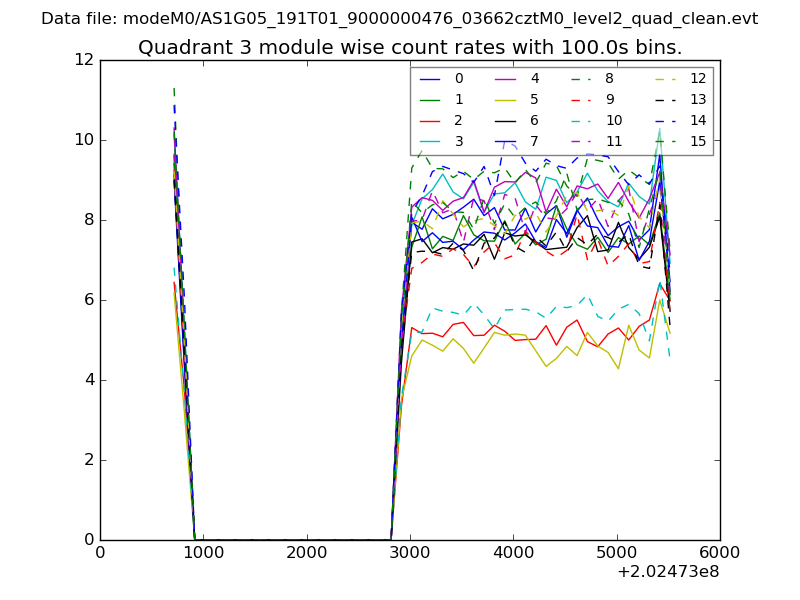
| Module-wise count rates for Quadrant A Data is divided into 100 sec bins |
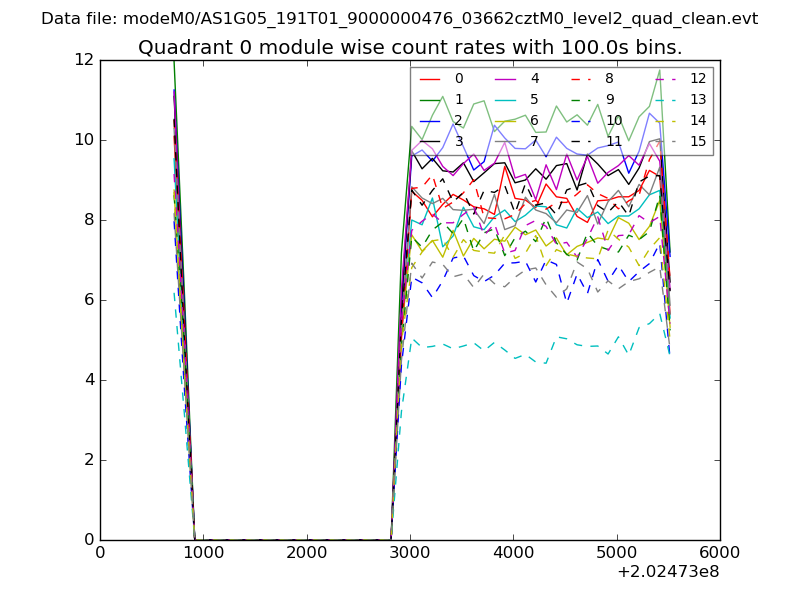 |
 |
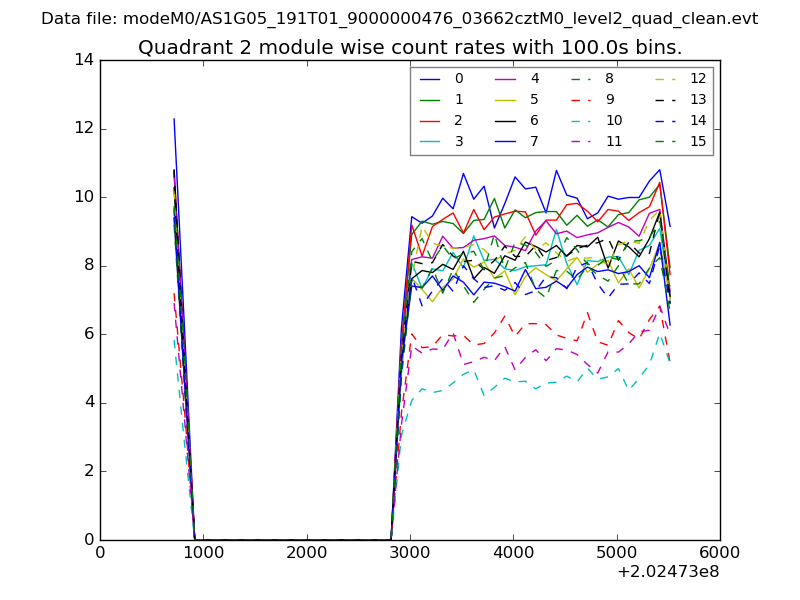
| Module-wise count rates for Quadrant B Data is divided into 100 sec bins |
 |
 |
| Module-wise count rates for Quadrant C Data is divided into 100 sec bins |
 |
 |
| Module-wise count rates for Quadrant D Data is divided into 100 sec bins |
 |
 |
| Parameter | Plot |
|---|---|
| CZT HV Monitor | 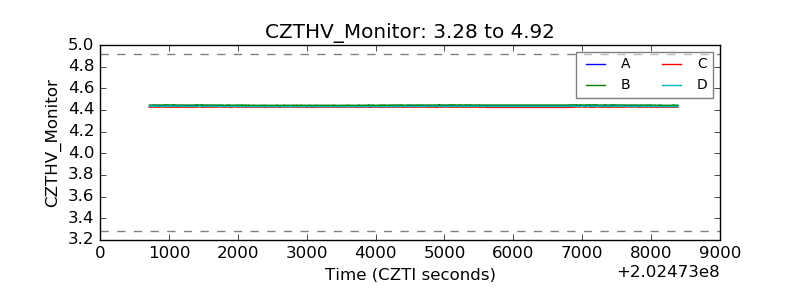 |
| D_VDD | 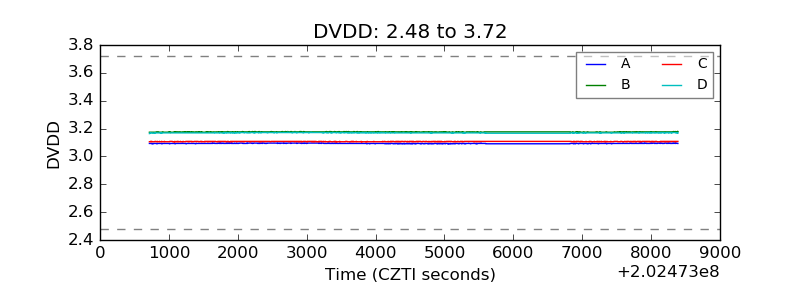 |
| Temperature 1 | 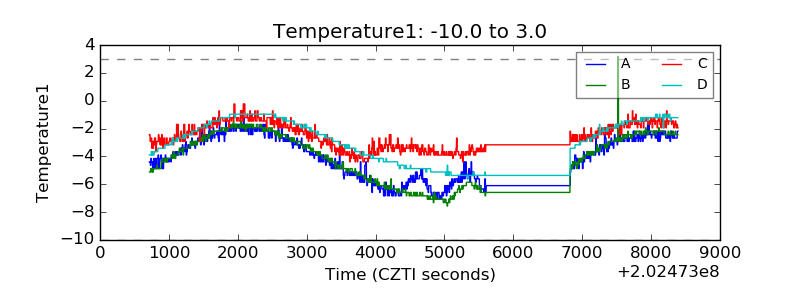 |
| Veto HV Monitor | 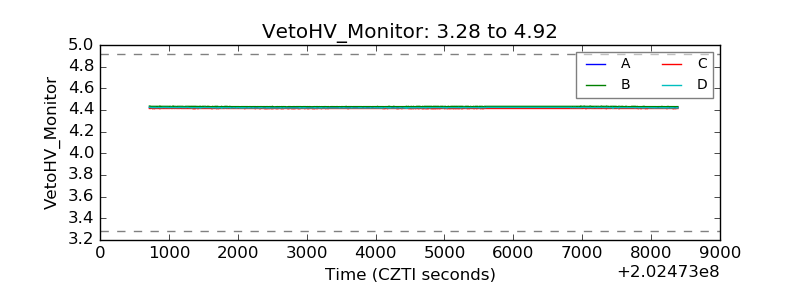 |
| Veto LLD | 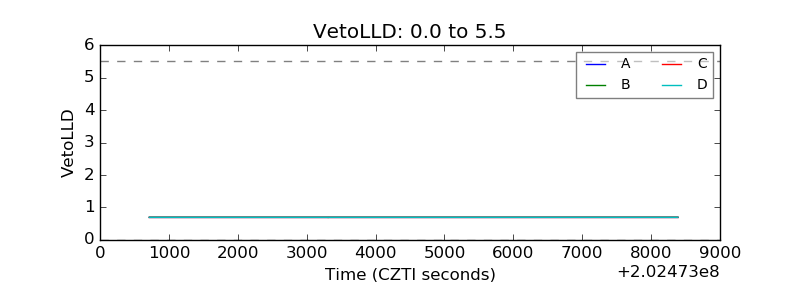 |
| Alpha Counter | 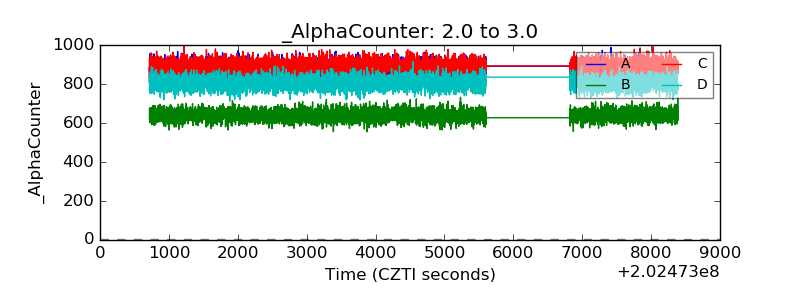 |
| _CPM_Rate | 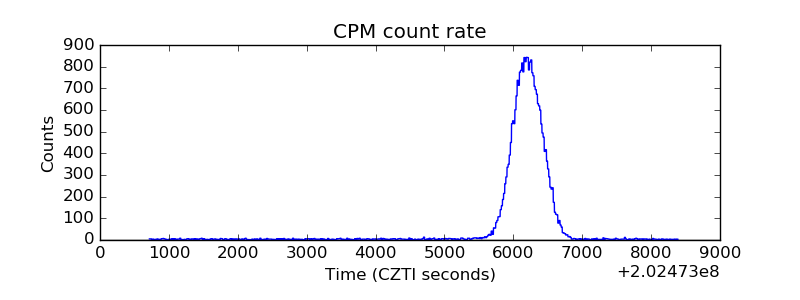 |
| CZT Counter | 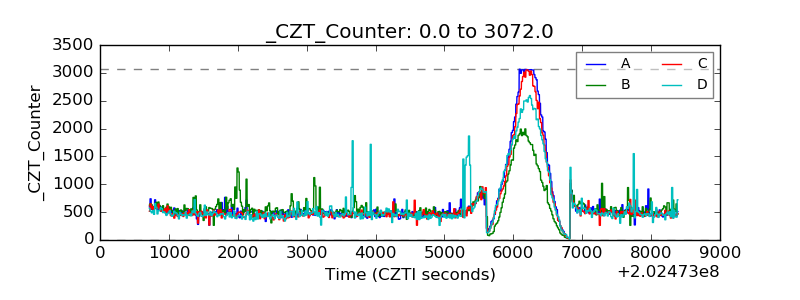 |
| +2.5 Volts monitor |  |
| +5 Volts monitor |  |
| Veto Counter | 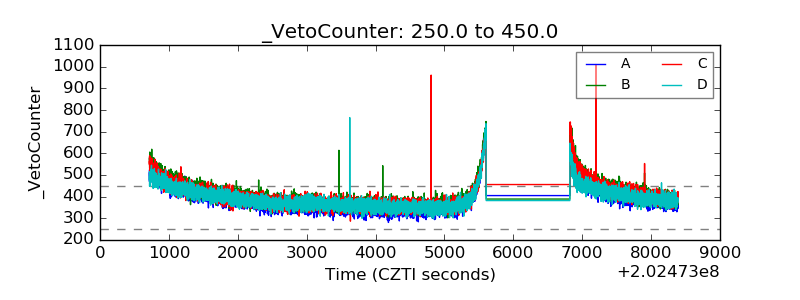 |