| Param | Original file | Final file |
|---|---|---|
| Filename | modeM0/AS1G05_191T01_9000000476_03663cztM0_level2.evt | modeM0/AS1G05_191T01_9000000476_03663cztM0_level2_quad_clean.evt |
| Size (bytes) | 520,053,120 | 66,222,720 |
| Size | 496.0 MB | 63.2 MB |
| Events in quadrant A | 3,392,811 | 392,813 |
| Events in quadrant B | 3,586,247 | 389,737 |
| Events in quadrant C | 3,220,612 | 385,386 |
| Events in quadrant D | 5,097,981 | 372,573 |
| Mode M0 | |||
|---|---|---|---|
| Quadrant | BADHDUFLAG | Total packets | Discarded packets |
| A | 0 | 14202 | 3 |
| B | 0 | 14713 | 2 |
| C | 0 | 13890 | 2 |
| D | 0 | 19494 | 2 |
| Mode SS | |||
|---|---|---|---|
| Quadrant | BADHDUFLAG | Total packets | Discarded packets |
| A | 0 | 136 | 0 |
| B | 0 | 136 | 0 |
| C | 0 | 136 | 0 |
| D | 0 | 136 | 0 |
| Mode M9 | |||
|---|---|---|---|
| Quadrant | BADHDUFLAG | Total packets | Discarded packets |
| A | 0 | 12 | 0 |
| B | 0 | 12 | 0 |
| C | 0 | 12 | 0 |
| D | 0 | 13 | 0 |
| Quadrant | Total seconds | Saturated seconds | Saturation percentage |
|---|---|---|---|
| A | 6661 | 143 | 2.146825% |
| B | 6661 | 174 | 2.612220% |
| C | 6661 | 127 | 1.906621% |
| D | 6661 | 427 | 6.410449% |
Noise dominated data is calculated using 1-second bins in cleaned event files. If a bin has >2000 counts, and if more than 50% of those come from <1% of pixels, then it is considered to be noise-dominated and hence unusable.
| Quadrant | # 1 sec bins | Bins with >0 counts | Bins with >2000 counts | High rate bins dominated by noise | Noise dominated (total time) | Noise dominated (detector-on time) | Marked lightcurve |
|---|---|---|---|---|---|---|---|
| A | 7791 | 6661 | 3 | 3 | 0.04% | 0.05% | 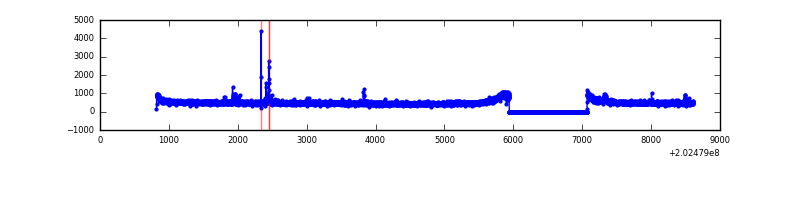 |
| B | 7791 | 6662 | 8 | 8 | 0.10% | 0.12% | 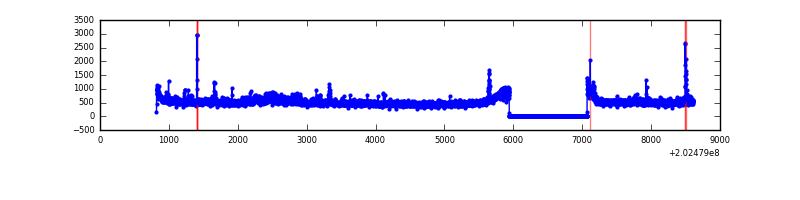 |
| C | 7791 | 6662 | 0 | 0 | 0.00% | 0.00% | 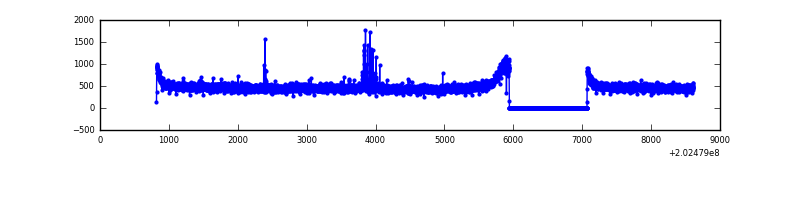 |
| D | 7791 | 6662 | 275 | 275 | 3.53% | 4.13% | 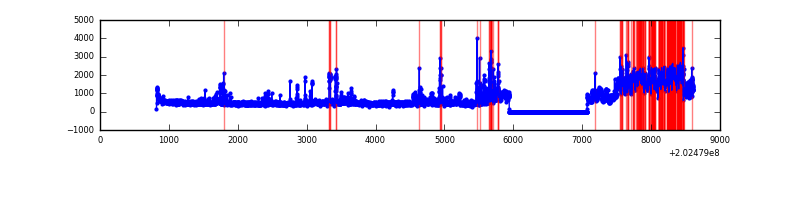 |
Top three noisy pixels from each quadrant. If the there are fewer than three noisy pixels in the level2.evt file, extra rows are filled as -1
| Pixel properties | Quadrant properties | ||||||
|---|---|---|---|---|---|---|---|
| Quadrant | DetID | PixID | Counts | Sigma | Mean | Median | Sigma |
| A | 13 | 164 | 42101 | 241.45 | 845 | 828 | 170.9 |
| A | 0 | 50 | 40804 | 233.86 | 845 | 828 | 170.9 |
| A | 3 | 1 | 22454 | 126.51 | 845 | 828 | 170.9 |
| B | 15 | 204 | 130115 | 790.88 | 848 | 828 | 163.5 |
| B | 5 | 70 | 31796 | 189.44 | 848 | 828 | 163.5 |
| B | 0 | 182 | 28127 | 166.99 | 848 | 828 | 163.5 |
| C | 9 | 247 | 26822 | 137.98 | 815 | 821 | 188.4 |
| C | 13 | 61 | 7045 | 33.03 | 815 | 821 | 188.4 |
| C | 7 | 220 | 4255 | 18.22 | 815 | 821 | 188.4 |
| D | 13 | 172 | 1693299 | 8802.88 | 807 | 787 | 192.3 |
| D | 13 | 223 | 182986 | 947.63 | 807 | 787 | 192.3 |
| D | 12 | 110 | 61071 | 313.54 | 807 | 787 | 192.3 |
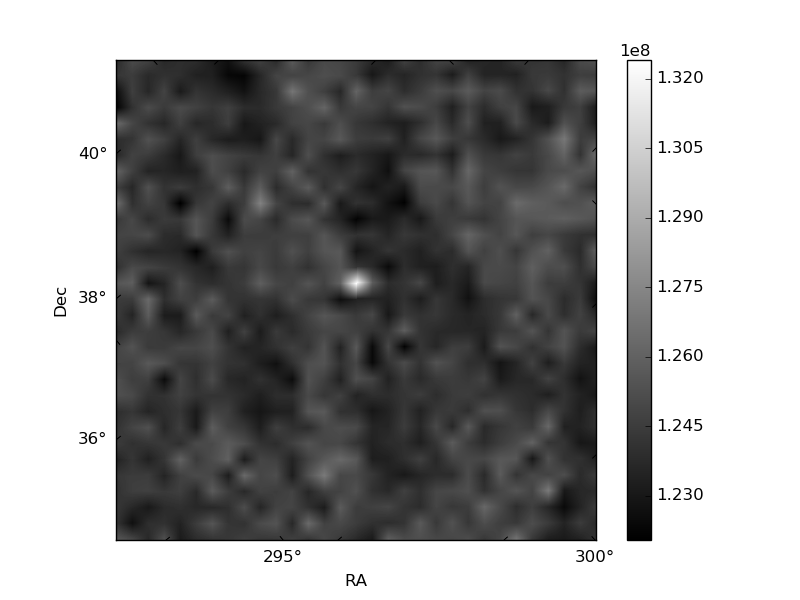
Histogram calculated using DETX and DETY for each event in the final _common_clean file
| Quadrant A | 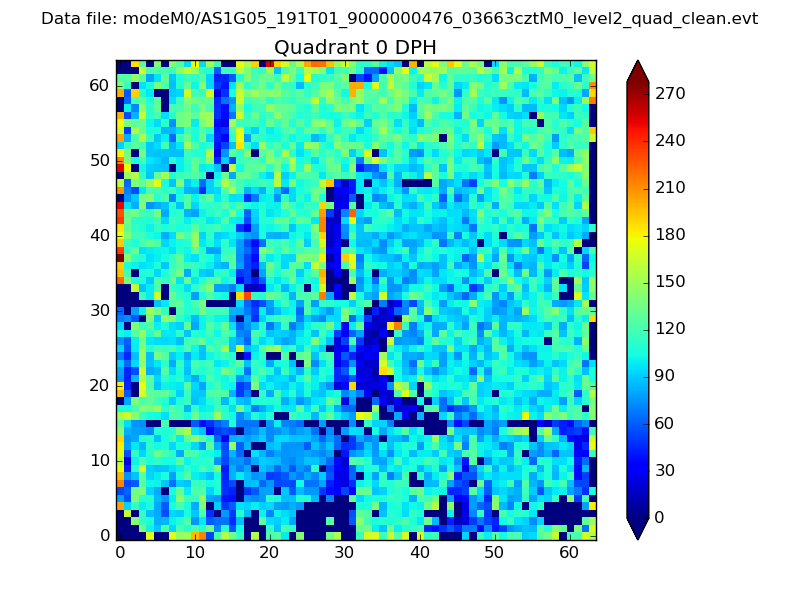 |
 |
Quadrant B |
|---|---|---|---|
| Quadrant D | 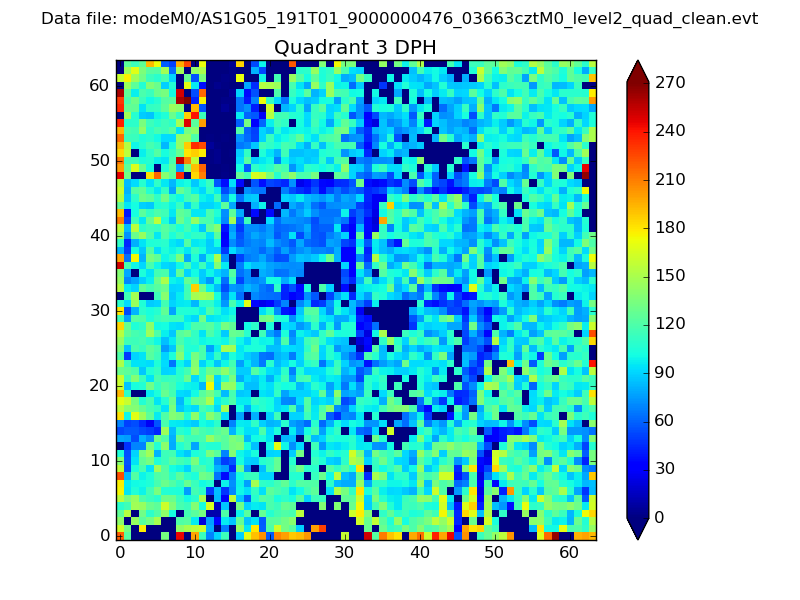 |
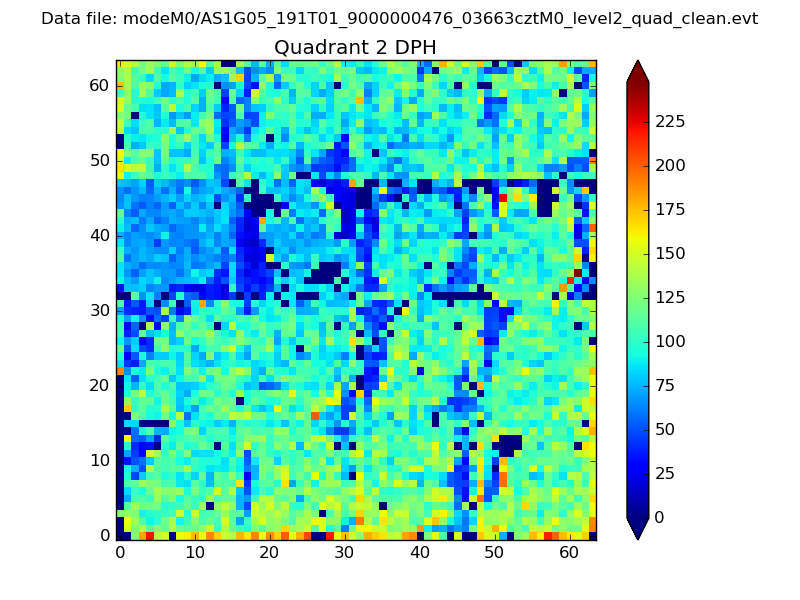 |
Quadrant C |
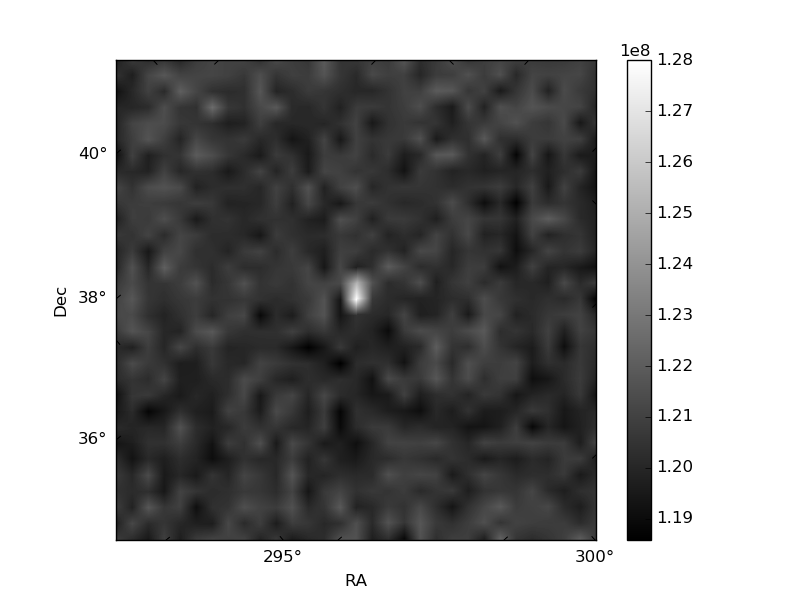
| Plot type | Count rate plots | Images |
|---|---|---|
| Comparison with Poisson distribution Blue bars denote a histogram of data divided into 1 sec bins. Red curve is a Poisson curve with rate = median count rate of data. |
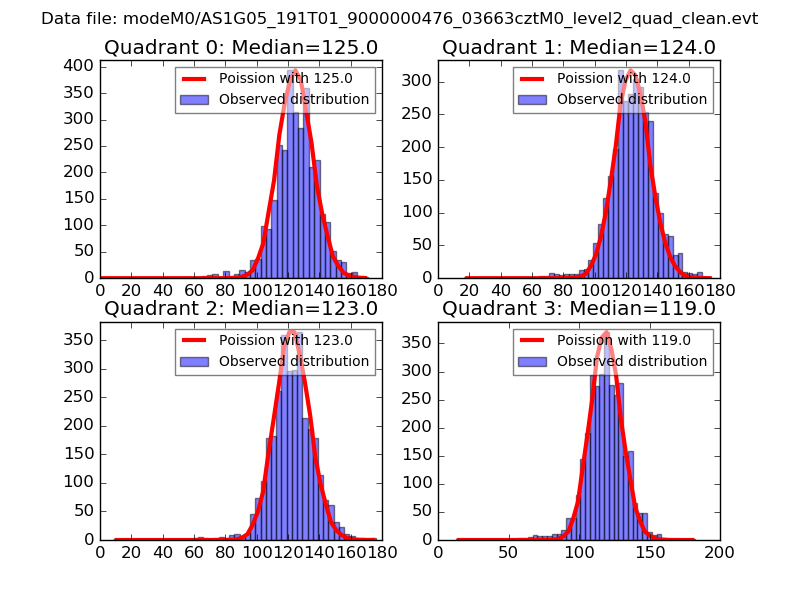 |
 |
| Quadrant-wise count rates Data is divided into 100 sec bins |
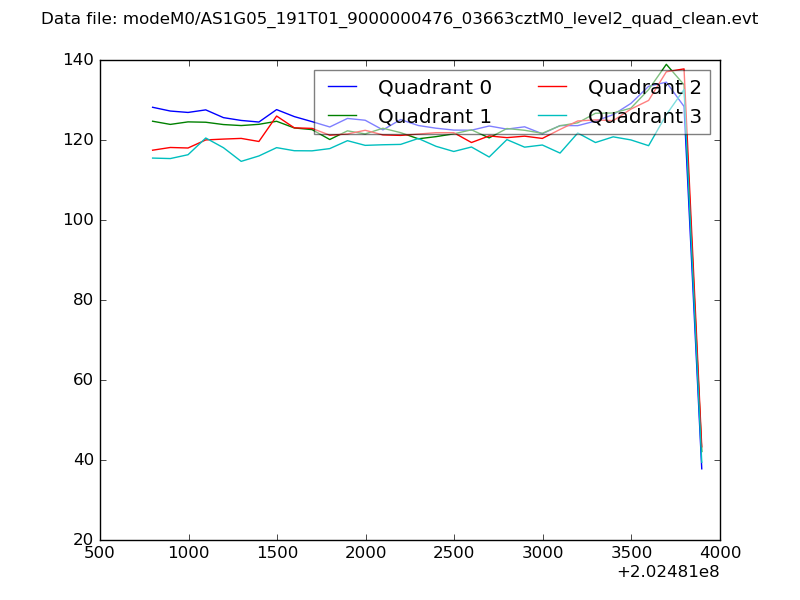 |
|
| Module-wise count rates for Quadrant A Data is divided into 100 sec bins |
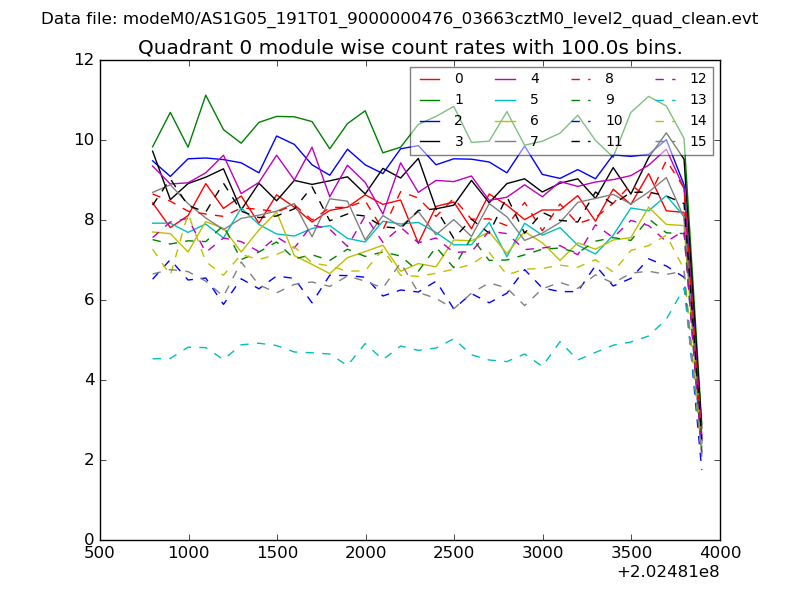 |
 |
| Module-wise count rates for Quadrant B Data is divided into 100 sec bins |
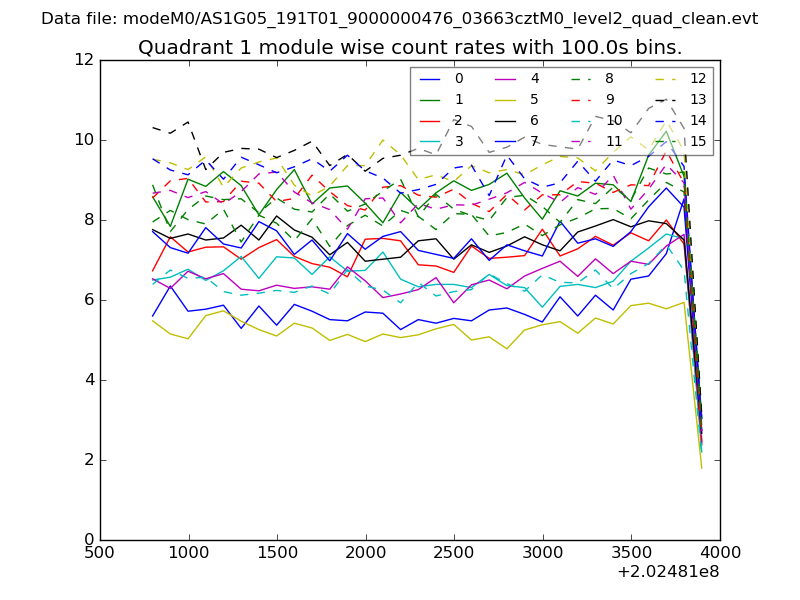 |
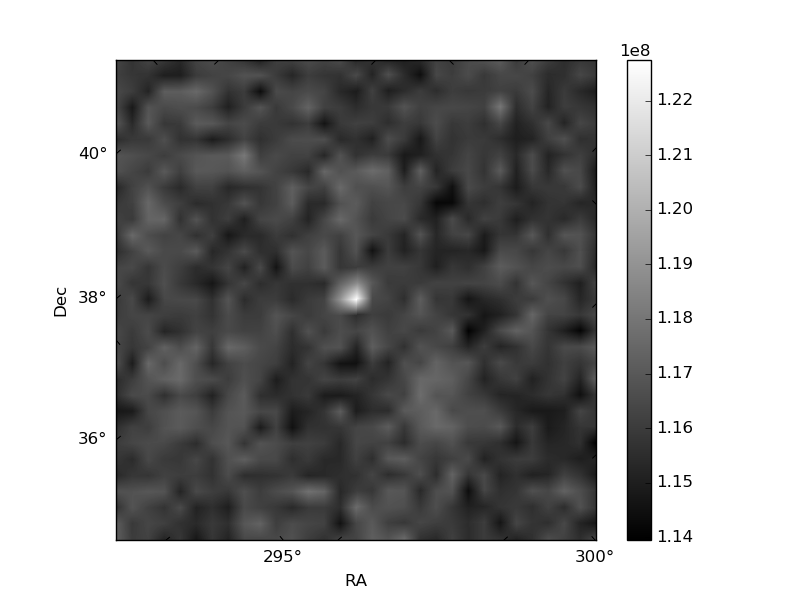 |
| Module-wise count rates for Quadrant C Data is divided into 100 sec bins |
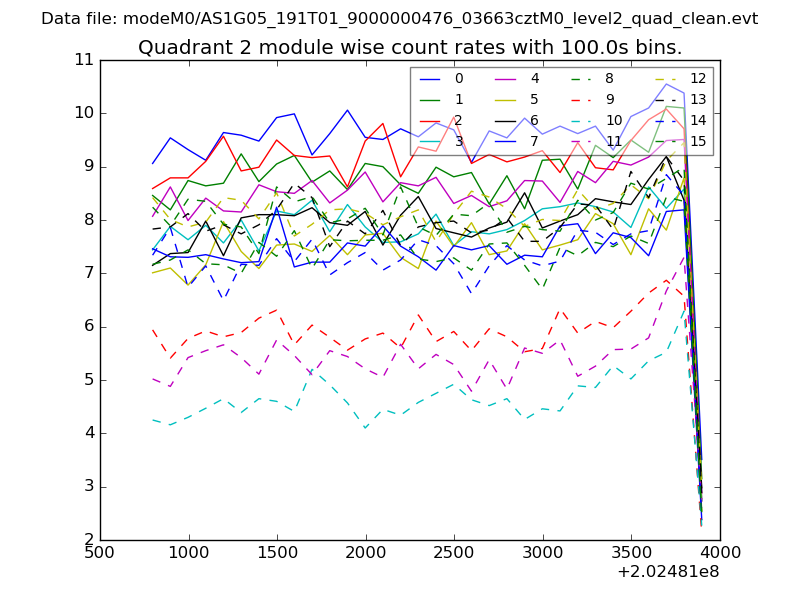 |
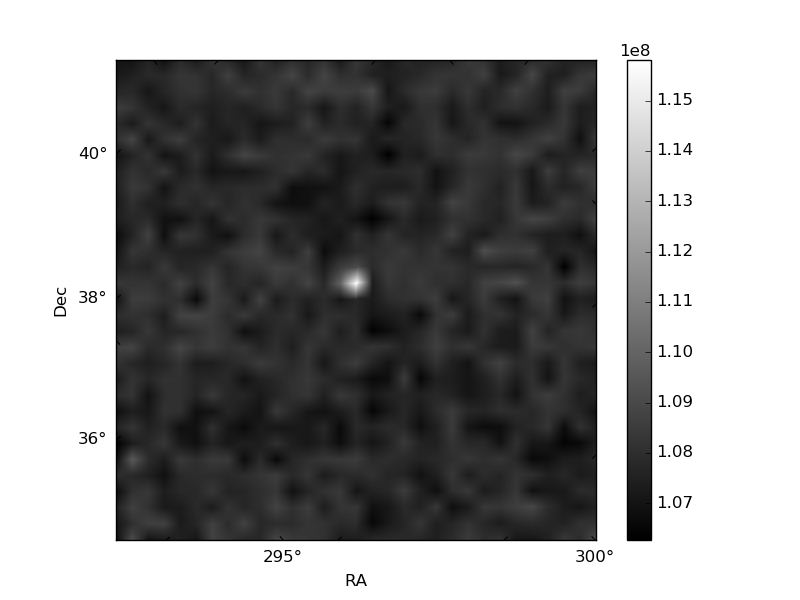 |
| Module-wise count rates for Quadrant D Data is divided into 100 sec bins |
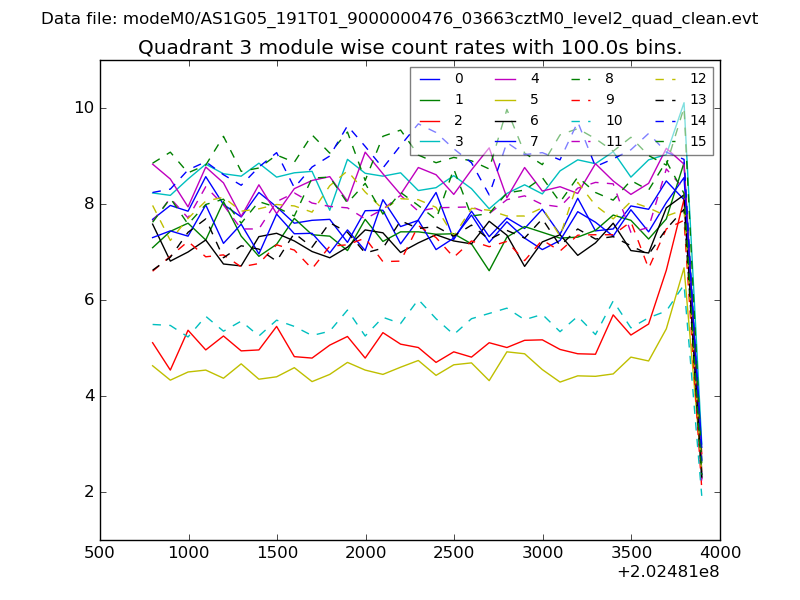 |
 |
| Parameter | Plot |
|---|---|
| CZT HV Monitor | 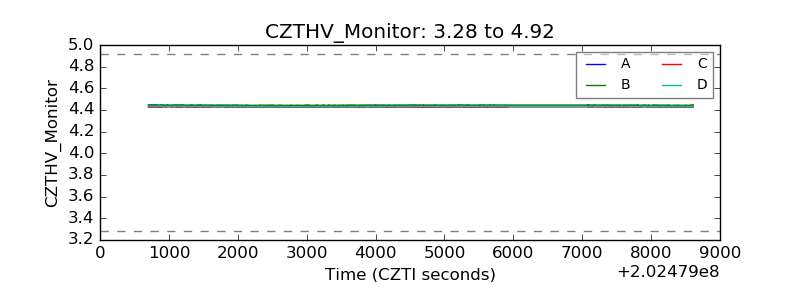 |
| D_VDD | 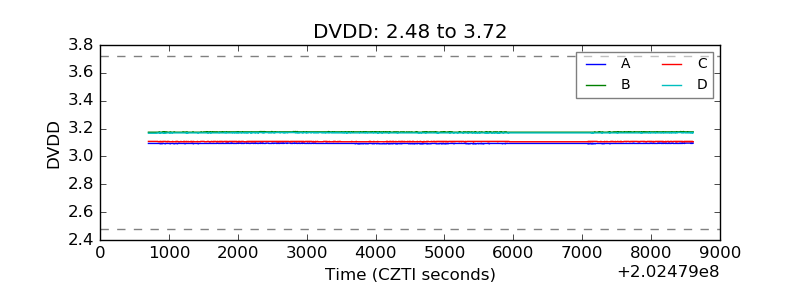 |
| Temperature 1 | 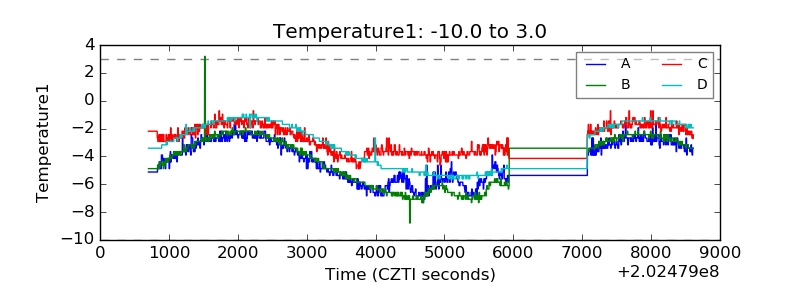 |
| Veto HV Monitor | 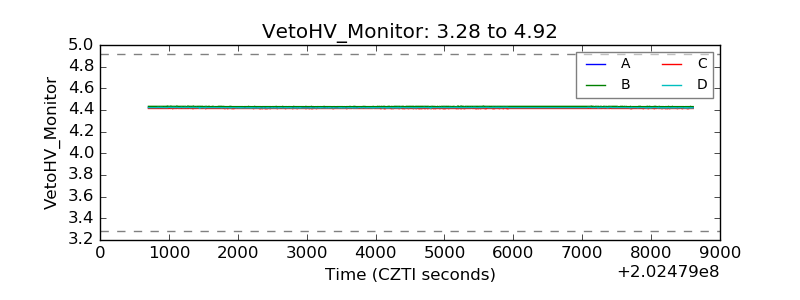 |
| Veto LLD | 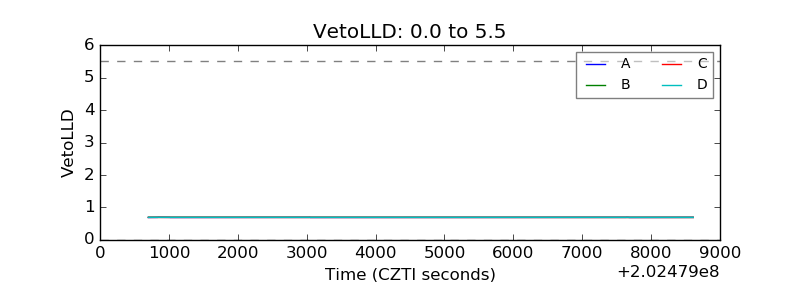 |
| Alpha Counter | 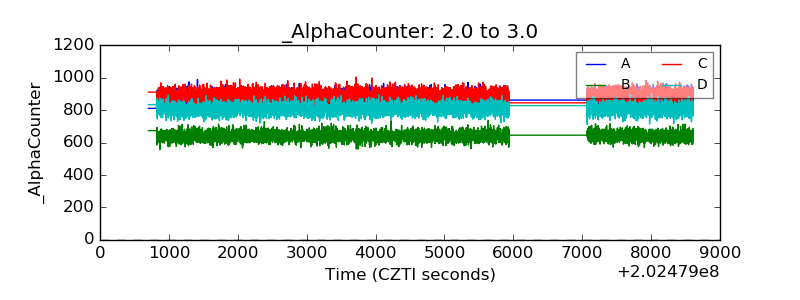 |
| _CPM_Rate | 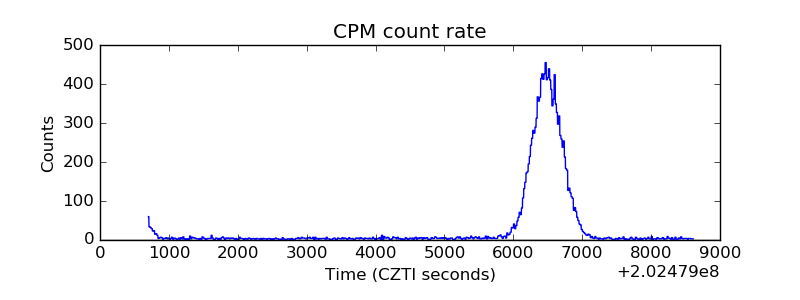 |
| CZT Counter | 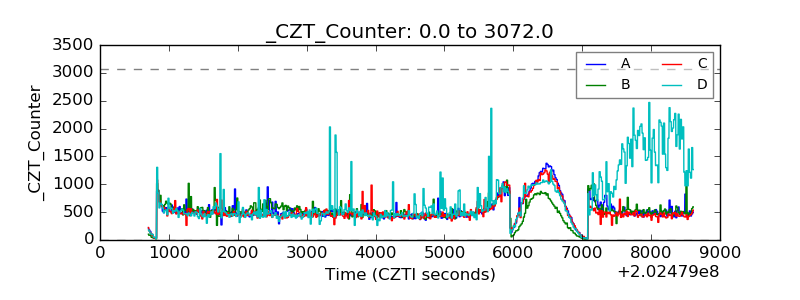 |
| +2.5 Volts monitor |  |
| +5 Volts monitor |  |
| Veto Counter | 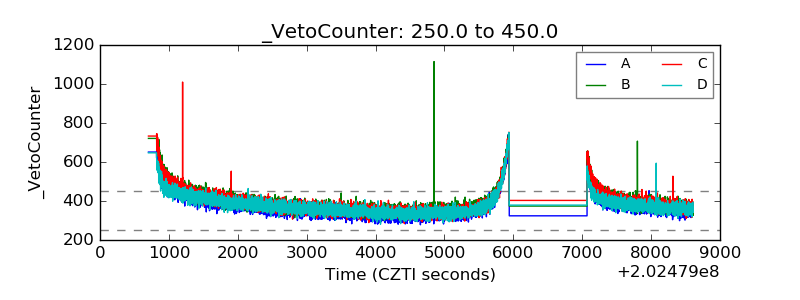 |