| Param | Original file | Final file |
|---|---|---|
| Filename | modeM0/AS1G05_191T01_9000000476_03664cztM0_level2.evt | modeM0/AS1G05_191T01_9000000476_03664cztM0_level2_quad_clean.evt |
| Size (bytes) | 520,951,680 | 78,238,080 |
| Size | 496.8 MB | 74.6 MB |
| Events in quadrant A | 3,373,423 | 484,768 |
| Events in quadrant B | 3,526,535 | 481,493 |
| Events in quadrant C | 3,235,531 | 475,787 |
| Events in quadrant D | 5,185,261 | 458,317 |
| Mode M0 | |||
|---|---|---|---|
| Quadrant | BADHDUFLAG | Total packets | Discarded packets |
| A | 0 | 14458 | 3 |
| B | 0 | 14562 | 2 |
| C | 0 | 14096 | 2 |
| D | 0 | 20103 | 2 |
| Mode SS | |||
|---|---|---|---|
| Quadrant | BADHDUFLAG | Total packets | Discarded packets |
| A | 0 | 136 | 0 |
| B | 0 | 136 | 0 |
| C | 0 | 136 | 0 |
| D | 0 | 136 | 0 |
| Mode M9 | |||
|---|---|---|---|
| Quadrant | BADHDUFLAG | Total packets | Discarded packets |
| A | 0 | 15 | 0 |
| B | 0 | 15 | 0 |
| C | 0 | 15 | 0 |
| D | 0 | 16 | 0 |
| Quadrant | Total seconds | Saturated seconds | Saturation percentage |
|---|---|---|---|
| A | 6726 | 114 | 1.694915% |
| B | 6726 | 115 | 1.709783% |
| C | 6726 | 88 | 1.308356% |
| D | 6726 | 371 | 5.515908% |
Noise dominated data is calculated using 1-second bins in cleaned event files. If a bin has >2000 counts, and if more than 50% of those come from <1% of pixels, then it is considered to be noise-dominated and hence unusable.
| Quadrant | # 1 sec bins | Bins with >0 counts | Bins with >2000 counts | High rate bins dominated by noise | Noise dominated (total time) | Noise dominated (detector-on time) | Marked lightcurve |
|---|---|---|---|---|---|---|---|
| A | 7681 | 6727 | 12 | 12 | 0.16% | 0.18% | 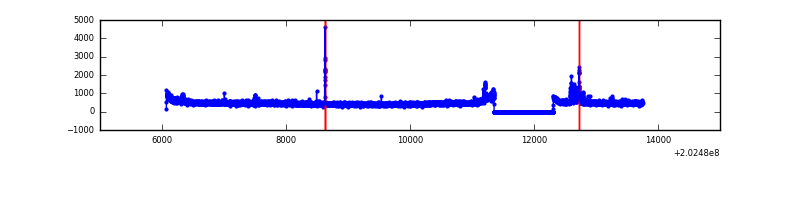 |
| B | 7681 | 6727 | 4 | 4 | 0.05% | 0.06% | 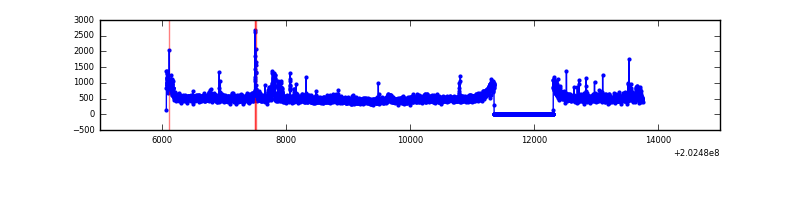 |
| C | 7681 | 6727 | 22 | 22 | 0.29% | 0.33% |  |
| D | 7681 | 6727 | 284 | 284 | 3.70% | 4.22% | 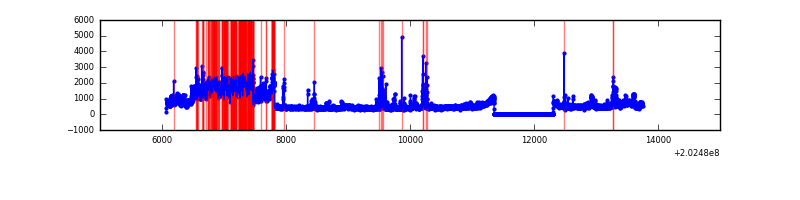 |
Top three noisy pixels from each quadrant. If the there are fewer than three noisy pixels in the level2.evt file, extra rows are filled as -1
| Pixel properties | Quadrant properties | ||||||
|---|---|---|---|---|---|---|---|
| Quadrant | DetID | PixID | Counts | Sigma | Mean | Median | Sigma |
| A | 13 | 164 | 129563 | 769.58 | 823 | 807 | 167.3 |
| A | 0 | 50 | 24288 | 140.35 | 823 | 807 | 167.3 |
| A | 8 | 4 | 18226 | 104.11 | 823 | 807 | 167.3 |
| B | 0 | 182 | 85277 | 525.36 | 832 | 813 | 160.8 |
| B | 15 | 204 | 82562 | 508.47 | 832 | 813 | 160.8 |
| B | 4 | 81 | 54885 | 336.32 | 832 | 813 | 160.8 |
| C | 9 | 247 | 101153 | 541.8 | 797 | 801 | 185.2 |
| C | 12 | 4 | 13663 | 69.44 | 797 | 801 | 185.2 |
| C | 13 | 61 | 6708 | 31.89 | 797 | 801 | 185.2 |
| D | 13 | 172 | 1849514 | 9671.17 | 791 | 769 | 191.2 |
| D | 13 | 223 | 99513 | 516.55 | 791 | 769 | 191.2 |
| D | 12 | 110 | 62292 | 321.84 | 791 | 769 | 191.2 |
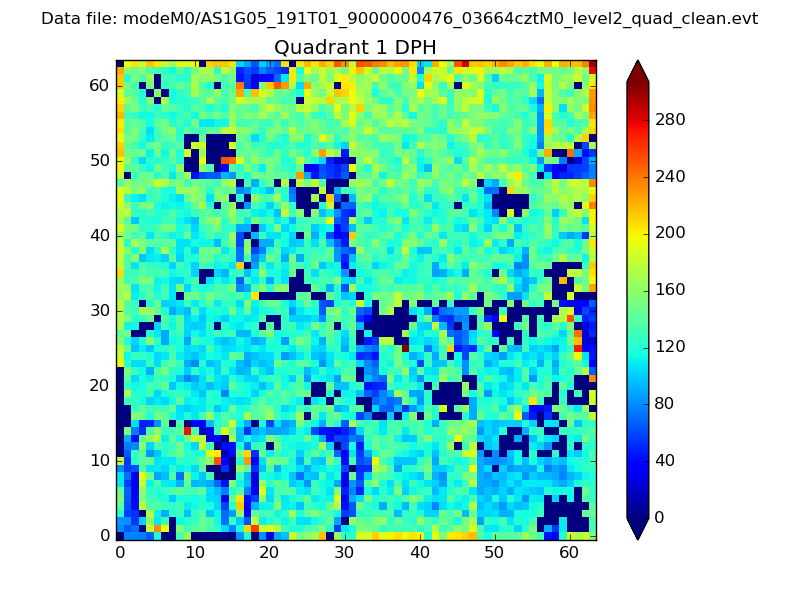
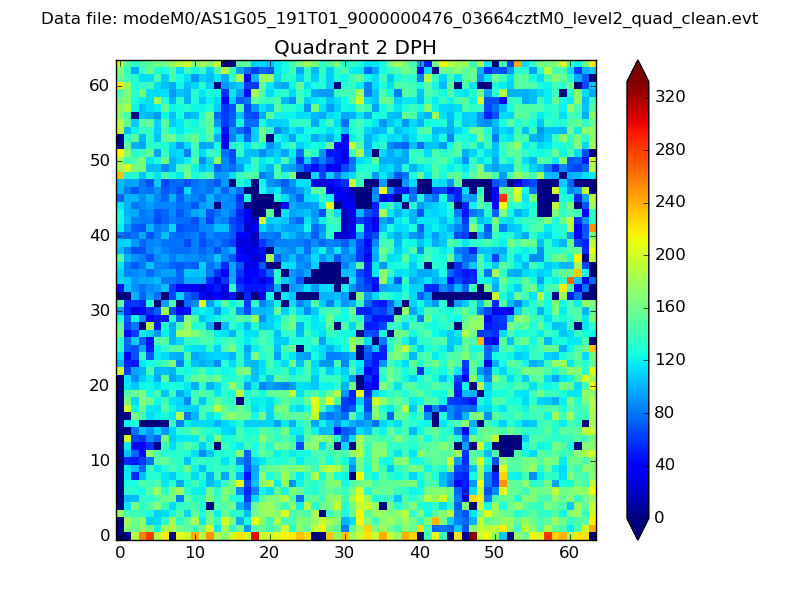
Histogram calculated using DETX and DETY for each event in the final _common_clean file
| Quadrant A | 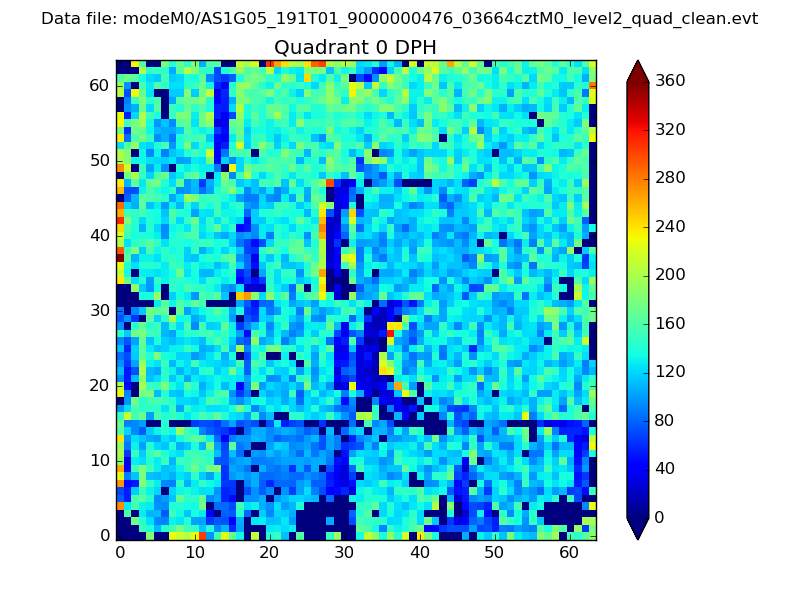 |
 |
Quadrant B |
|---|---|---|---|
| Quadrant D |  |
 |
Quadrant C |
| Plot type | Count rate plots | Images |
|---|---|---|
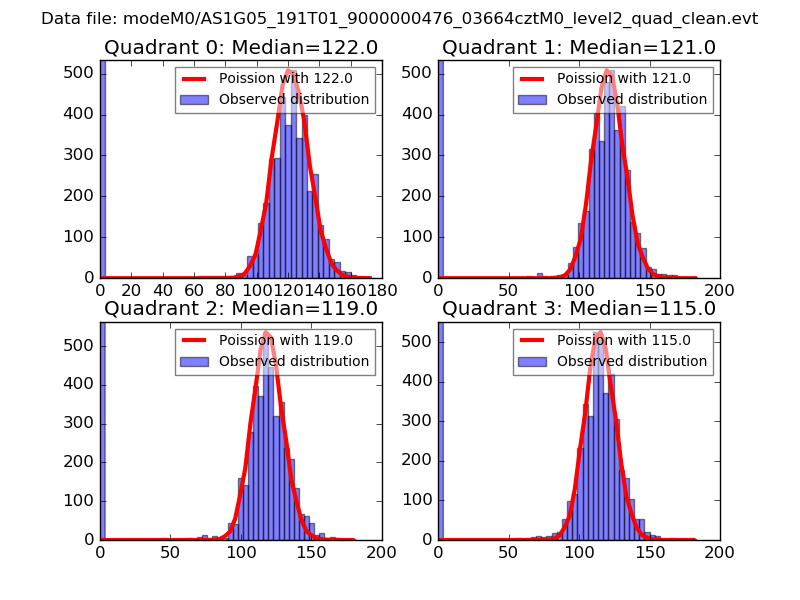
| Comparison with Poisson distribution Blue bars denote a histogram of data divided into 1 sec bins. Red curve is a Poisson curve with rate = median count rate of data. |
 |
 |
| Quadrant-wise count rates Data is divided into 100 sec bins |
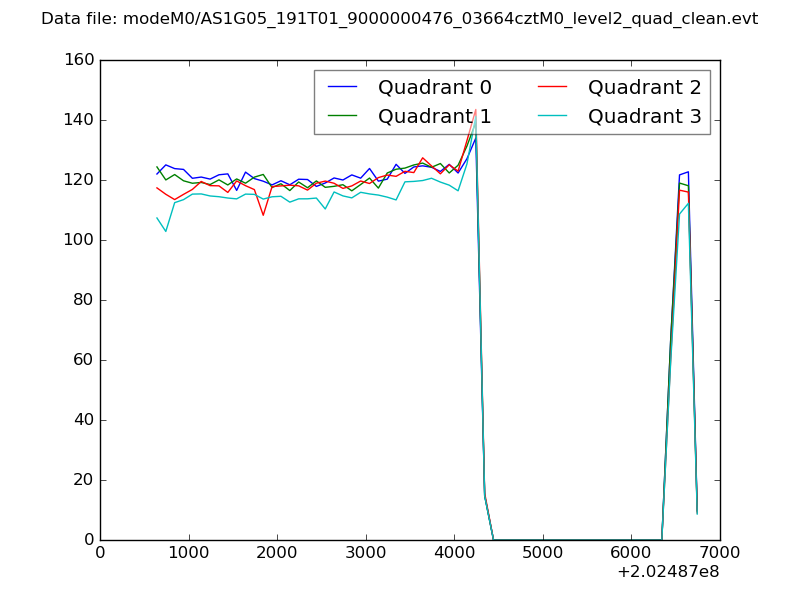 |
|
| Module-wise count rates for Quadrant A Data is divided into 100 sec bins |
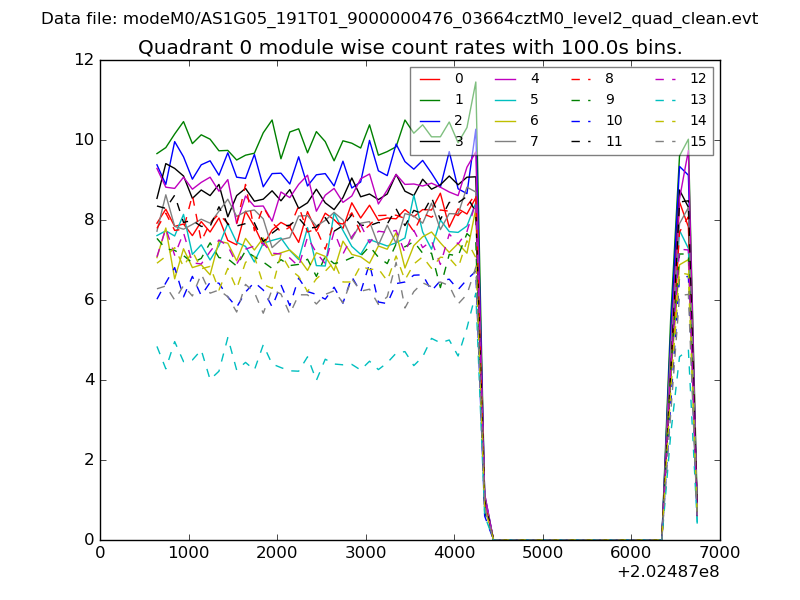 |
 |
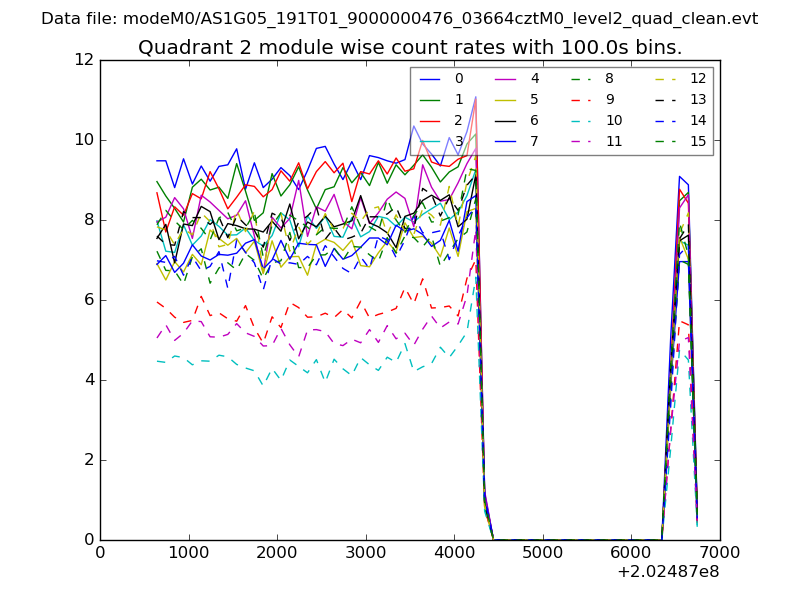
| Module-wise count rates for Quadrant B Data is divided into 100 sec bins |
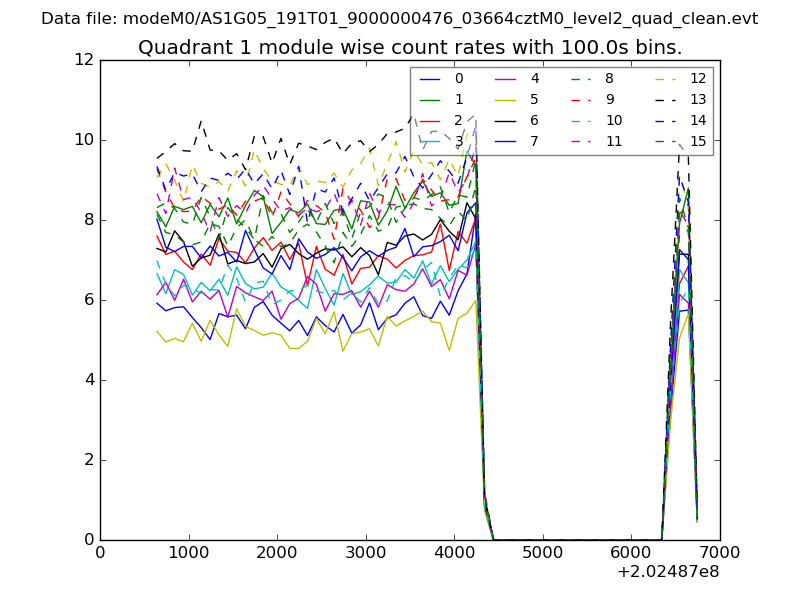 |
 |
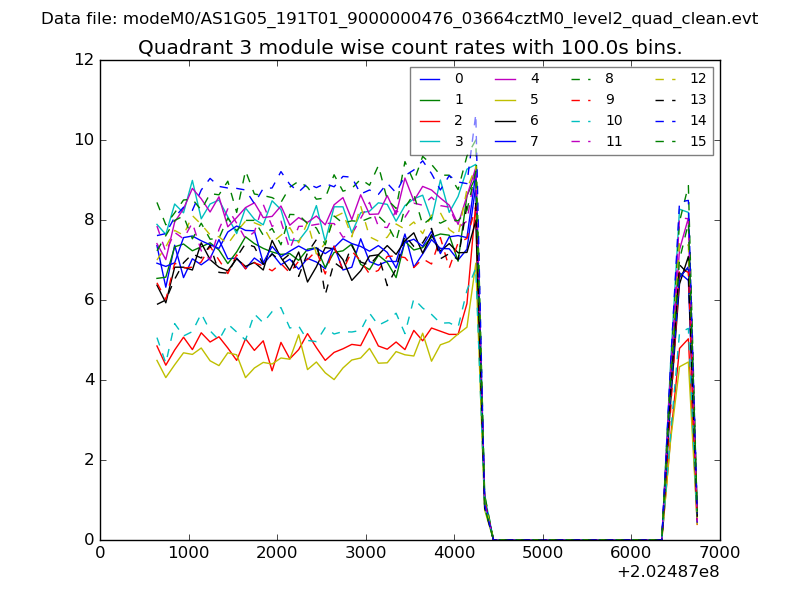
| Module-wise count rates for Quadrant C Data is divided into 100 sec bins |
 |
 |
| Module-wise count rates for Quadrant D Data is divided into 100 sec bins |
 |
 |
| Parameter | Plot |
|---|---|
| CZT HV Monitor | 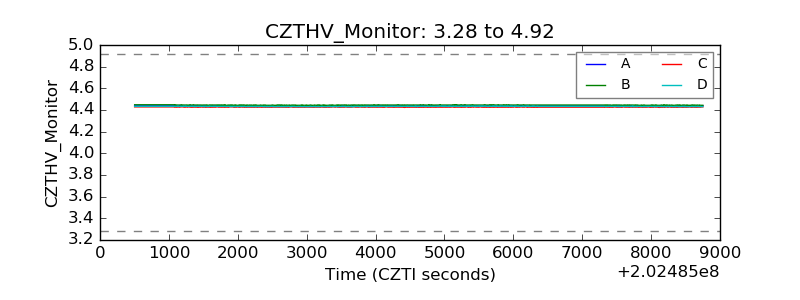 |
| D_VDD | 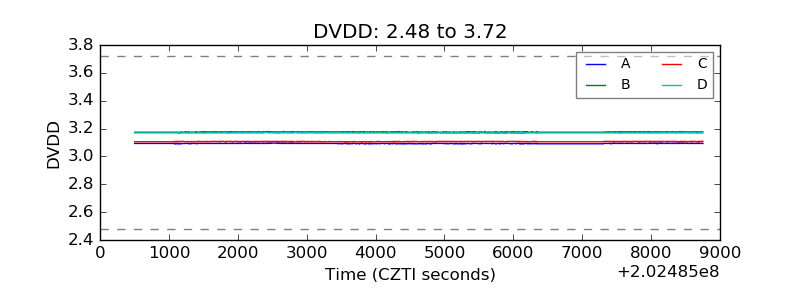 |
| Temperature 1 | 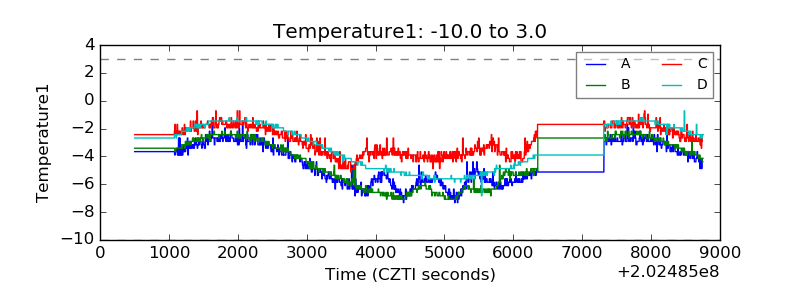 |
| Veto HV Monitor | 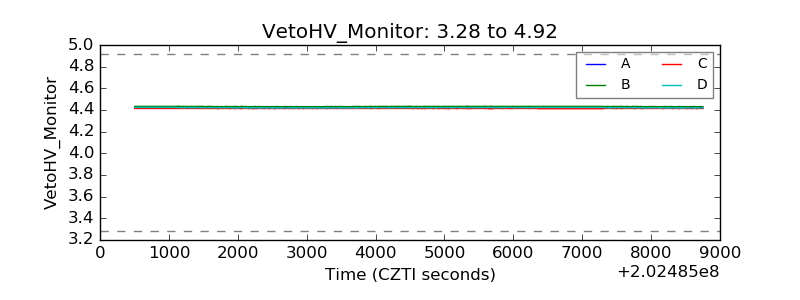 |
| Veto LLD | 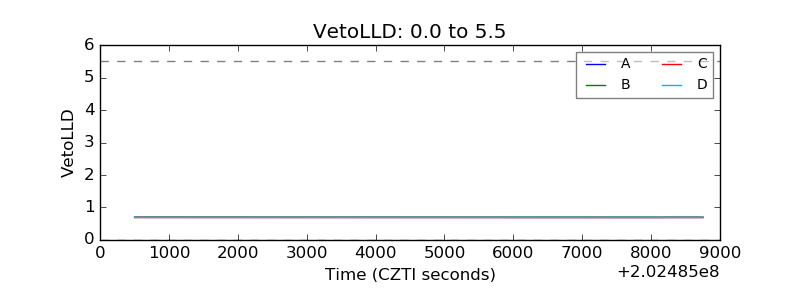 |
| Alpha Counter | 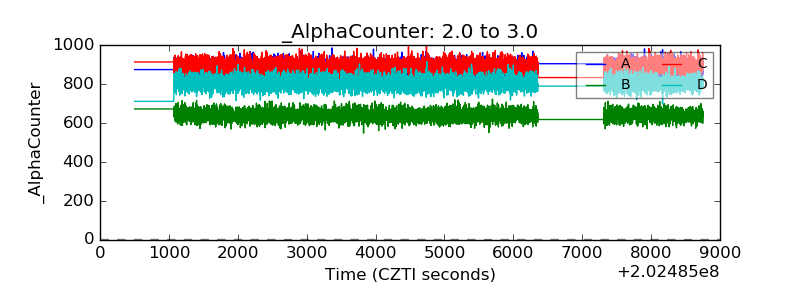 |
| _CPM_Rate | 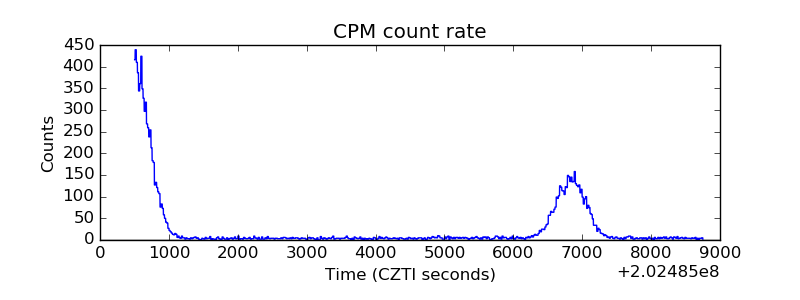 |
| CZT Counter | 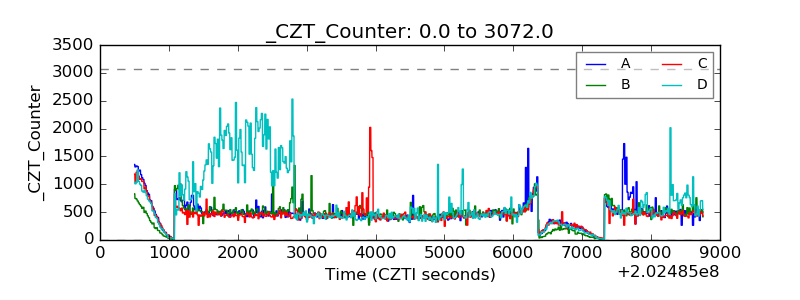 |
| +2.5 Volts monitor |  |
| +5 Volts monitor |  |
| Veto Counter | 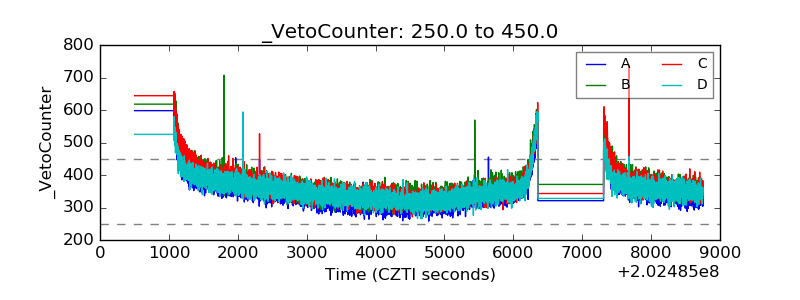 |