| Param | Original file | Final file |
|---|---|---|
| Filename | modeM0/AS1G05_191T01_9000000476_03665cztM0_level2.evt | modeM0/AS1G05_191T01_9000000476_03665cztM0_level2_quad_clean.evt |
| Size (bytes) | 521,386,560 | 90,403,200 |
| Size | 497.2 MB | 86.2 MB |
| Events in quadrant A | 3,892,480 | 566,357 |
| Events in quadrant B | 3,874,434 | 562,495 |
| Events in quadrant C | 3,453,524 | 555,725 |
| Events in quadrant D | 4,068,410 | 539,181 |
| Mode M0 | |||
|---|---|---|---|
| Quadrant | BADHDUFLAG | Total packets | Discarded packets |
| A | 0 | 16323 | 3 |
| B | 0 | 16276 | 2 |
| C | 0 | 15302 | 2 |
| D | 0 | 17282 | 2 |
| Mode SS | |||
|---|---|---|---|
| Quadrant | BADHDUFLAG | Total packets | Discarded packets |
| A | 0 | 150 | 0 |
| B | 0 | 150 | 0 |
| C | 0 | 150 | 0 |
| D | 0 | 150 | 0 |
| Mode M9 | |||
|---|---|---|---|
| Quadrant | BADHDUFLAG | Total packets | Discarded packets |
| A | 0 | 16 | 0 |
| B | 0 | 16 | 0 |
| C | 0 | 16 | 0 |
| D | 0 | 16 | 0 |
| Quadrant | Total seconds | Saturated seconds | Saturation percentage |
|---|---|---|---|
| A | 7389 | 148 | 2.002977% |
| B | 7389 | 194 | 2.625524% |
| C | 7389 | 98 | 1.326296% |
| D | 7389 | 141 | 1.908242% |
Noise dominated data is calculated using 1-second bins in cleaned event files. If a bin has >2000 counts, and if more than 50% of those come from <1% of pixels, then it is considered to be noise-dominated and hence unusable.
| Quadrant | # 1 sec bins | Bins with >0 counts | Bins with >2000 counts | High rate bins dominated by noise | Noise dominated (total time) | Noise dominated (detector-on time) | Marked lightcurve |
|---|---|---|---|---|---|---|---|
| A | 8949 | 7391 | 7 | 7 | 0.08% | 0.09% | 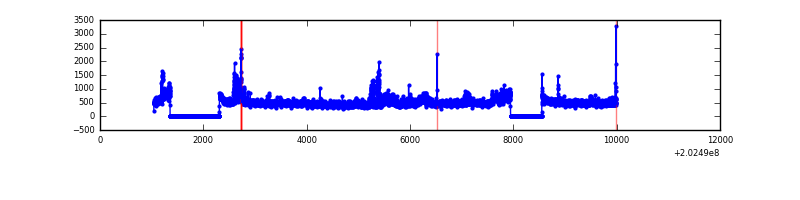 |
| B | 8949 | 7391 | 26 | 26 | 0.29% | 0.35% | 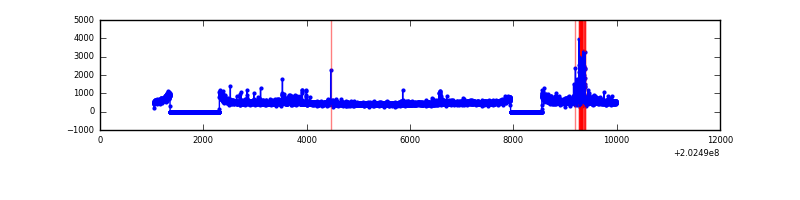 |
| C | 8949 | 7391 | 1 | 1 | 0.01% | 0.01% |  |
| D | 8949 | 7391 | 32 | 32 | 0.36% | 0.43% |  |
Top three noisy pixels from each quadrant. If the there are fewer than three noisy pixels in the level2.evt file, extra rows are filled as -1
| Pixel properties | Quadrant properties | ||||||
|---|---|---|---|---|---|---|---|
| Quadrant | DetID | PixID | Counts | Sigma | Mean | Median | Sigma |
| A | 13 | 164 | 308313 | 1672.98 | 902 | 882 | 183.8 |
| A | 13 | 251 | 53394 | 285.76 | 902 | 882 | 183.8 |
| A | 8 | 4 | 20060 | 104.36 | 902 | 882 | 183.8 |
| B | 4 | 81 | 229965 | 1314.36 | 909 | 891 | 174.3 |
| B | 15 | 204 | 37947 | 212.62 | 909 | 891 | 174.3 |
| B | 0 | 182 | 22184 | 122.17 | 909 | 891 | 174.3 |
| C | 9 | 247 | 26631 | 125.93 | 875 | 879 | 204.5 |
| C | 13 | 61 | 7420 | 31.99 | 875 | 879 | 204.5 |
| C | 7 | 234 | 3333 | 12.0 | 875 | 879 | 204.5 |
| D | 13 | 172 | 479927 | 2277.63 | 871 | 847 | 210.3 |
| D | 13 | 223 | 148404 | 701.51 | 871 | 847 | 210.3 |
| D | 13 | 239 | 57186 | 267.85 | 871 | 847 | 210.3 |
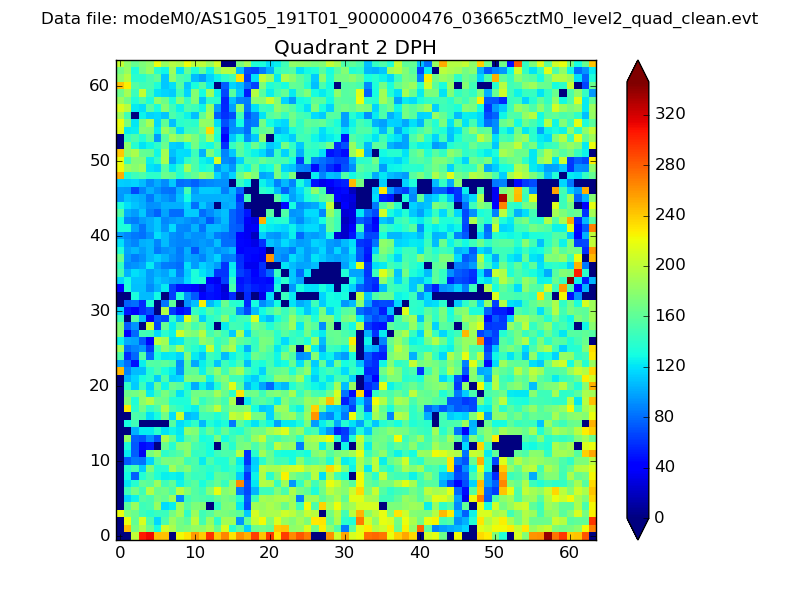
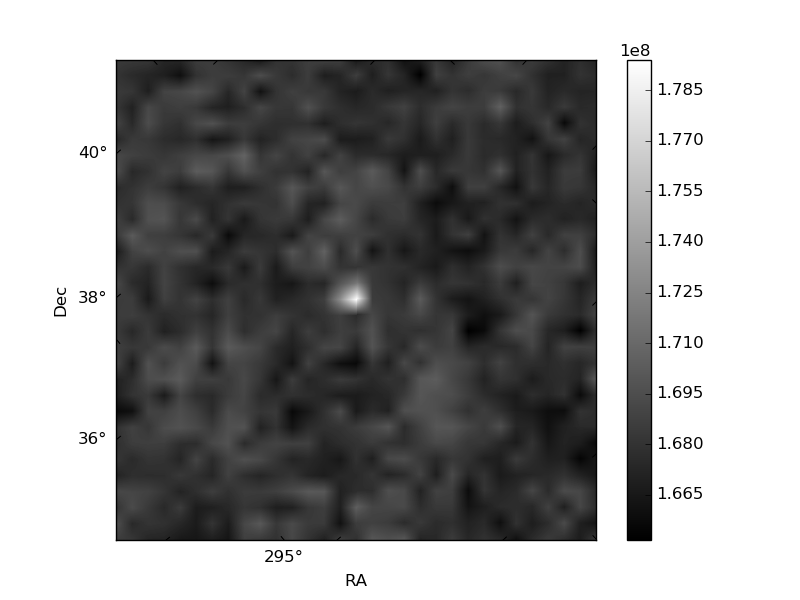
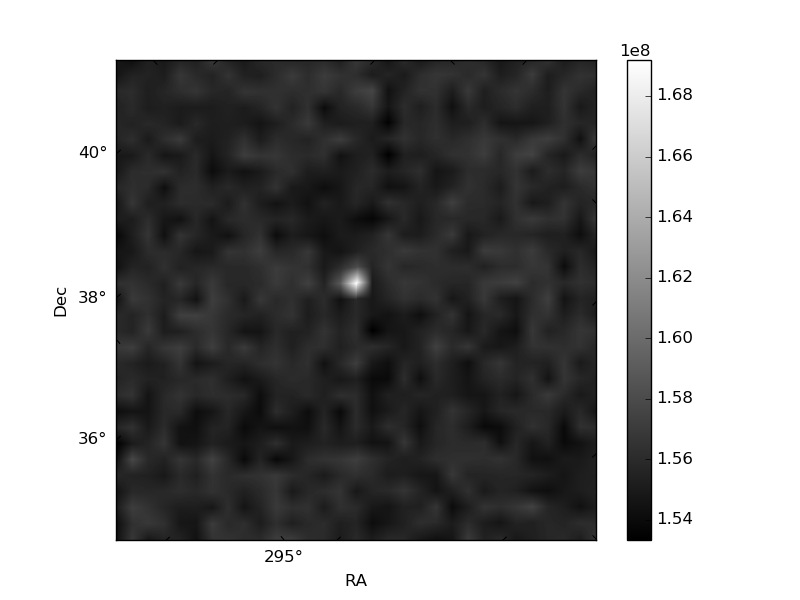
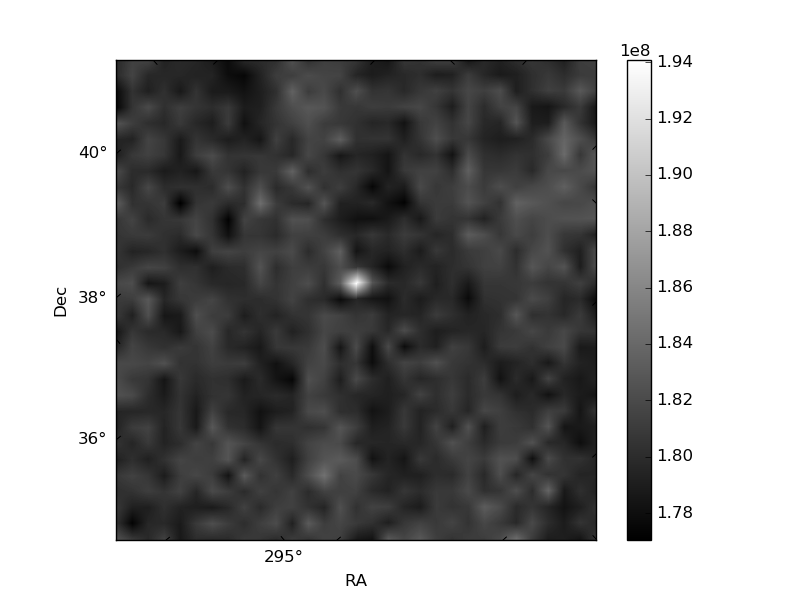
Histogram calculated using DETX and DETY for each event in the final _common_clean file
| Quadrant A | 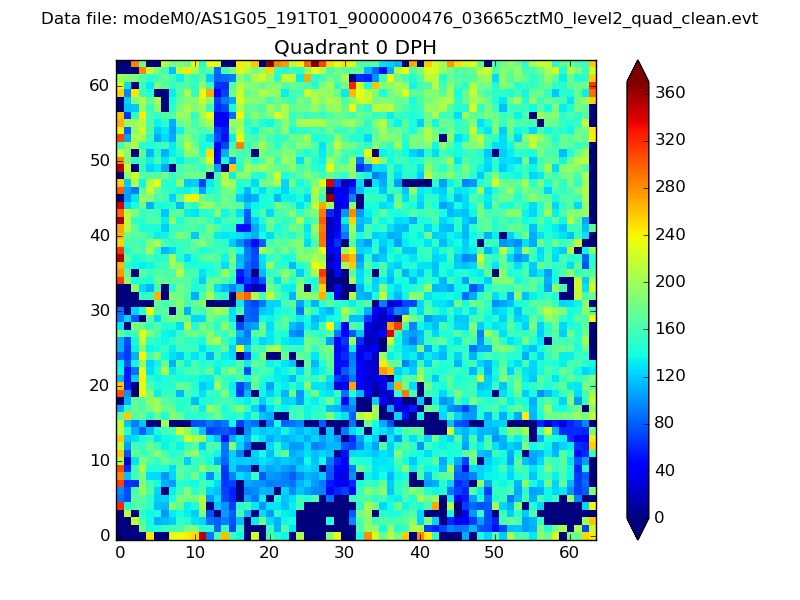 |
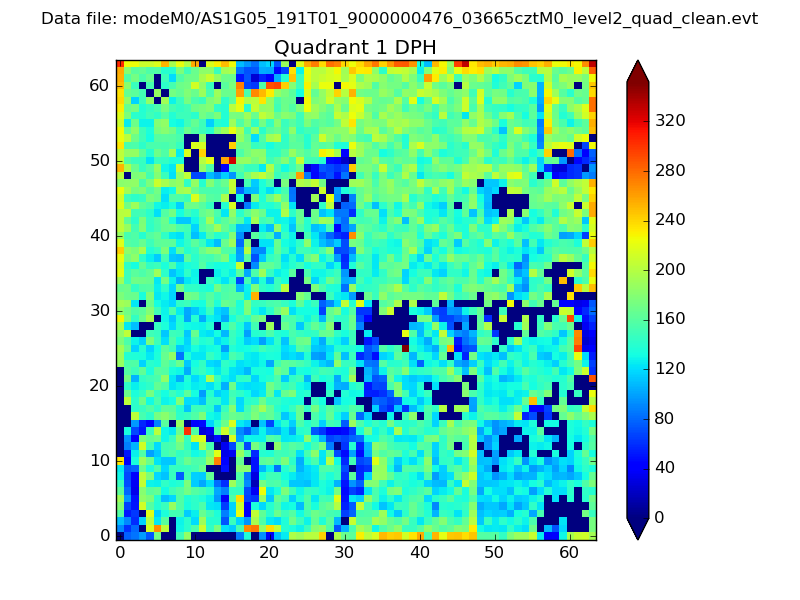 |
Quadrant B |
|---|---|---|---|
| Quadrant D | 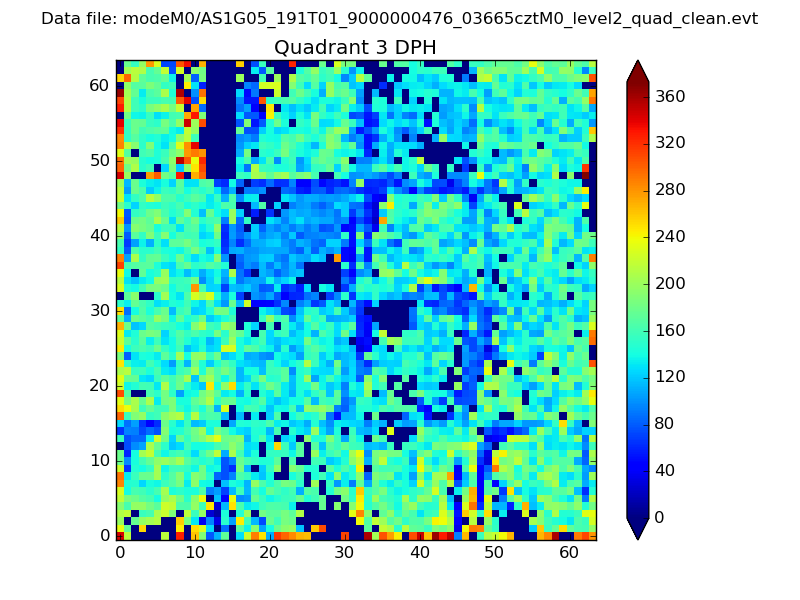 |
 |
Quadrant C |
| Plot type | Count rate plots | Images |
|---|---|---|
| Comparison with Poisson distribution Blue bars denote a histogram of data divided into 1 sec bins. Red curve is a Poisson curve with rate = median count rate of data. |
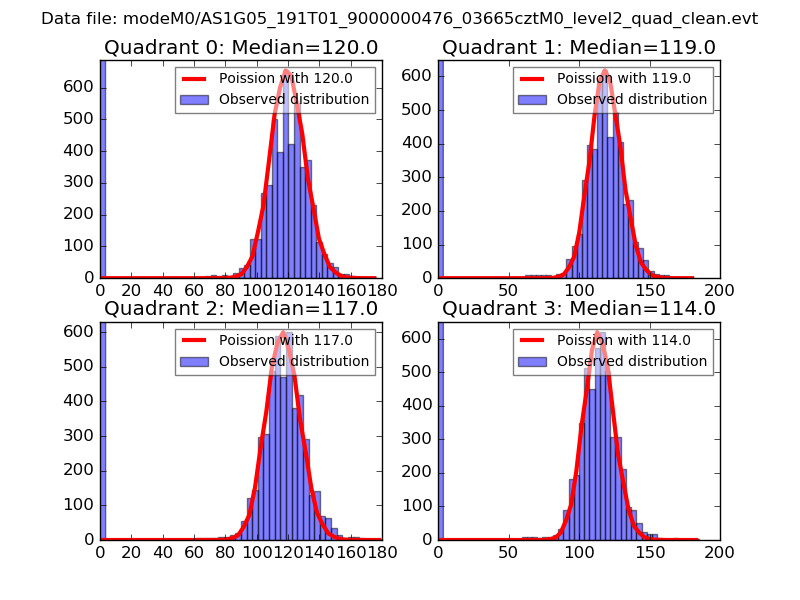 |
 |
| Quadrant-wise count rates Data is divided into 100 sec bins |
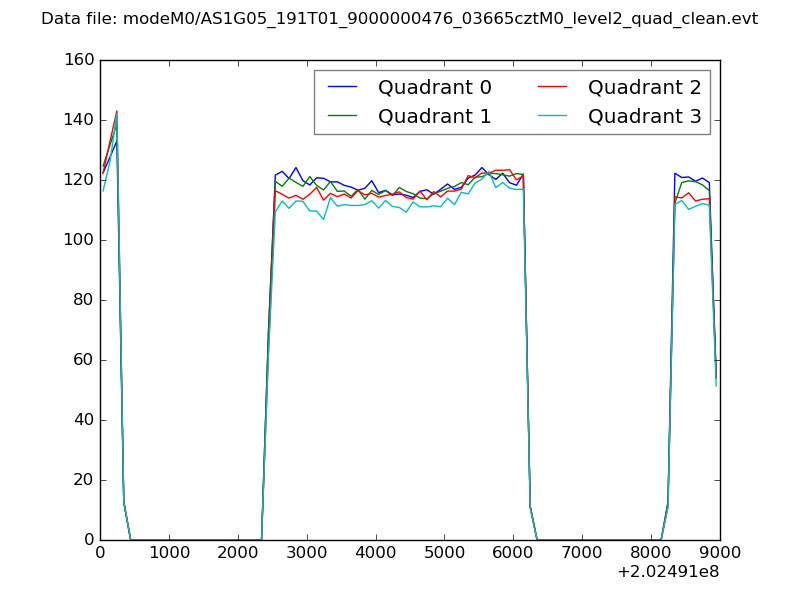 |
|
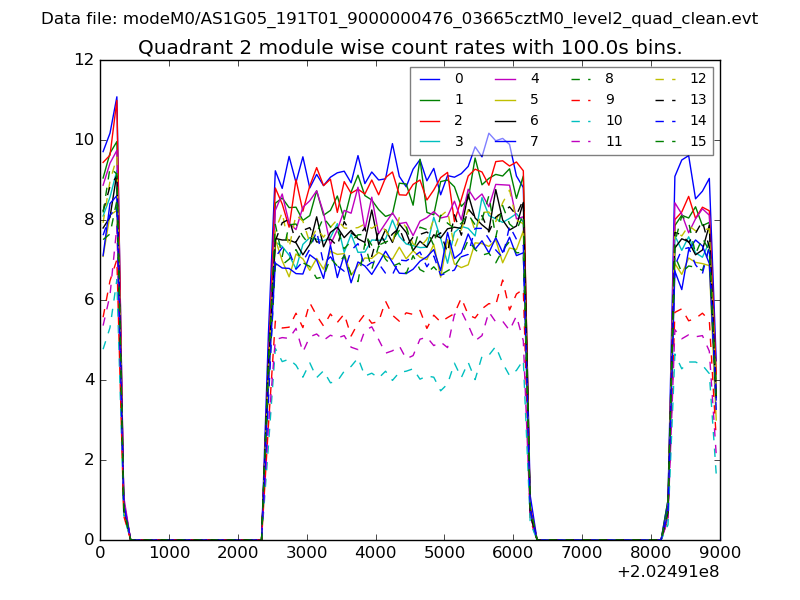
| Module-wise count rates for Quadrant A Data is divided into 100 sec bins |
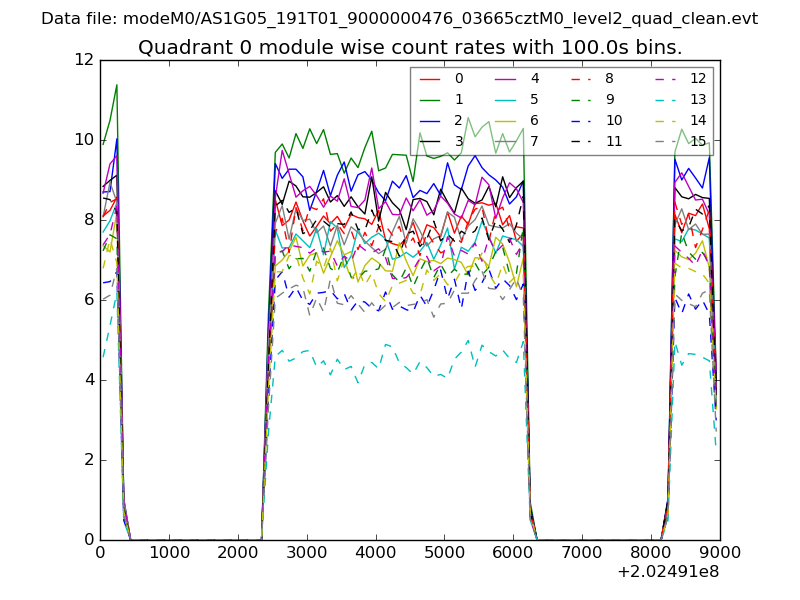 |
 |
| Module-wise count rates for Quadrant B Data is divided into 100 sec bins |
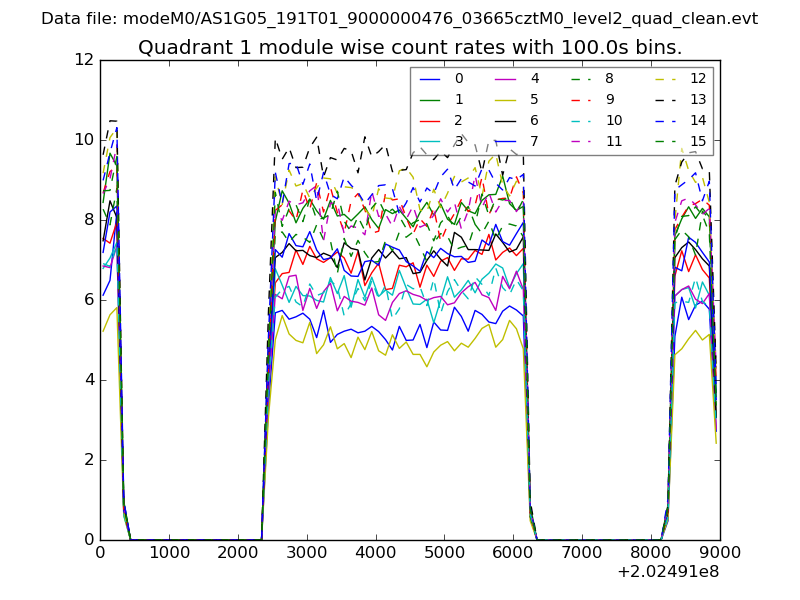 |
 |
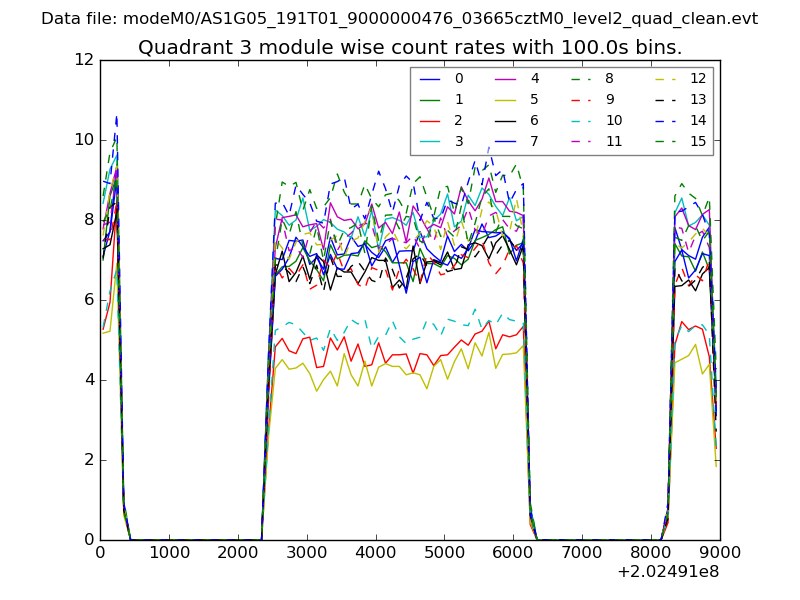
| Module-wise count rates for Quadrant C Data is divided into 100 sec bins |
 |
 |
| Module-wise count rates for Quadrant D Data is divided into 100 sec bins |
 |
 |
| Parameter | Plot |
|---|---|
| CZT HV Monitor | 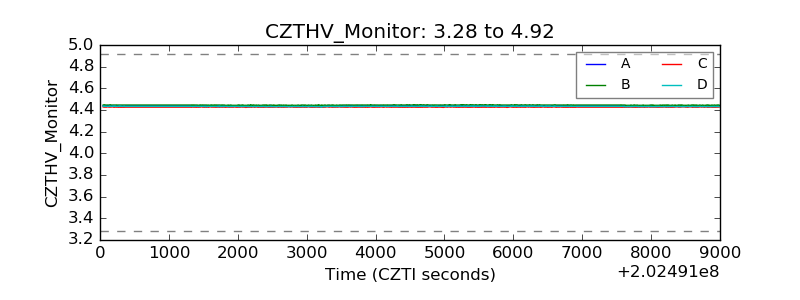 |
| D_VDD | 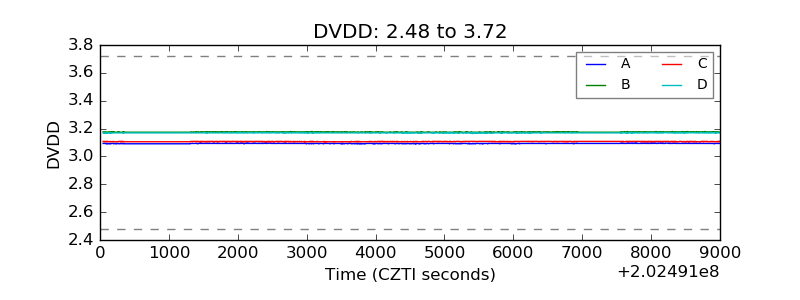 |
| Temperature 1 | 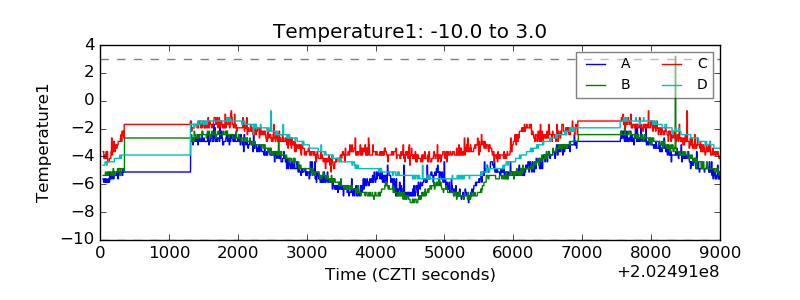 |
| Veto HV Monitor | 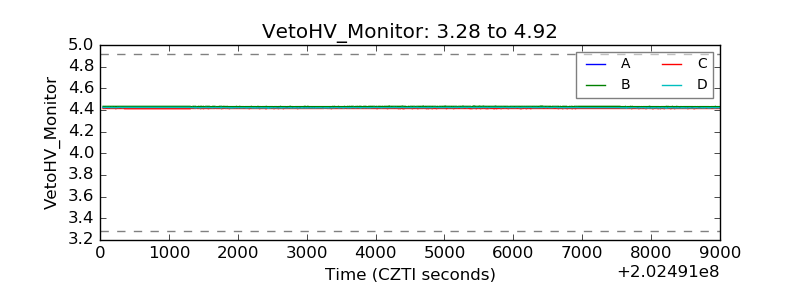 |
| Veto LLD | 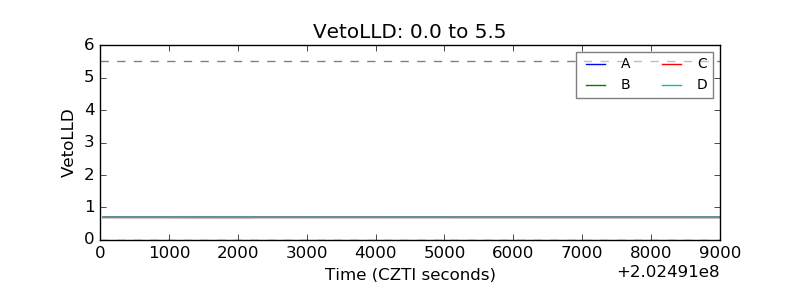 |
| Alpha Counter | 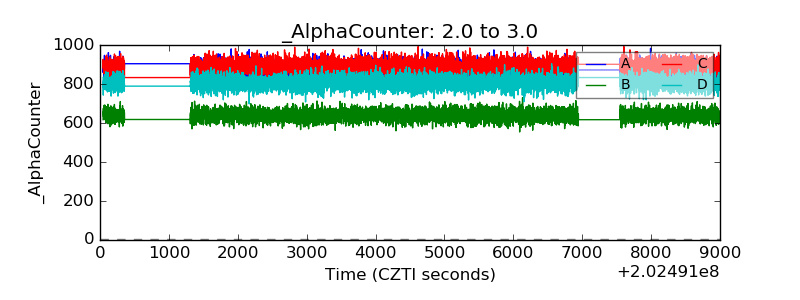 |
| _CPM_Rate | 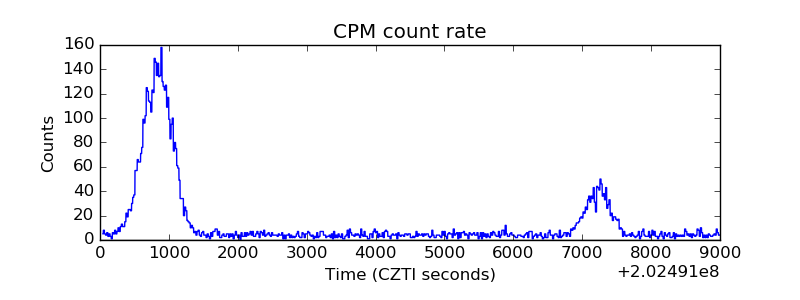 |
| CZT Counter | 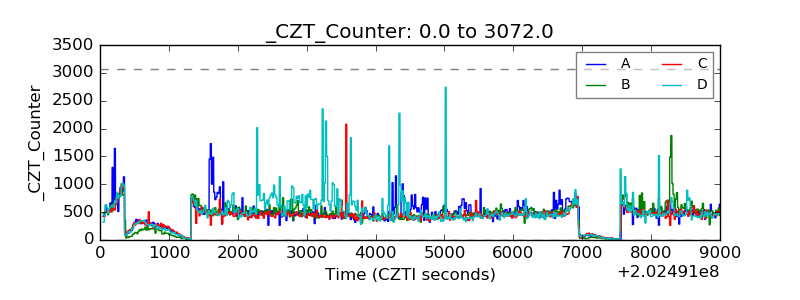 |
| +2.5 Volts monitor |  |
| +5 Volts monitor | 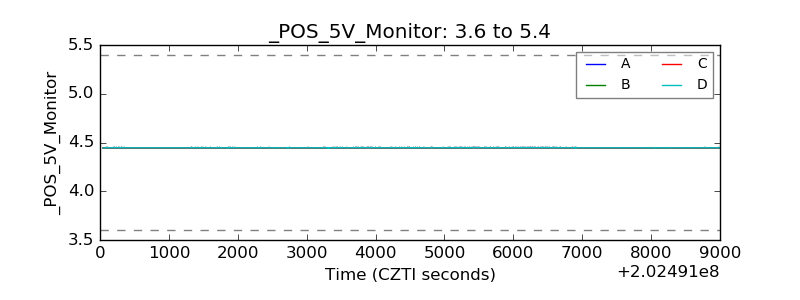 |
| Veto Counter | 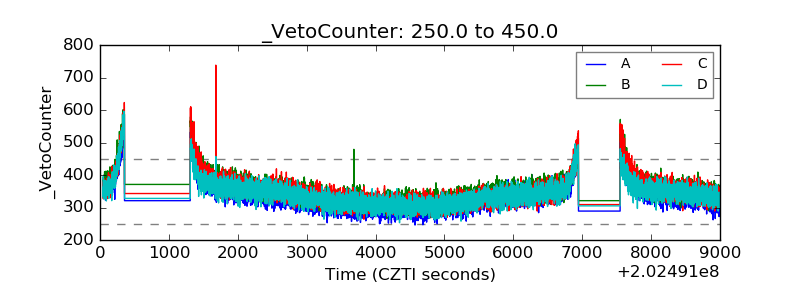 |