| Param | Original file | Final file |
|---|---|---|
| Filename | modeM0/AS1G05_191T01_9000000476_03666cztM0_level2.evt | modeM0/AS1G05_191T01_9000000476_03666cztM0_level2_quad_clean.evt |
| Size (bytes) | 560,597,760 | 93,343,680 |
| Size | 534.6 MB | 89.0 MB |
| Events in quadrant A | 4,728,834 | 579,506 |
| Events in quadrant B | 4,310,069 | 577,194 |
| Events in quadrant C | 3,668,108 | 573,226 |
| Events in quadrant D | 3,741,576 | 554,357 |
| Mode M0 | |||
|---|---|---|---|
| Quadrant | BADHDUFLAG | Total packets | Discarded packets |
| A | 0 | 19103 | 3 |
| B | 0 | 17919 | 2 |
| C | 0 | 16262 | 2 |
| D | 0 | 16784 | 2 |
| Mode SS | |||
|---|---|---|---|
| Quadrant | BADHDUFLAG | Total packets | Discarded packets |
| A | 0 | 160 | 0 |
| B | 0 | 160 | 0 |
| C | 0 | 160 | 0 |
| D | 0 | 160 | 0 |
| Mode M9 | |||
|---|---|---|---|
| Quadrant | BADHDUFLAG | Total packets | Discarded packets |
| A | 0 | 9 | 0 |
| B | 0 | 9 | 0 |
| C | 0 | 9 | 0 |
| D | 0 | 9 | 0 |
| Quadrant | Total seconds | Saturated seconds | Saturation percentage |
|---|---|---|---|
| A | 7800 | 108 | 1.384615% |
| B | 7800 | 184 | 2.358974% |
| C | 7800 | 70 | 0.897436% |
| D | 7800 | 85 | 1.089744% |
Noise dominated data is calculated using 1-second bins in cleaned event files. If a bin has >2000 counts, and if more than 50% of those come from <1% of pixels, then it is considered to be noise-dominated and hence unusable.
| Quadrant | # 1 sec bins | Bins with >0 counts | Bins with >2000 counts | High rate bins dominated by noise | Noise dominated (total time) | Noise dominated (detector-on time) | Marked lightcurve |
|---|---|---|---|---|---|---|---|
| A | 8730 | 7802 | 37 | 37 | 0.42% | 0.47% |  |
| B | 8730 | 7802 | 26 | 26 | 0.30% | 0.33% | 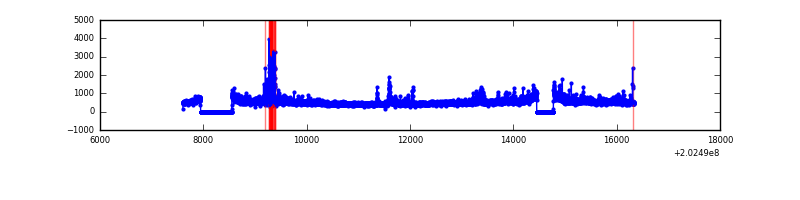 |
| C | 8730 | 7802 | 9 | 9 | 0.10% | 0.12% |  |
| D | 8730 | 7802 | 26 | 26 | 0.30% | 0.33% | 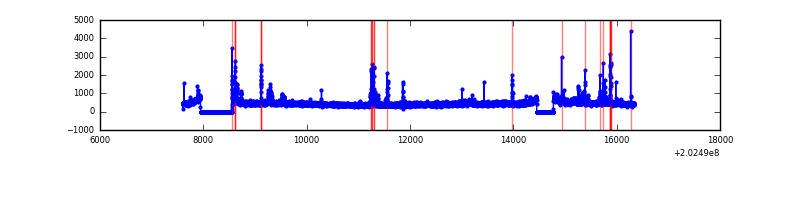 |
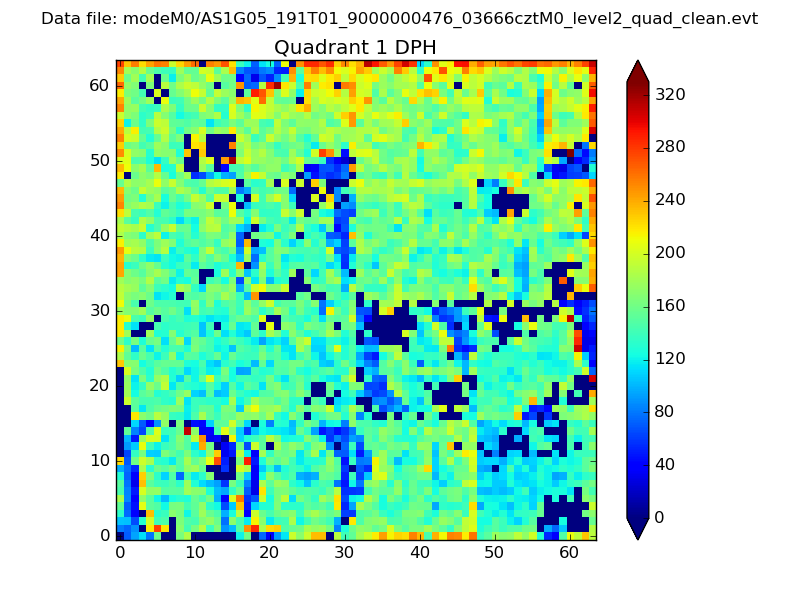
Top three noisy pixels from each quadrant. If the there are fewer than three noisy pixels in the level2.evt file, extra rows are filled as -1
| Pixel properties | Quadrant properties | ||||||
|---|---|---|---|---|---|---|---|
| Quadrant | DetID | PixID | Counts | Sigma | Mean | Median | Sigma |
| A | 13 | 251 | 556417 | 2885.55 | 941 | 919 | 192.5 |
| A | 13 | 164 | 474188 | 2458.41 | 941 | 919 | 192.5 |
| A | 8 | 15 | 34610 | 175.01 | 941 | 919 | 192.5 |
| B | 4 | 81 | 285374 | 1554.95 | 949 | 929 | 182.9 |
| B | 15 | 204 | 224501 | 1222.18 | 949 | 929 | 182.9 |
| B | 14 | 167 | 62830 | 338.39 | 949 | 929 | 182.9 |
| C | 9 | 247 | 61851 | 285.95 | 913 | 917 | 213.1 |
| C | 7 | 220 | 22341 | 100.54 | 913 | 917 | 213.1 |
| C | 1 | 16 | 11774 | 50.95 | 913 | 917 | 213.1 |
| D | 13 | 223 | 147018 | 663.36 | 909 | 883 | 220.3 |
| D | 13 | 239 | 51012 | 227.55 | 909 | 883 | 220.3 |
| D | 13 | 137 | 44099 | 196.17 | 909 | 883 | 220.3 |
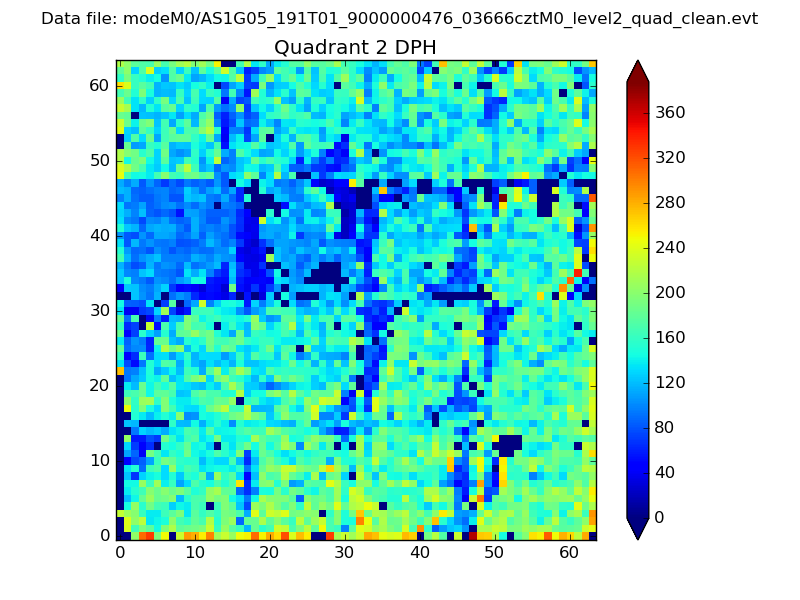
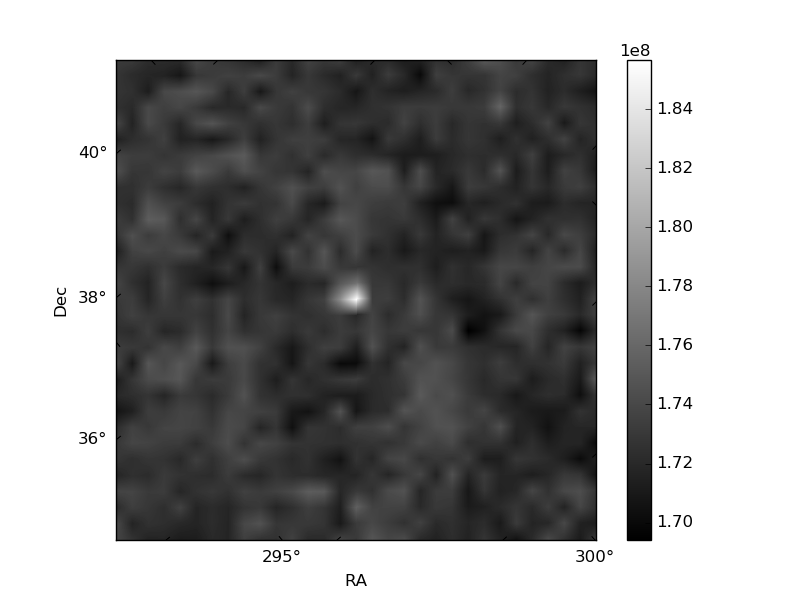
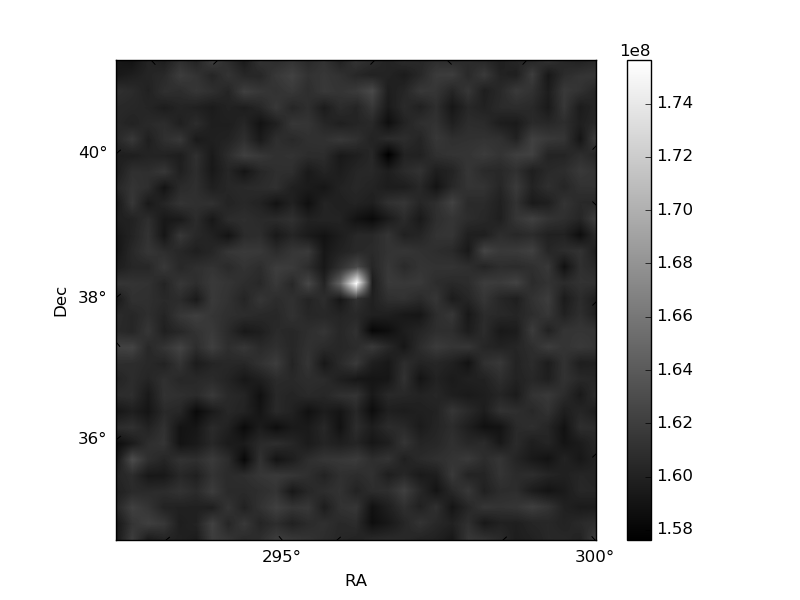
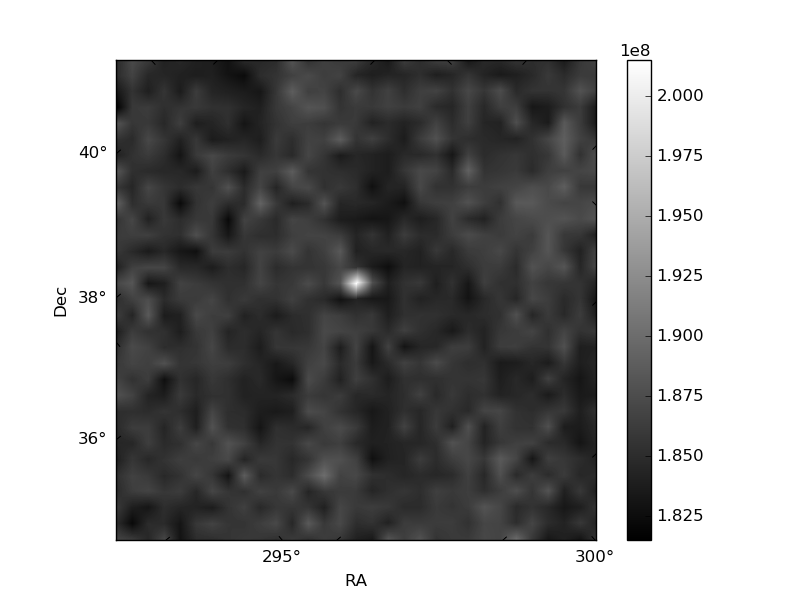
Histogram calculated using DETX and DETY for each event in the final _common_clean file
| Quadrant A | 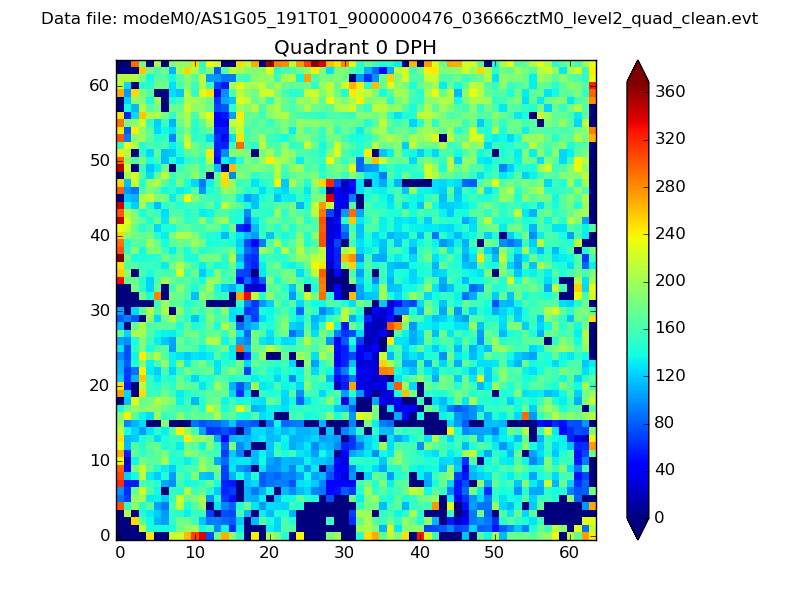 |
 |
Quadrant B |
|---|---|---|---|
| Quadrant D | 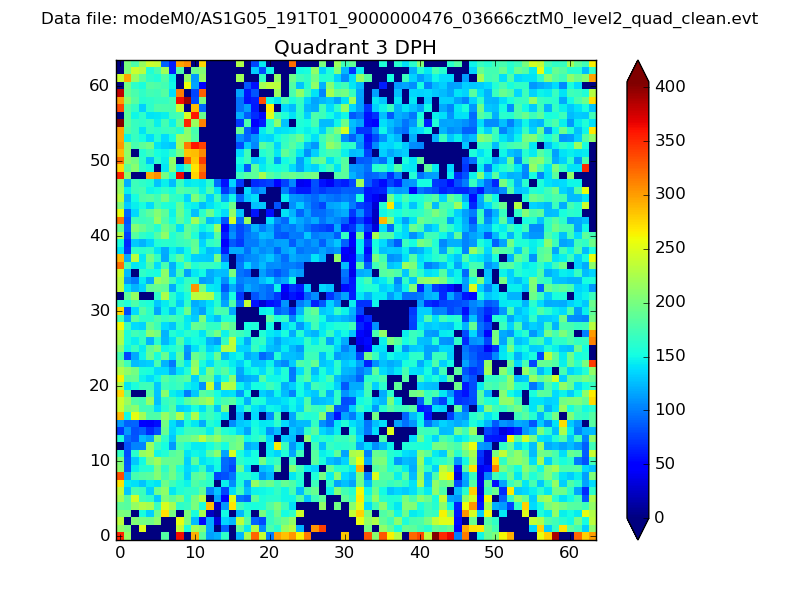 |
 |
Quadrant C |
| Plot type | Count rate plots | Images |
|---|---|---|
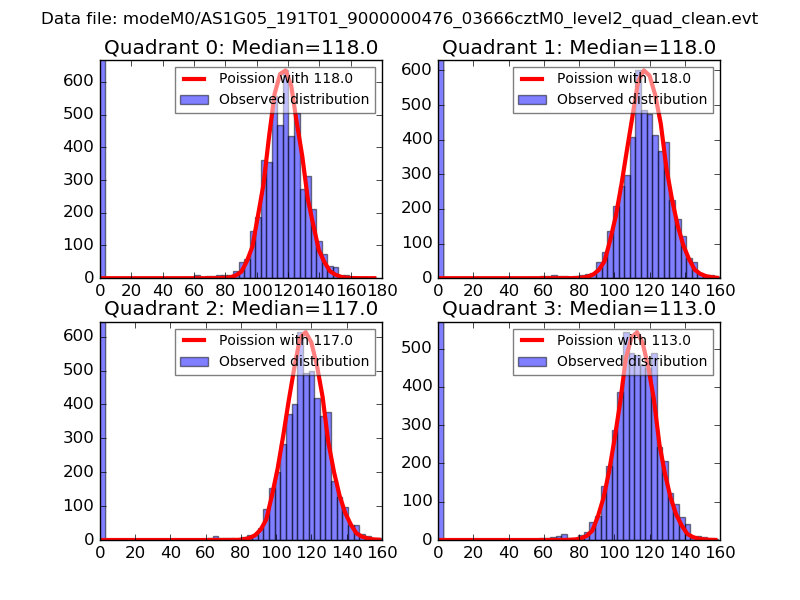
| Comparison with Poisson distribution Blue bars denote a histogram of data divided into 1 sec bins. Red curve is a Poisson curve with rate = median count rate of data. |
 |
 |
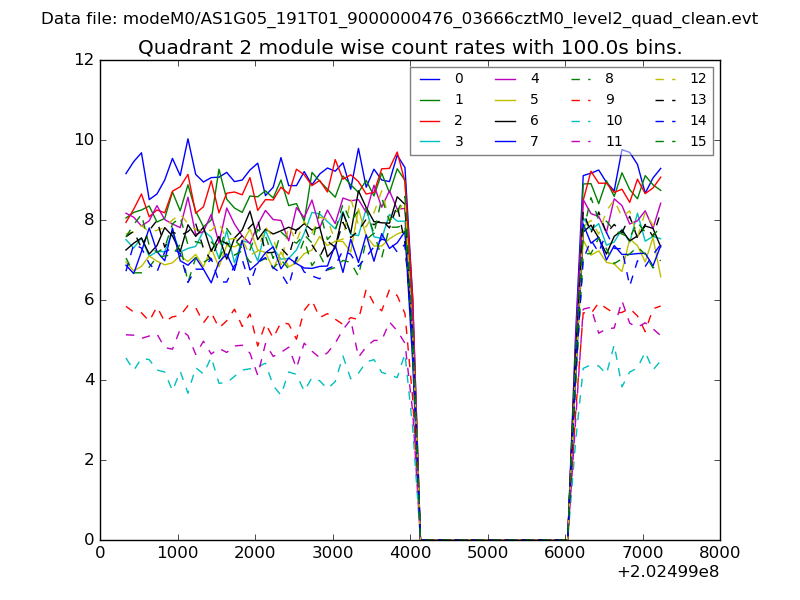
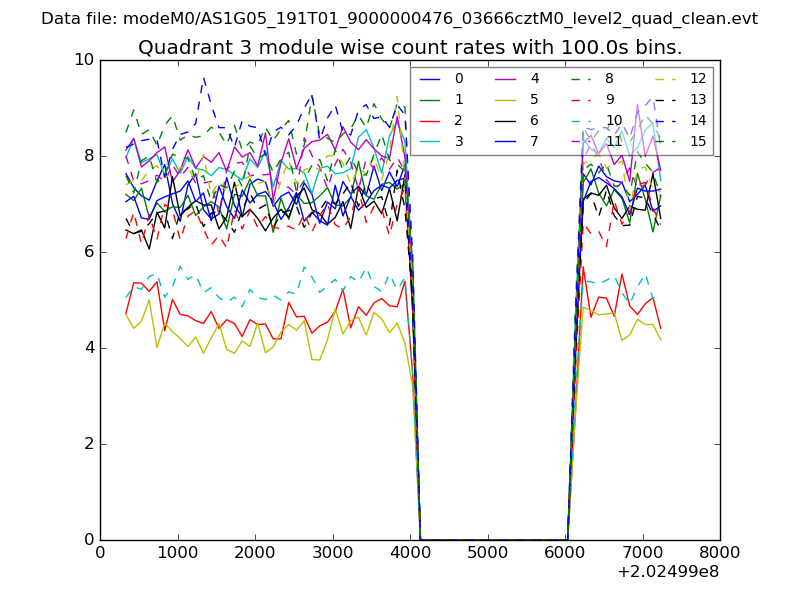
| Quadrant-wise count rates Data is divided into 100 sec bins |
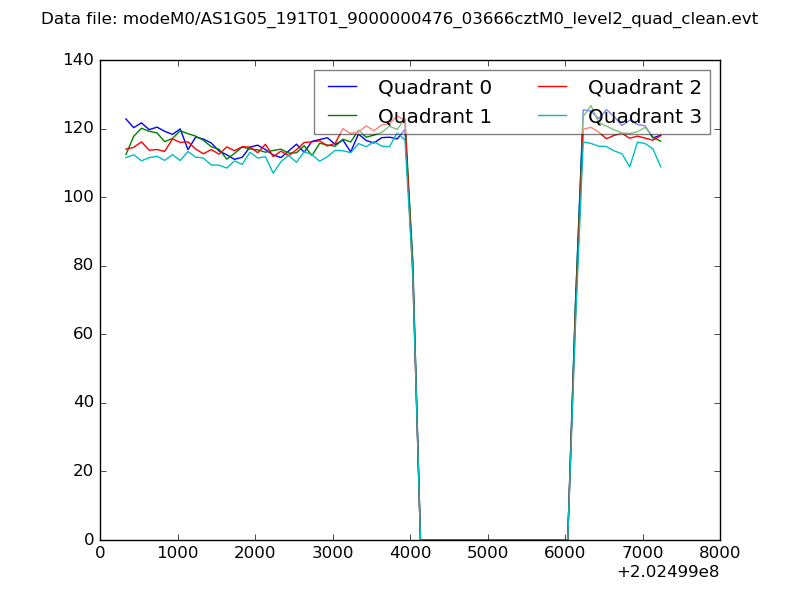 |
|
| Module-wise count rates for Quadrant A Data is divided into 100 sec bins |
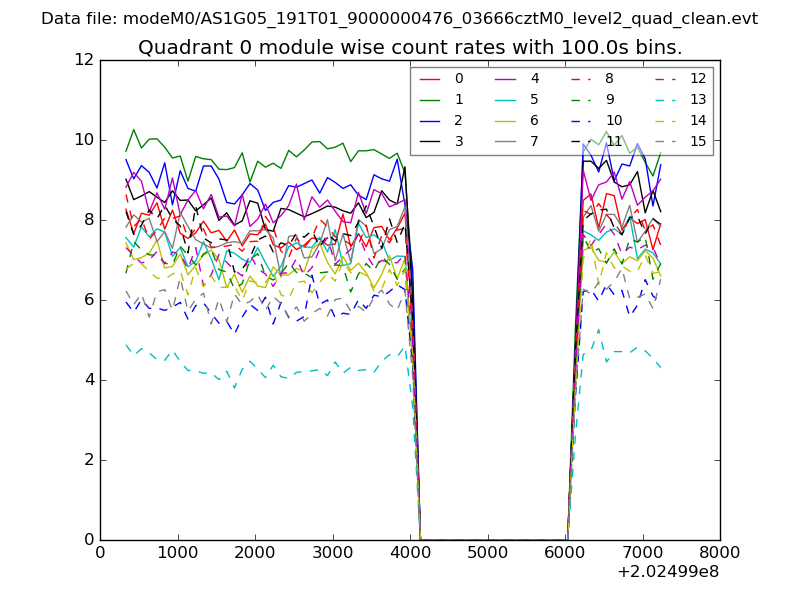 |
 |
| Module-wise count rates for Quadrant B Data is divided into 100 sec bins |
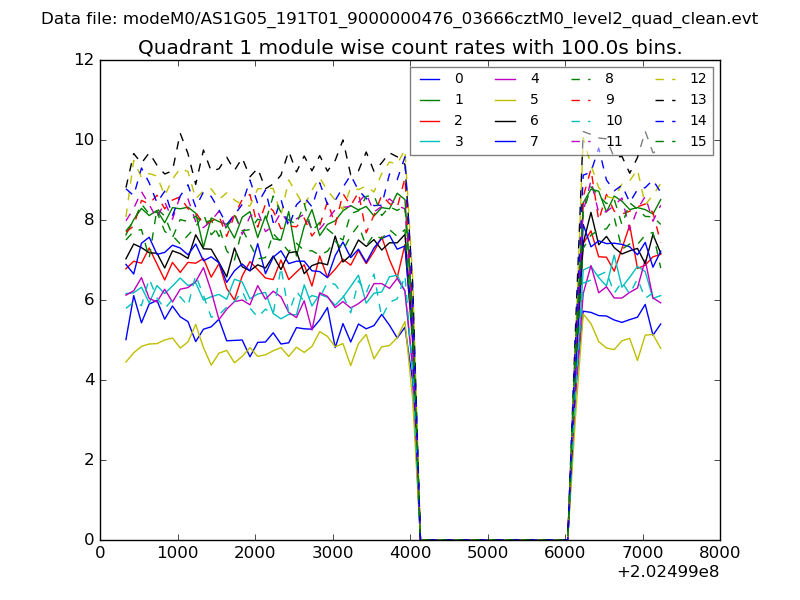 |
 |
| Module-wise count rates for Quadrant C Data is divided into 100 sec bins |
 |
 |
| Module-wise count rates for Quadrant D Data is divided into 100 sec bins |
 |
 |
| Parameter | Plot |
|---|---|
| CZT HV Monitor | 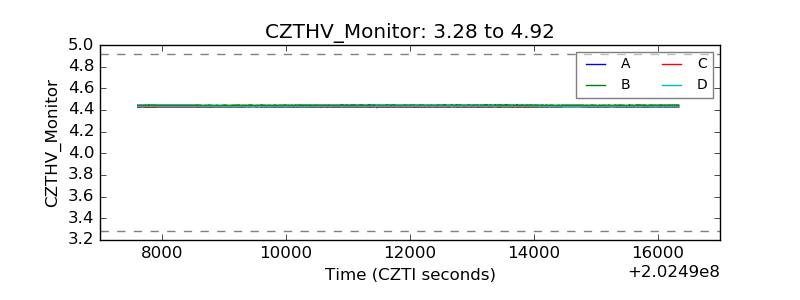 |
| D_VDD | 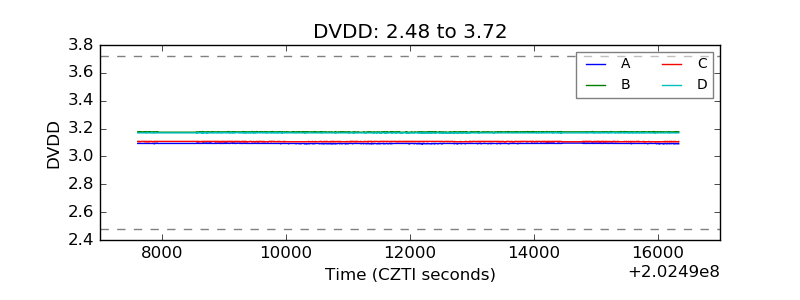 |
| Temperature 1 | 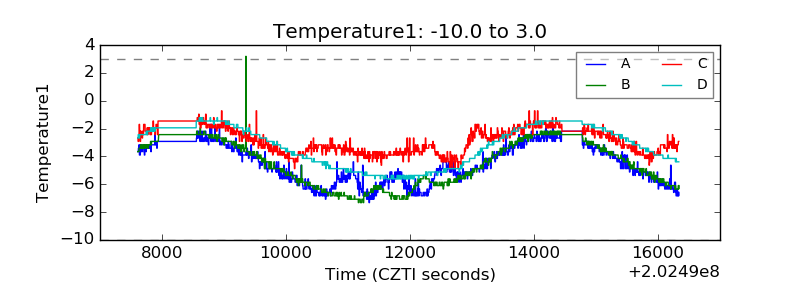 |
| Veto HV Monitor | 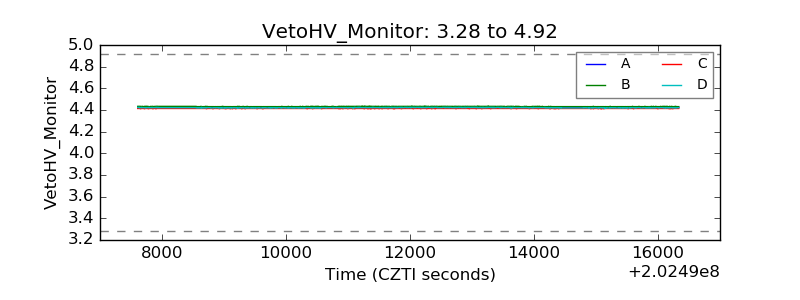 |
| Veto LLD | 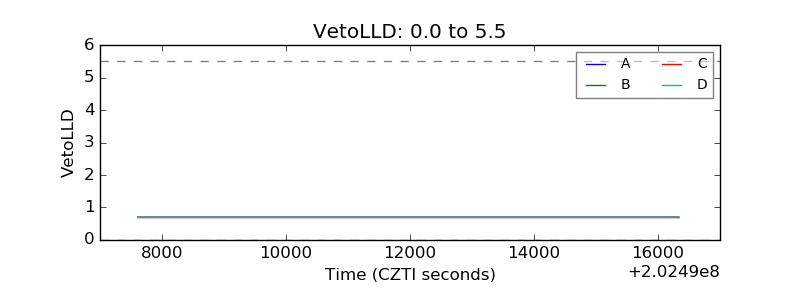 |
| Alpha Counter | 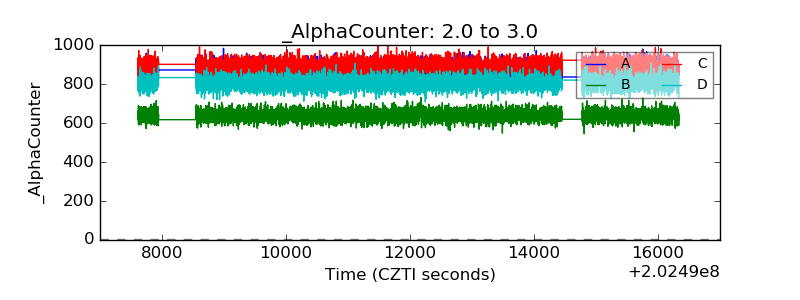 |
| _CPM_Rate | 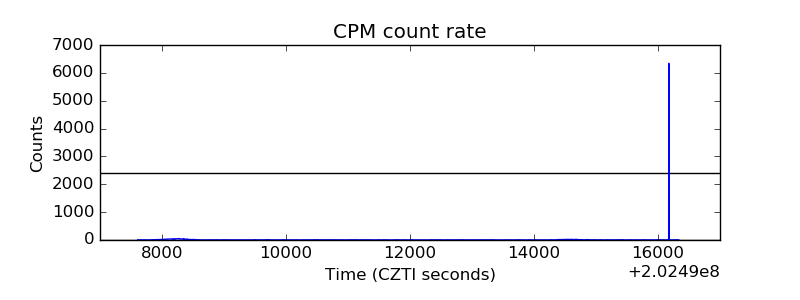 |
| CZT Counter | 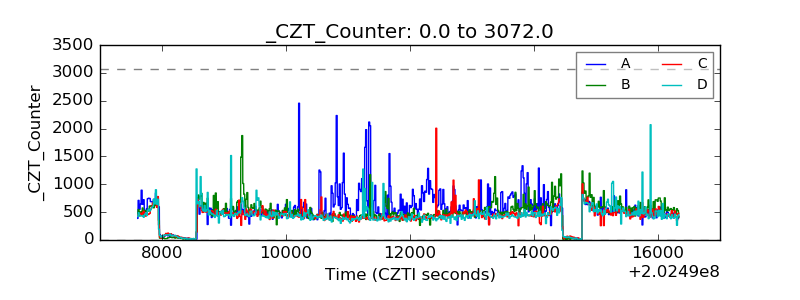 |
| +2.5 Volts monitor |  |
| +5 Volts monitor | 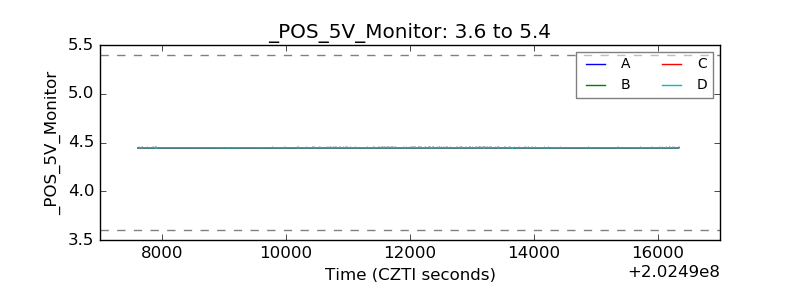 |
| Veto Counter | 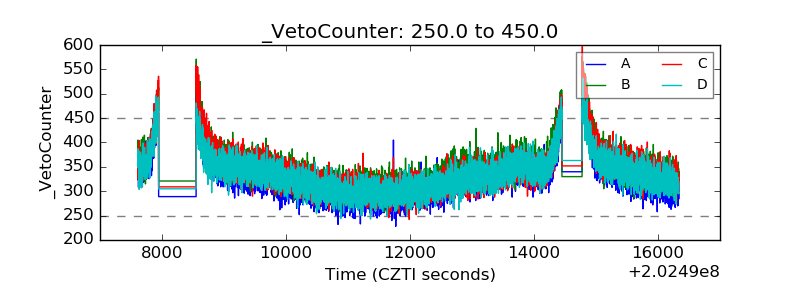 |