| Param | Original file | Final file |
|---|---|---|
| Filename | modeM0/AS1G05_191T01_9000000476_03667cztM0_level2.evt | modeM0/AS1G05_191T01_9000000476_03667cztM0_level2_quad_clean.evt |
| Size (bytes) | 587,249,280 | 99,610,560 |
| Size | 560.0 MB | 95.0 MB |
| Events in quadrant A | 4,366,636 | 631,563 |
| Events in quadrant B | 4,305,758 | 626,487 |
| Events in quadrant C | 3,724,164 | 623,270 |
| Events in quadrant D | 4,852,596 | 585,963 |
| Mode M0 | |||
|---|---|---|---|
| Quadrant | BADHDUFLAG | Total packets | Discarded packets |
| A | 0 | 18317 | 28 |
| B | 0 | 18029 | 50 |
| C | 0 | 16534 | 33 |
| D | 0 | 20173 | 55 |
| Mode SS | |||
|---|---|---|---|
| Quadrant | BADHDUFLAG | Total packets | Discarded packets |
| A | 0 | 164 | 0 |
| B | 0 | 164 | 0 |
| C | 0 | 164 | 2 |
| D | 0 | 164 | 0 |
| Mode M9 | |||
|---|---|---|---|
| Quadrant | BADHDUFLAG | Total packets | Discarded packets |
| A | 0 | 5 | 0 |
| B | 0 | 5 | 0 |
| C | 0 | 5 | 0 |
| D | 0 | 5 | 0 |
| Quadrant | Total seconds | Saturated seconds | Saturation percentage |
|---|---|---|---|
| A | 7896 | 120 | 1.519757% |
| B | 7893 | 153 | 1.938426% |
| C | 7895 | 68 | 0.861305% |
| D | 7893 | 441 | 5.587229% |
Noise dominated data is calculated using 1-second bins in cleaned event files. If a bin has >2000 counts, and if more than 50% of those come from <1% of pixels, then it is considered to be noise-dominated and hence unusable.
| Quadrant | # 1 sec bins | Bins with >0 counts | Bins with >2000 counts | High rate bins dominated by noise | Noise dominated (total time) | Noise dominated (detector-on time) | Marked lightcurve |
|---|---|---|---|---|---|---|---|
| A | 8489 | 7909 | 27 | 27 | 0.32% | 0.34% | 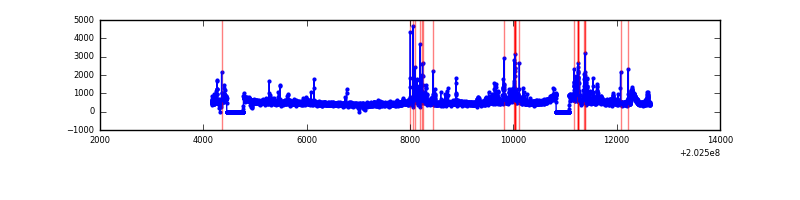 |
| B | 8489 | 7911 | 7 | 7 | 0.08% | 0.09% | 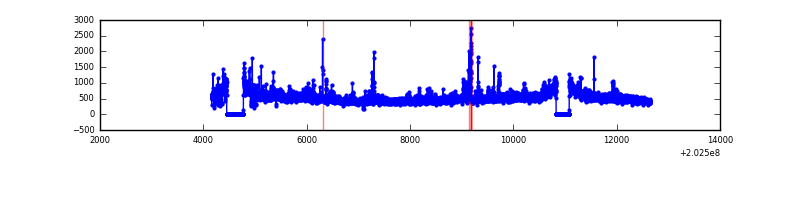 |
| C | 8489 | 7911 | 1 | 1 | 0.01% | 0.01% | 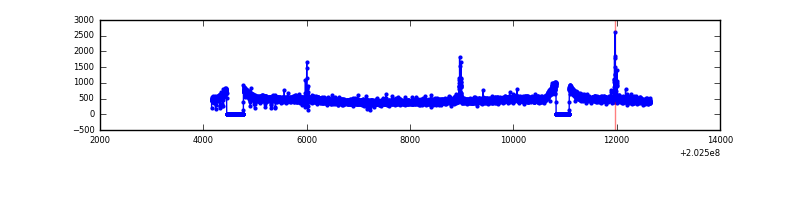 |
| D | 8489 | 7910 | 348 | 348 | 4.10% | 4.40% | 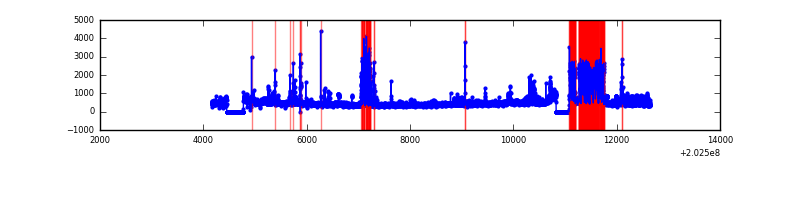 |
Top three noisy pixels from each quadrant. If the there are fewer than three noisy pixels in the level2.evt file, extra rows are filled as -1
| Pixel properties | Quadrant properties | ||||||
|---|---|---|---|---|---|---|---|
| Quadrant | DetID | PixID | Counts | Sigma | Mean | Median | Sigma |
| A | 13 | 251 | 375123 | 1916.05 | 955 | 935 | 195.3 |
| A | 13 | 164 | 248382 | 1267.07 | 955 | 935 | 195.3 |
| A | 0 | 50 | 22172 | 108.75 | 955 | 935 | 195.3 |
| B | 15 | 204 | 283120 | 1497.52 | 970 | 947 | 188.4 |
| B | 4 | 81 | 124512 | 655.77 | 970 | 947 | 188.4 |
| B | 4 | 170 | 57239 | 298.75 | 970 | 947 | 188.4 |
| C | 9 | 247 | 47360 | 211.4 | 936 | 941 | 219.6 |
| C | 13 | 61 | 7893 | 31.66 | 936 | 941 | 219.6 |
| C | 8 | 128 | 7460 | 29.69 | 936 | 941 | 219.6 |
| D | 13 | 172 | 996867 | 4421.52 | 915 | 889 | 225.3 |
| D | 13 | 223 | 248212 | 1097.96 | 915 | 889 | 225.3 |
| D | 12 | 110 | 43956 | 191.19 | 915 | 889 | 225.3 |
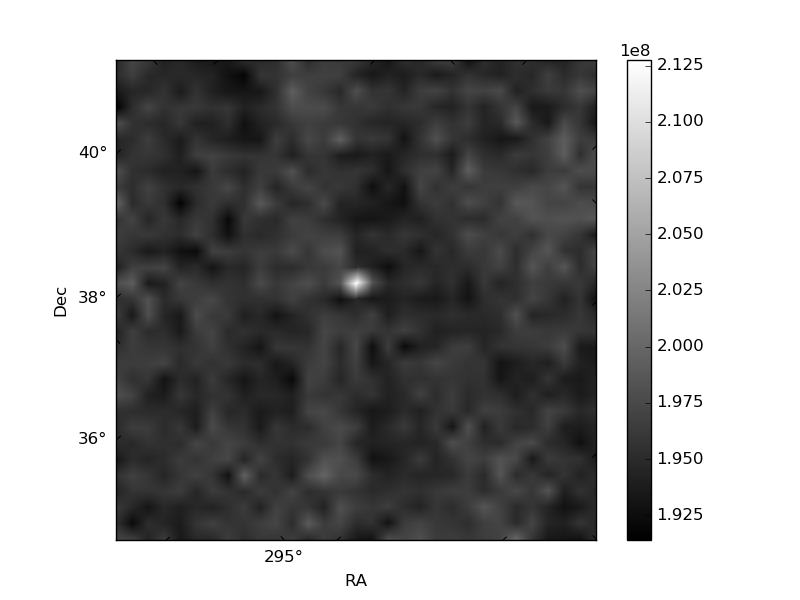
Histogram calculated using DETX and DETY for each event in the final _common_clean file
| Quadrant A | 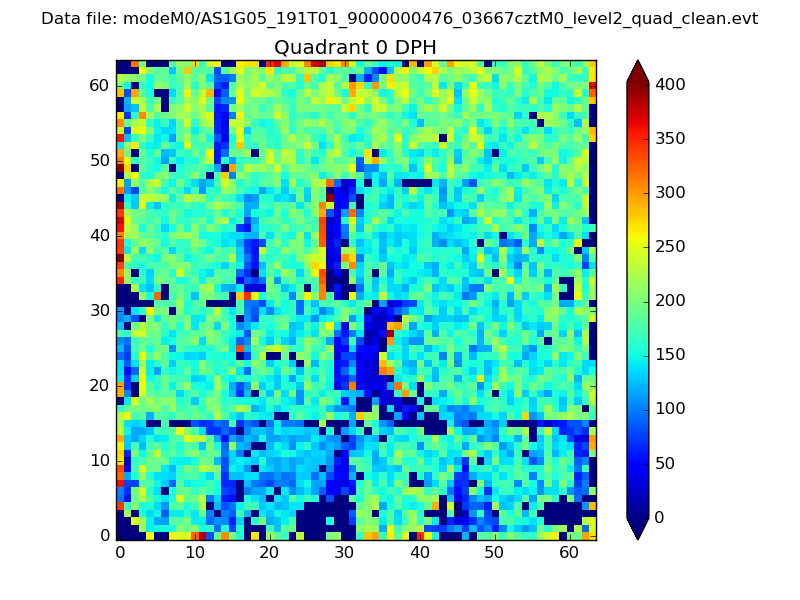 |
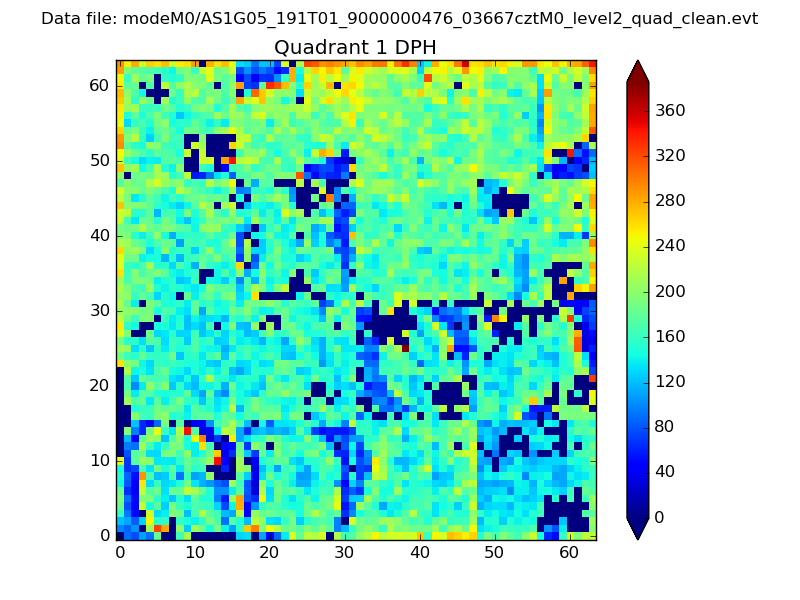 |
Quadrant B |
|---|---|---|---|
| Quadrant D | 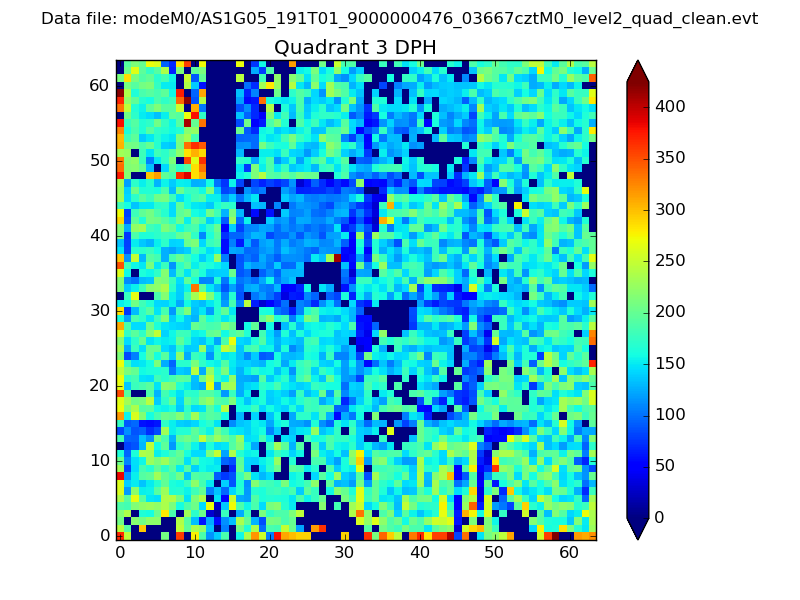 |
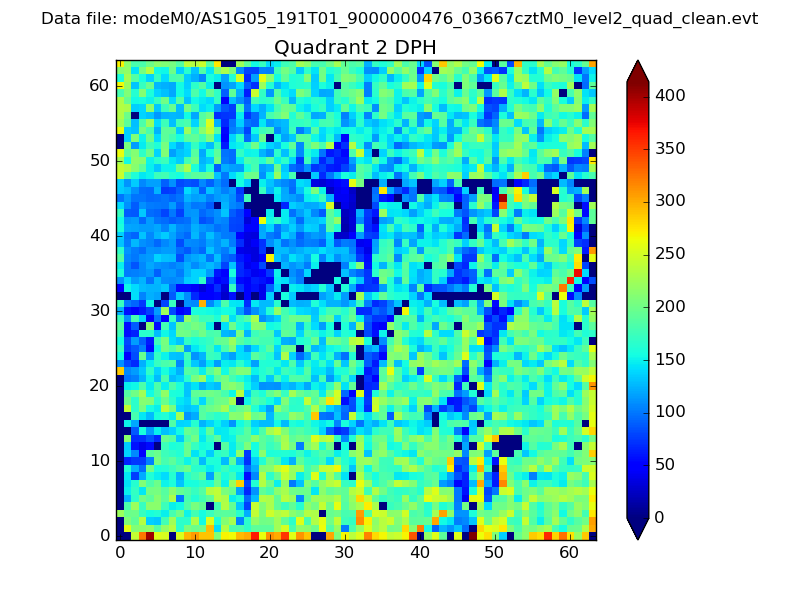 |
Quadrant C |
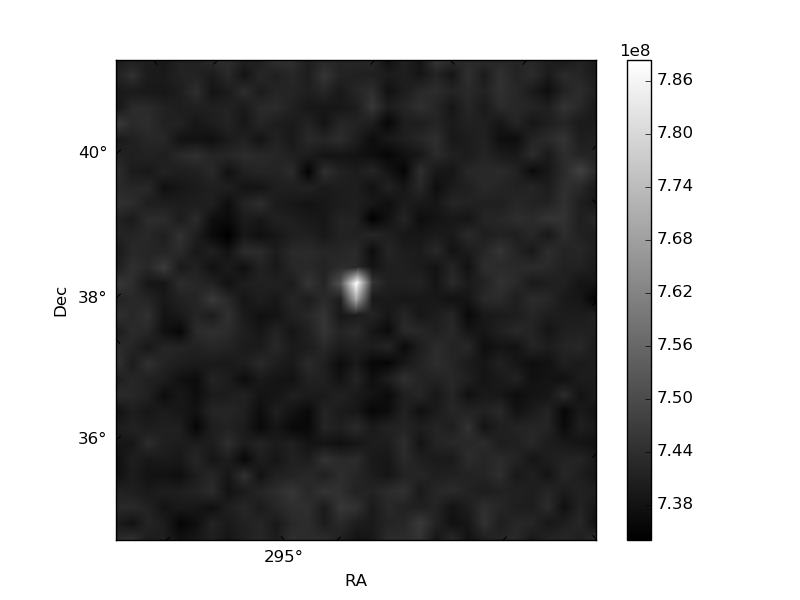
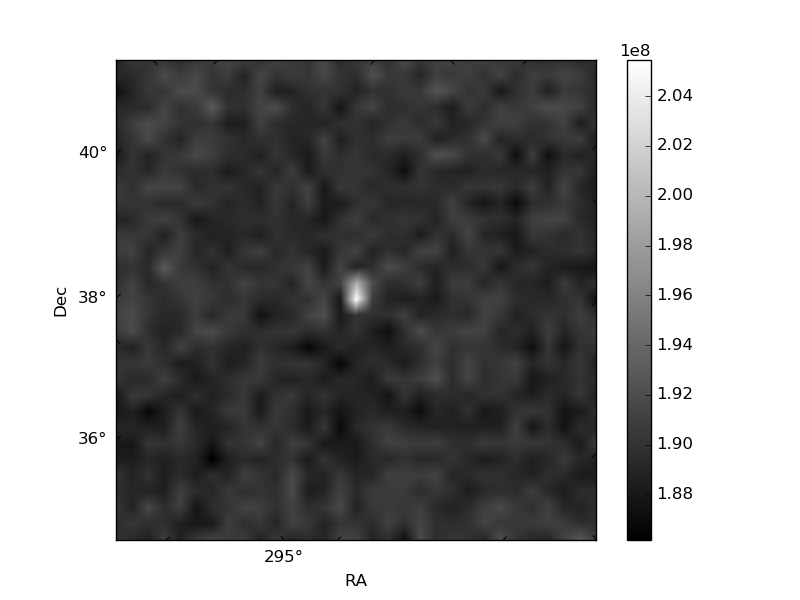
| Plot type | Count rate plots | Images |
|---|---|---|
| Comparison with Poisson distribution Blue bars denote a histogram of data divided into 1 sec bins. Red curve is a Poisson curve with rate = median count rate of data. |
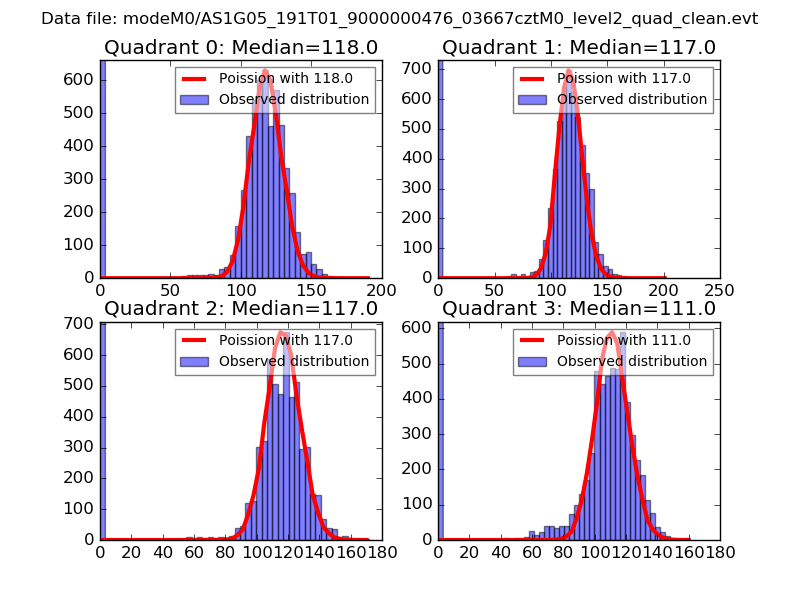 |
 |
| Quadrant-wise count rates Data is divided into 100 sec bins |
 |
|
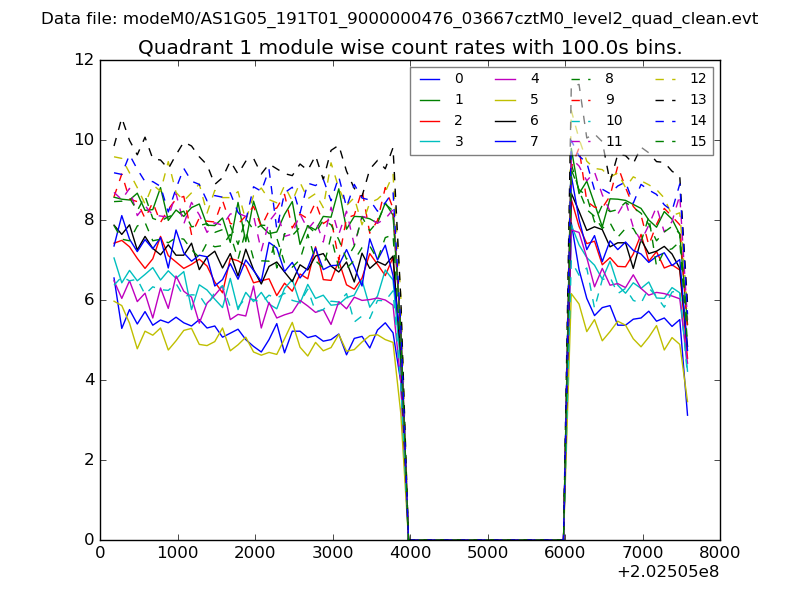
| Module-wise count rates for Quadrant A Data is divided into 100 sec bins |
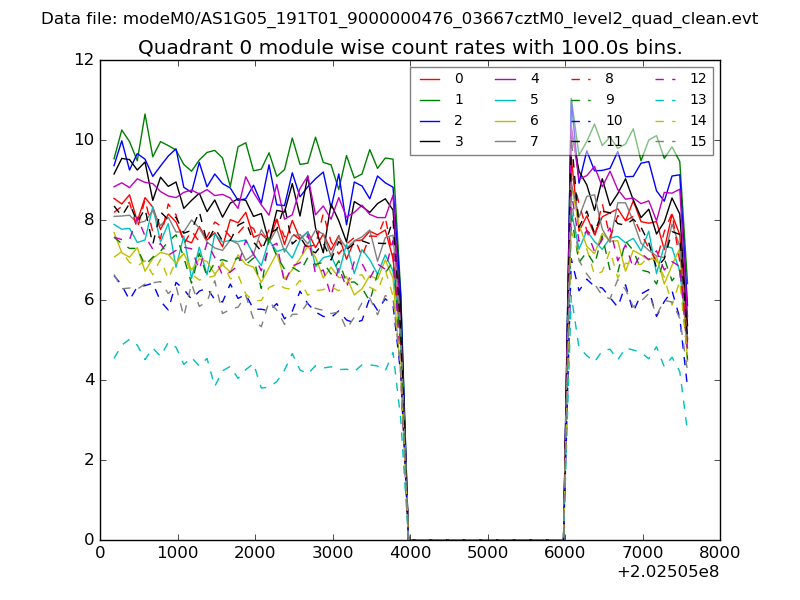 |
 |
| Module-wise count rates for Quadrant B Data is divided into 100 sec bins |
 |
 |
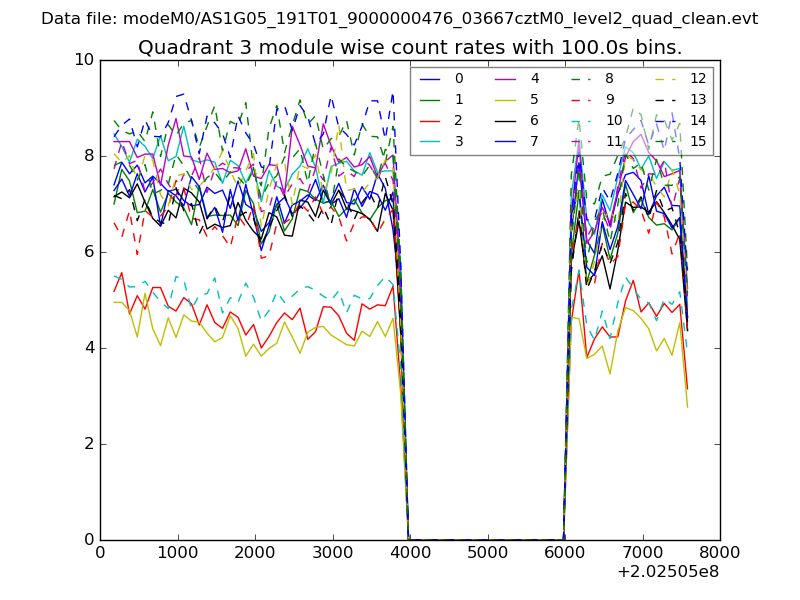
| Module-wise count rates for Quadrant C Data is divided into 100 sec bins |
 |
 |
| Module-wise count rates for Quadrant D Data is divided into 100 sec bins |
 |
 |
| Parameter | Plot |
|---|---|
| CZT HV Monitor | 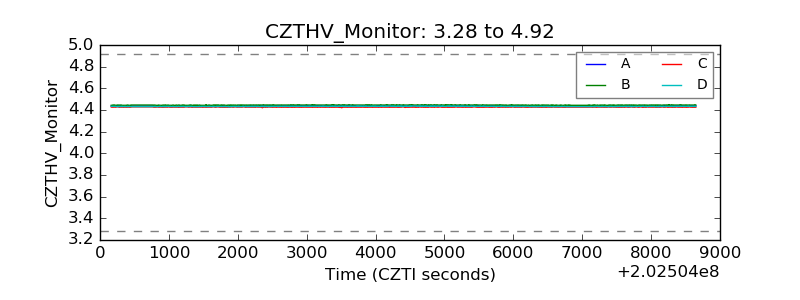 |
| D_VDD | 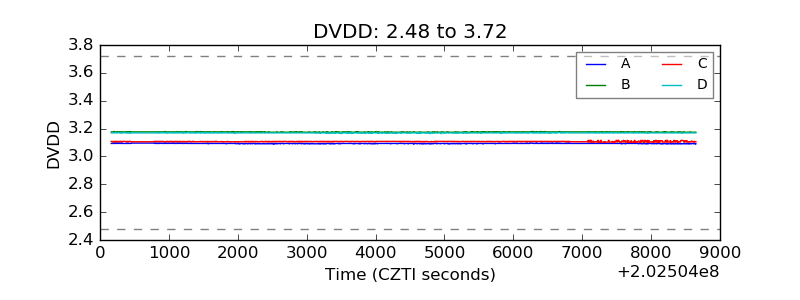 |
| Temperature 1 | 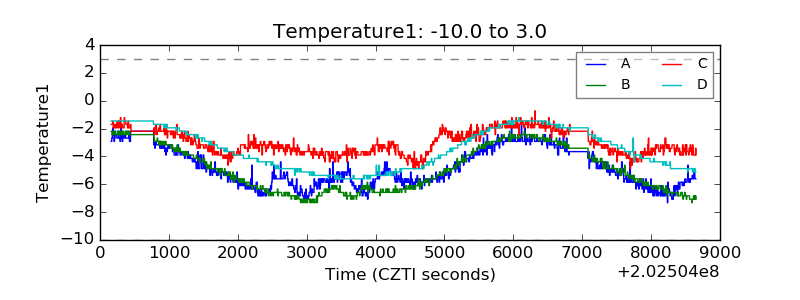 |
| Veto HV Monitor | 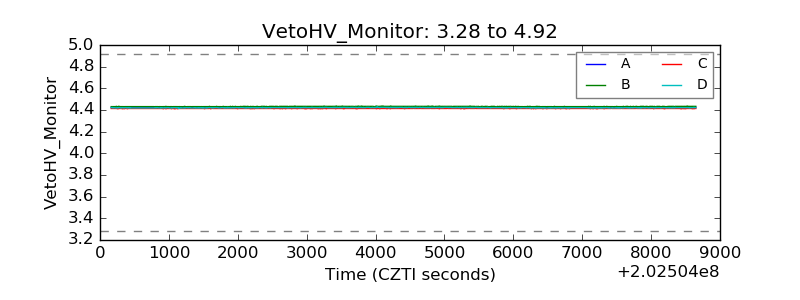 |
| Veto LLD | 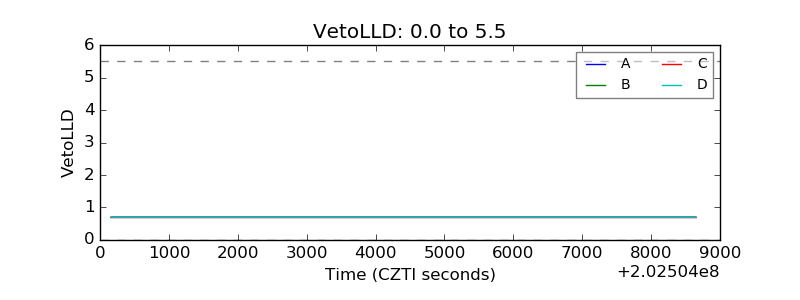 |
| Alpha Counter | 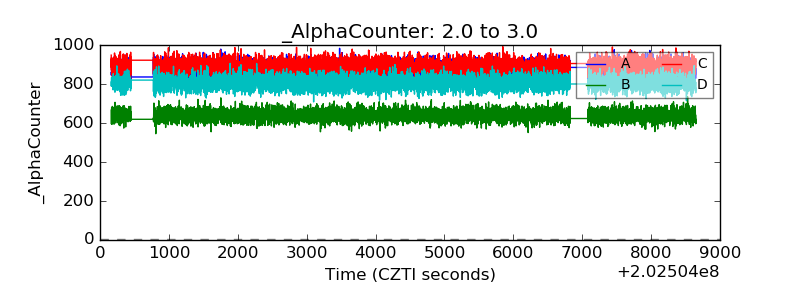 |
| _CPM_Rate | 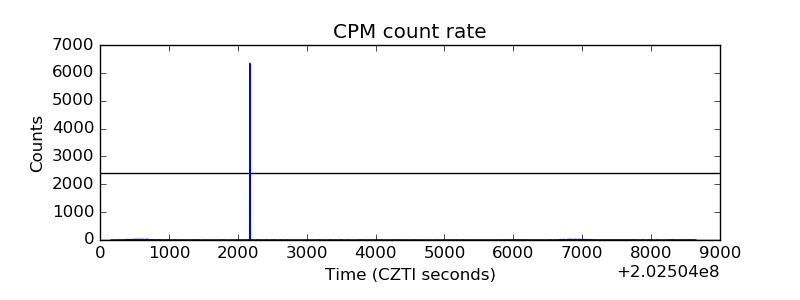 |
| CZT Counter | 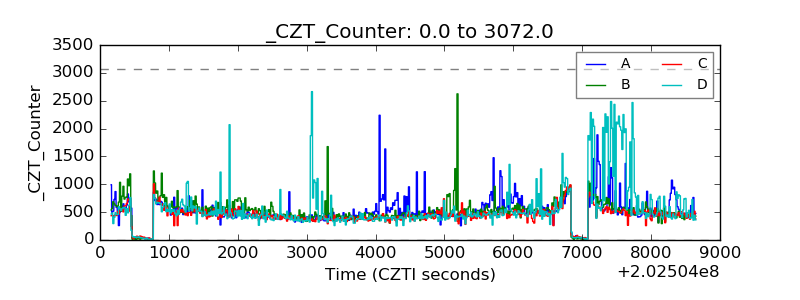 |
| +2.5 Volts monitor |  |
| +5 Volts monitor |  |
| Veto Counter |  |