| Param | Original file | Final file |
|---|---|---|
| Filename | modeM0/AS1G05_191T01_9000000476_03670cztM0_level2.evt | modeM0/AS1G05_191T01_9000000476_03670cztM0_level2_quad_clean.evt |
| Size (bytes) | 1,437,361,920 | 231,891,840 |
| Size | 1.3 GB | 221.1 MB |
| Events in quadrant A | 11,388,259 | 1,445,025 |
| Events in quadrant B | 9,411,473 | 1,455,631 |
| Events in quadrant C | 8,696,004 | 1,450,716 |
| Events in quadrant D | 12,760,919 | 1,371,804 |
| Mode M0 | |||
|---|---|---|---|
| Quadrant | BADHDUFLAG | Total packets | Discarded packets |
| A | 0 | 46442 | 5 |
| B | 0 | 40993 | 4 |
| C | 0 | 39254 | 4 |
| D | 0 | 52257 | 4 |
| Mode SS | |||
|---|---|---|---|
| Quadrant | BADHDUFLAG | Total packets | Discarded packets |
| A | 0 | 386 | 0 |
| B | 0 | 386 | 0 |
| C | 0 | 386 | 0 |
| D | 0 | 386 | 0 |
| Mode M9 | |||
|---|---|---|---|
| Quadrant | BADHDUFLAG | Total packets | Discarded packets |
| A | 0 | 21 | 0 |
| B | 0 | 21 | 0 |
| C | 0 | 21 | 0 |
| D | 0 | 21 | 0 |
| Quadrant | Total seconds | Saturated seconds | Saturation percentage |
|---|---|---|---|
| A | 18862 | 556 | 2.947726% |
| B | 18862 | 236 | 1.251193% |
| C | 18862 | 162 | 0.858870% |
| D | 18862 | 1152 | 6.107518% |
Noise dominated data is calculated using 1-second bins in cleaned event files. If a bin has >2000 counts, and if more than 50% of those come from <1% of pixels, then it is considered to be noise-dominated and hence unusable.
| Quadrant | # 1 sec bins | Bins with >0 counts | Bins with >2000 counts | High rate bins dominated by noise | Noise dominated (total time) | Noise dominated (detector-on time) | Marked lightcurve |
|---|---|---|---|---|---|---|---|
| A | 20937 | 18866 | 188 | 188 | 0.90% | 1.00% | 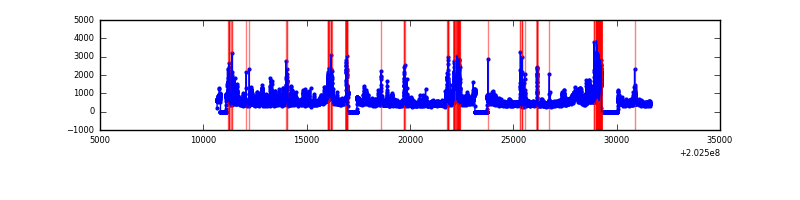 |
| B | 20937 | 18866 | 17 | 17 | 0.08% | 0.09% | 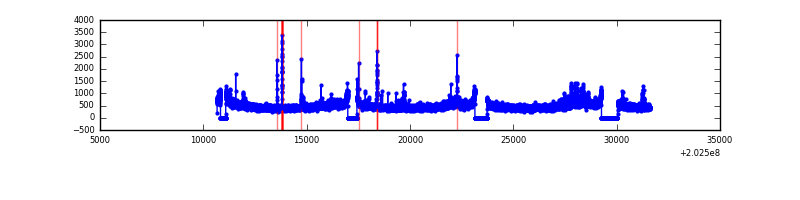 |
| C | 20937 | 18866 | 20 | 20 | 0.10% | 0.11% | 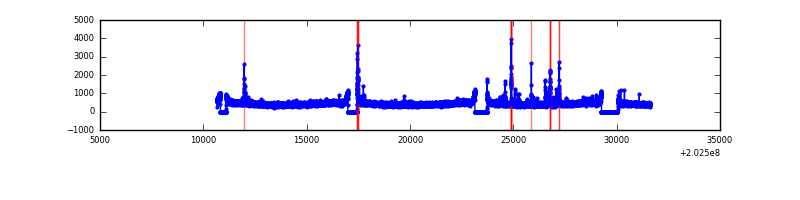 |
| D | 20937 | 18866 | 713 | 713 | 3.41% | 3.78% | 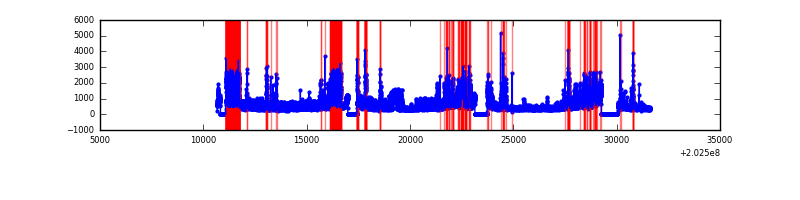 |
Top three noisy pixels from each quadrant. If the there are fewer than three noisy pixels in the level2.evt file, extra rows are filled as -1
| Pixel properties | Quadrant properties | ||||||
|---|---|---|---|---|---|---|---|
| Quadrant | DetID | PixID | Counts | Sigma | Mean | Median | Sigma |
| A | 13 | 164 | 1578281 | 3539.66 | 2192 | 2147 | 445.3 |
| A | 13 | 251 | 1178930 | 2642.8 | 2192 | 2147 | 445.3 |
| A | 8 | 4 | 64947 | 141.04 | 2192 | 2147 | 445.3 |
| B | 15 | 204 | 465554 | 1067.12 | 2243 | 2189 | 434.2 |
| B | 0 | 228 | 62425 | 138.72 | 2243 | 2189 | 434.2 |
| B | 5 | 70 | 60697 | 134.74 | 2243 | 2189 | 434.2 |
| C | 9 | 247 | 171901 | 339.06 | 2153 | 2175 | 500.6 |
| C | 1 | 16 | 59079 | 113.68 | 2153 | 2175 | 500.6 |
| C | 8 | 128 | 23797 | 43.19 | 2153 | 2175 | 500.6 |
| D | 13 | 172 | 4139282 | 8150.96 | 2100 | 2045 | 507.6 |
| D | 13 | 223 | 297019 | 581.14 | 2100 | 2045 | 507.6 |
| D | 12 | 110 | 149958 | 291.41 | 2100 | 2045 | 507.6 |
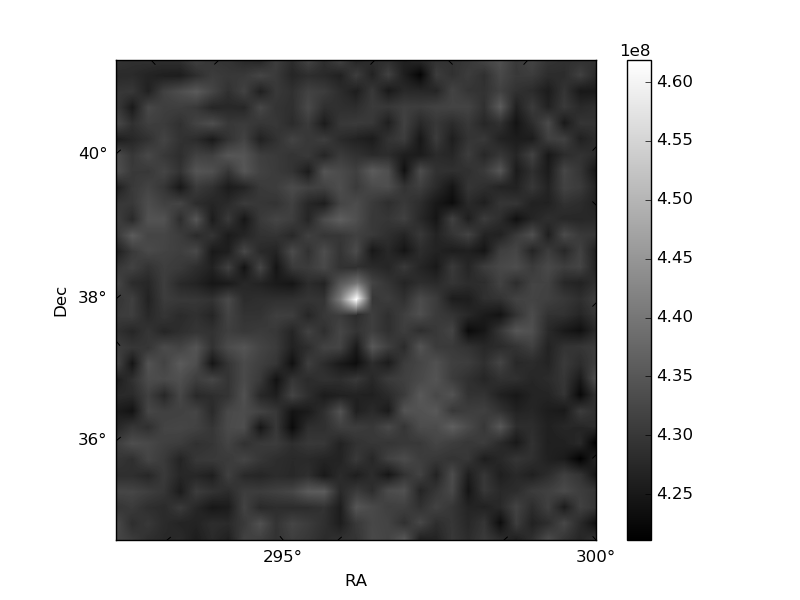
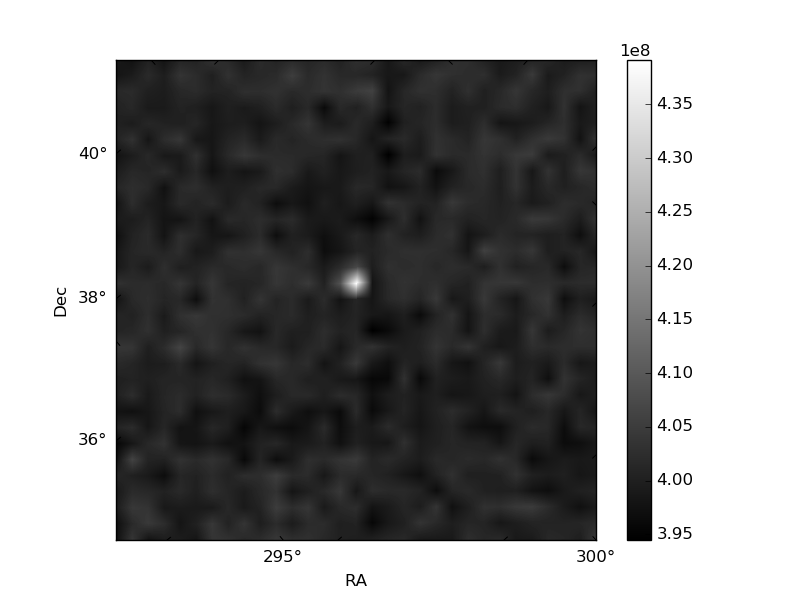
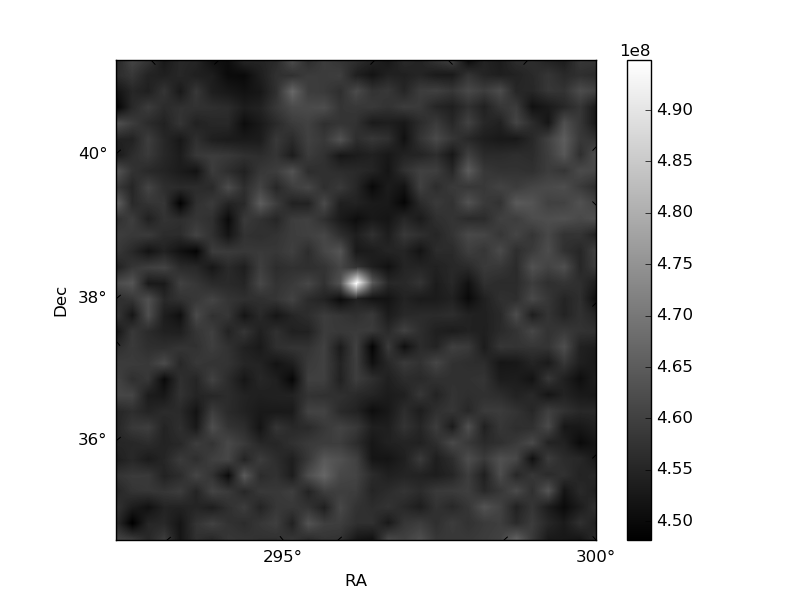
Histogram calculated using DETX and DETY for each event in the final _common_clean file
| Quadrant A | 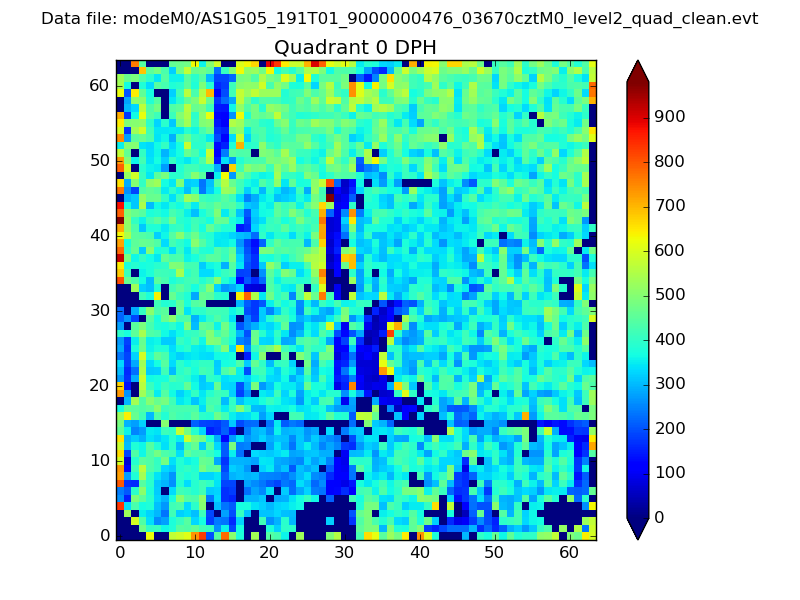 |
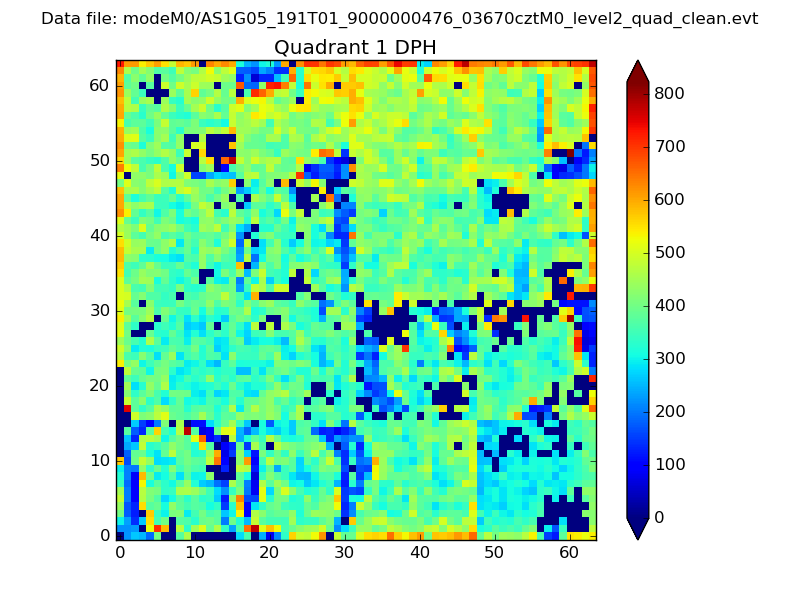 |
Quadrant B |
|---|---|---|---|
| Quadrant D | 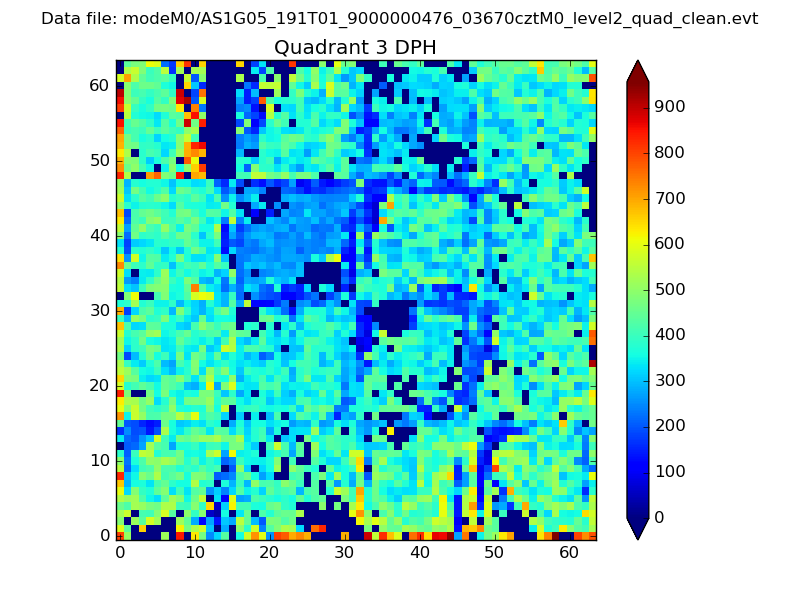 |
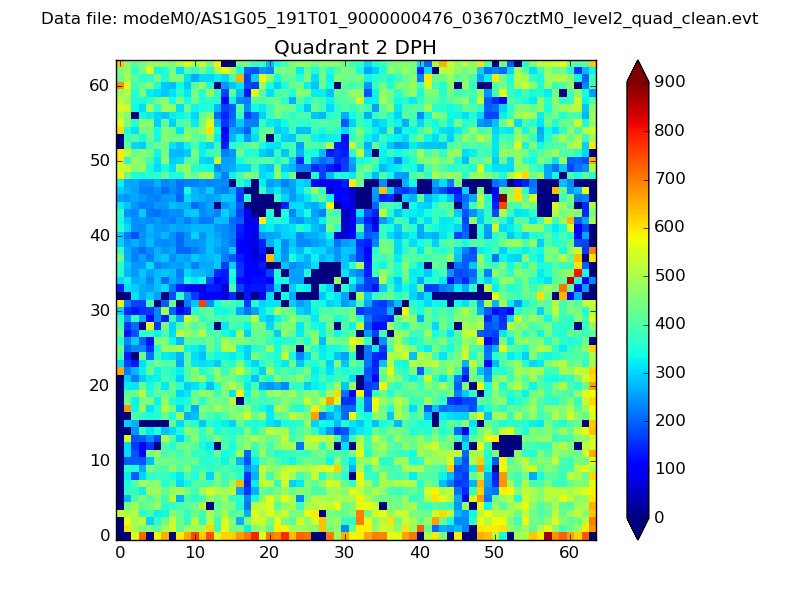 |
Quadrant C |
| Plot type | Count rate plots | Images |
|---|---|---|
| Comparison with Poisson distribution Blue bars denote a histogram of data divided into 1 sec bins. Red curve is a Poisson curve with rate = median count rate of data. |
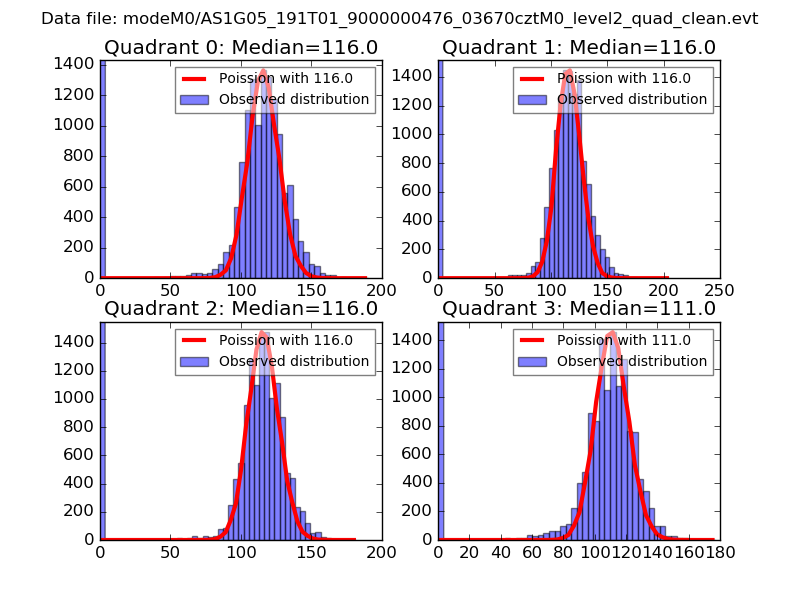 |
 |
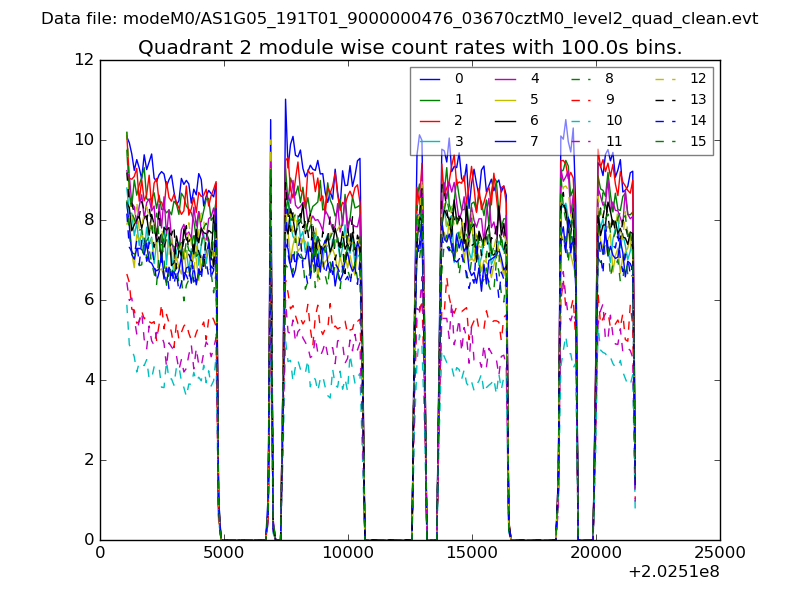
| Quadrant-wise count rates Data is divided into 100 sec bins |
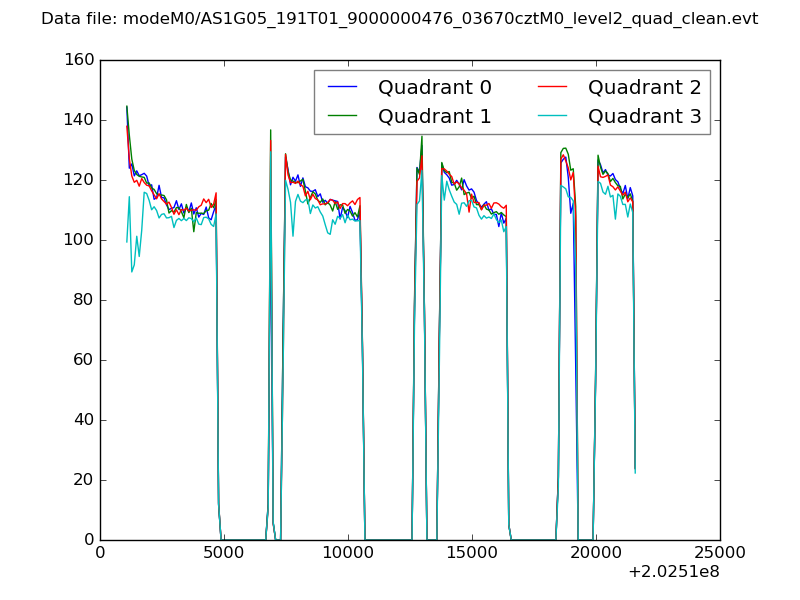 |
|
| Module-wise count rates for Quadrant A Data is divided into 100 sec bins |
 |
 |
| Module-wise count rates for Quadrant B Data is divided into 100 sec bins |
 |
 |
| Module-wise count rates for Quadrant C Data is divided into 100 sec bins |
 |
 |
| Module-wise count rates for Quadrant D Data is divided into 100 sec bins |
 |
 |
| Parameter | Plot |
|---|---|
| CZT HV Monitor | 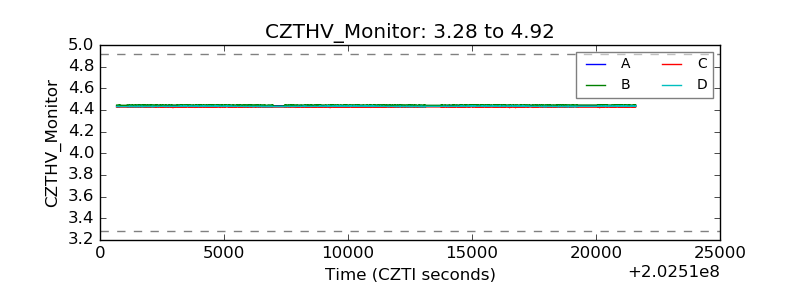 |
| D_VDD | 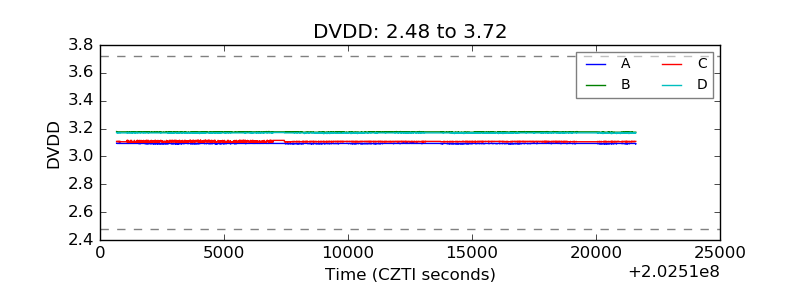 |
| Temperature 1 | 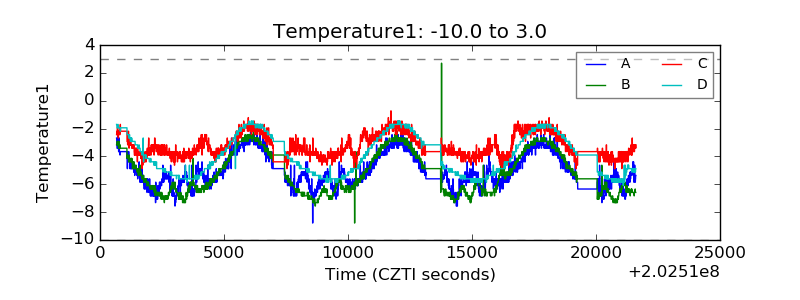 |
| Veto HV Monitor | 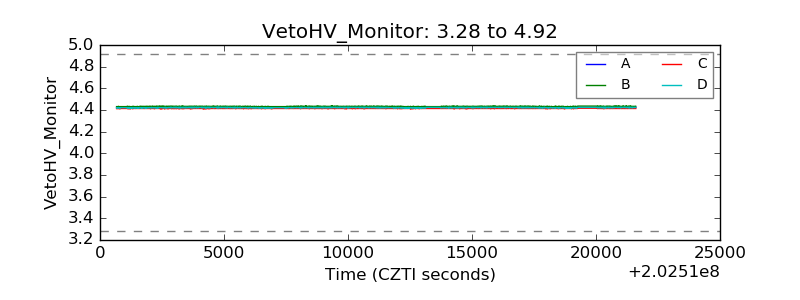 |
| Veto LLD | 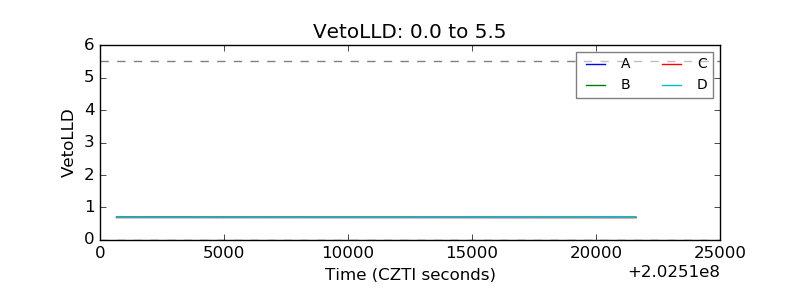 |
| Alpha Counter | 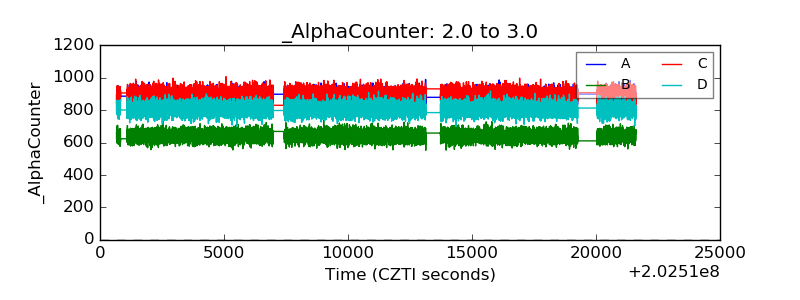 |
| _CPM_Rate | 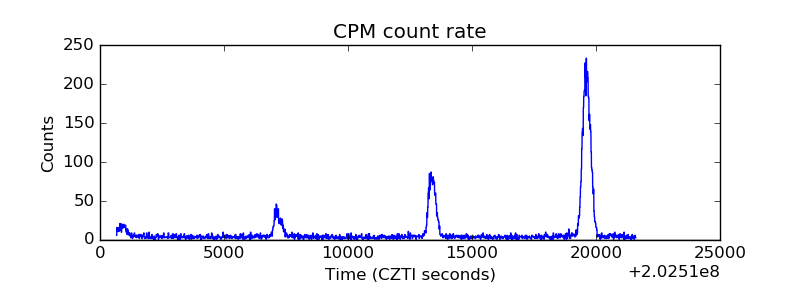 |
| CZT Counter | 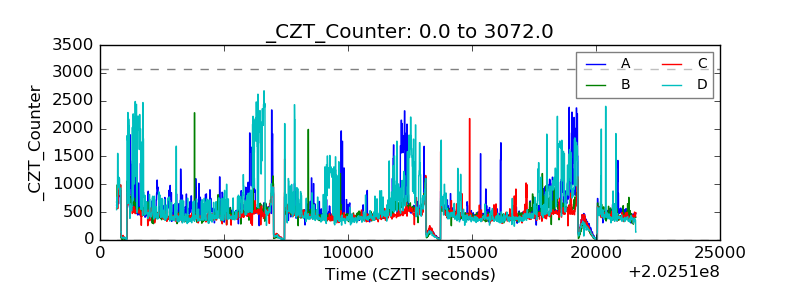 |
| +2.5 Volts monitor |  |
| +5 Volts monitor |  |
| Veto Counter | 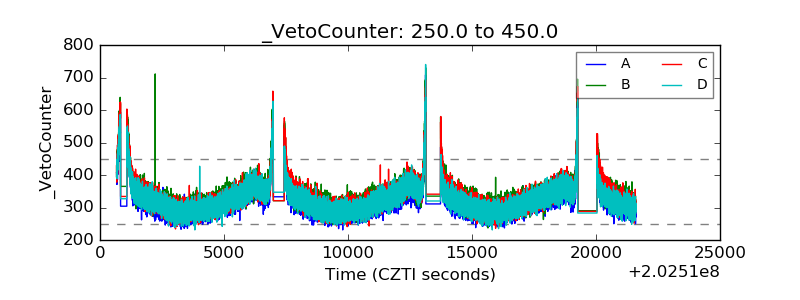 |