| Param | Original file | Final file |
|---|---|---|
| Filename | modeM0/AS1G05_152T04_9000000480cztM0_level2.fits | modeM0/AS1G05_152T04_9000000480cztM0_level2_quad_clean.evt |
| Size (bytes) | 236,767,680 | 249,315,840 |
| Size | 225.8 MB | 237.8 MB |
| Events in quadrant A | 1,421,496 | 1,482,808 |
| Events in quadrant B | 1,385,602 | 1,542,207 |
| Events in quadrant C | 1,395,578 | 1,420,052 |
| Events in quadrant D | 1,229,236 | 1,366,968 |
| Mode M9 | |||
|---|---|---|---|
| Quadrant | BADHDUFLAG | Total packets | Discarded packets |
| A | 0 | 48 | 0 |
| B | 0 | 48 | 0 |
| C | 0 | 48 | 0 |
| D | 0 | 49 | 0 |
| Mode SS | |||
|---|---|---|---|
| Quadrant | BADHDUFLAG | Total packets | Discarded packets |
| A | 0 | 512 | 0 |
| B | 0 | 512 | 0 |
| C | 0 | 512 | 0 |
| D | 0 | 512 | 0 |
| Mode M0 | |||
|---|---|---|---|
| Quadrant | BADHDUFLAG | Total packets | Discarded packets |
| A | 0 | 63047 | 0 |
| B | 0 | 63326 | 0 |
| C | 0 | 56411 | 0 |
| D | 0 | 55053 | 0 |
| Quadrant | Total seconds | Saturated seconds | Saturation percentage |
|---|---|---|---|
| A | 25274 | 1165 | 4.609480% |
| B | 25274 | 393 | 1.554958% |
| C | 25274 | 834 | 3.299834% |
| D | 25274 | 345 | 1.365039% |
Noise dominated data is calculated using 1-second bins in cleaned event files. If a bin has >2000 counts, and if more than 50% of those come from <1% of pixels, then it is considered to be noise-dominated and hence unusable.
| Quadrant | # 1 sec bins | Bins with >0 counts | Bins with >2000 counts | High rate bins dominated by noise | Noise dominated (total time) | Noise dominated (detector-on time) | Marked lightcurve |
|---|---|---|---|---|---|---|---|
| A | 29738 | 25262 | 0 | 0 | 0.00% | 0.00% |  |
| B | 29738 | 25268 | 0 | 0 | 0.00% | 0.00% |  |
| C | 29738 | 25251 | 0 | 0 | 0.00% | 0.00% |  |
| D | 29738 | 25271 | 0 | 0 | 0.00% | 0.00% |  |
Top three noisy pixels from each quadrant. If the there are fewer than three noisy pixels in the level2.evt file, extra rows are filled as -1
| Pixel properties | Quadrant properties | ||||||
|---|---|---|---|---|---|---|---|
| Quadrant | DetID | PixID | Counts | Sigma | Mean | Median | Sigma |
| A | 0 | 29 | 1385 | 10.81 | 370 | 345 | 96.2 |
| A | 7 | 110 | 1223 | 9.12 | 370 | 345 | 96.2 |
| A | 0 | 30 | 1091 | 7.75 | 370 | 345 | 96.2 |
| B | 2 | 9 | 1249 | 11.75 | 366 | 349 | 76.6 |
| B | 12 | 226 | 1000 | 8.5 | 366 | 349 | 76.6 |
| B | 2 | 8 | 997 | 8.46 | 366 | 349 | 76.6 |
| C | 1 | 80 | 1010 | 6.73 | 368 | 341 | 99.4 |
| C | 1 | 81 | 991 | 6.54 | 368 | 341 | 99.4 |
| C | 3 | 158 | 945 | 6.08 | 368 | 341 | 99.4 |
| D | 11 | 82 | 1024 | 7.41 | 350 | 318 | 95.3 |
| D | 3 | 14 | 933 | 6.46 | 350 | 318 | 95.3 |
| D | 7 | 5 | 911 | 6.22 | 350 | 318 | 95.3 |
Histogram calculated using DETX and DETY for each event in the final _common_clean file
| Quadrant A |  |
 |
Quadrant B |
|---|---|---|---|
| Quadrant D |  |
 |
Quadrant C |
| Plot type | Count rate plots | Images |
|---|---|---|
| Comparison with Poisson distribution Blue bars denote a histogram of data divided into 1 sec bins. Red curve is a Poisson curve with rate = median count rate of data. |
 |
 |
| Quadrant-wise count rates Data is divided into 100 sec bins |
 |
|
| Module-wise count rates for Quadrant A Data is divided into 100 sec bins |
 |
 |
| Module-wise count rates for Quadrant B Data is divided into 100 sec bins |
 |
 |
| Module-wise count rates for Quadrant C Data is divided into 100 sec bins |
 |
 |
| Module-wise count rates for Quadrant D Data is divided into 100 sec bins |
 |
 |
| Parameter | Plot |
|---|---|
| CZT HV Monitor |  |
| D_VDD | 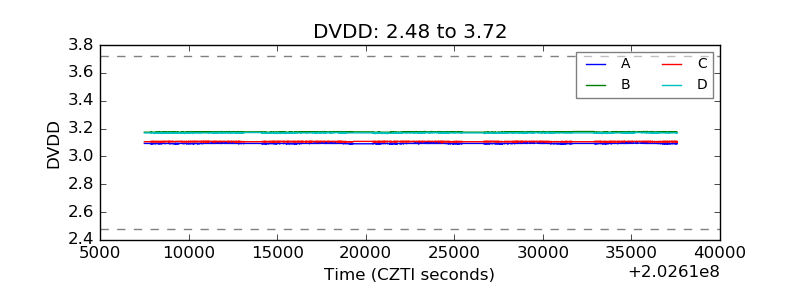 |
| Temperature 1 |  |
| Veto HV Monitor |  |
| Veto LLD |  |
| Alpha Counter |  |
| _CPM_Rate |  |
| CZT Counter |  |
| +2.5 Volts monitor |  |
| +5 Volts monitor |  |
| _ROLL_ROT |  |
| _Roll_DEC |  |
| _Roll_RA |  |
| Veto Counter |  |