| Param | Original file | Final file |
|---|---|---|
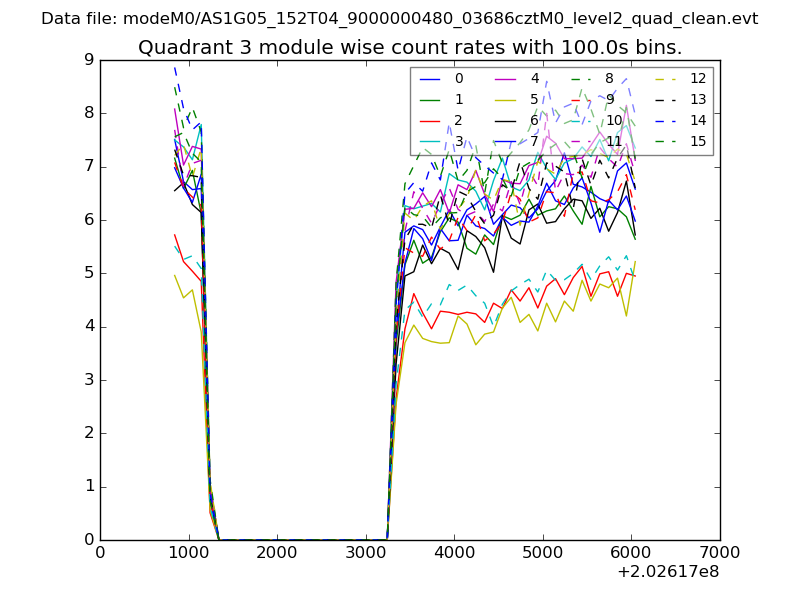
| Filename | modeM0/AS1G05_152T04_9000000480_03686cztM0_level2.evt | modeM0/AS1G05_152T04_9000000480_03686cztM0_level2_quad_clean.evt |
| Size (bytes) | 525,392,640 | 56,914,560 |
| Size | 501.1 MB | 54.3 MB |
| Events in quadrant A | 4,124,398 | 323,582 |
| Events in quadrant B | 3,707,641 | 329,654 |
| Events in quadrant C | 4,420,590 | 283,869 |
| Events in quadrant D | 3,204,225 | 318,425 |
| Mode M9 | |||
|---|---|---|---|
| Quadrant | BADHDUFLAG | Total packets | Discarded packets |
| A | 0 | 13 | 0 |
| B | 0 | 13 | 0 |
| C | 0 | 13 | 0 |
| D | 0 | 14 | 0 |
| Mode SS | |||
|---|---|---|---|
| Quadrant | BADHDUFLAG | Total packets | Discarded packets |
| A | 0 | 136 | 0 |
| B | 0 | 136 | 0 |
| C | 0 | 136 | 0 |
| D | 0 | 136 | 0 |
| Mode M0 | |||
|---|---|---|---|
| Quadrant | BADHDUFLAG | Total packets | Discarded packets |
| A | 0 | 16630 | 3 |
| B | 0 | 15347 | 2 |
| C | 0 | 17971 | 2 |
| D | 0 | 14432 | 2 |
| Quadrant | Total seconds | Saturated seconds | Saturation percentage |
|---|---|---|---|
| A | 6700 | 210 | 3.134328% |
| B | 6700 | 61 | 0.910448% |
| C | 6700 | 633 | 9.447761% |
| D | 6700 | 41 | 0.611940% |
Noise dominated data is calculated using 1-second bins in cleaned event files. If a bin has >2000 counts, and if more than 50% of those come from <1% of pixels, then it is considered to be noise-dominated and hence unusable.
| Quadrant | # 1 sec bins | Bins with >0 counts | Bins with >2000 counts | High rate bins dominated by noise | Noise dominated (total time) | Noise dominated (detector-on time) | Marked lightcurve |
|---|---|---|---|---|---|---|---|
| A | 7690 | 6700 | 126 | 126 | 1.64% | 1.88% | 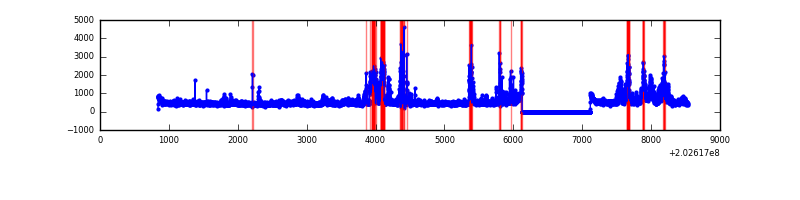 |
| B | 7690 | 6701 | 4 | 4 | 0.05% | 0.06% | 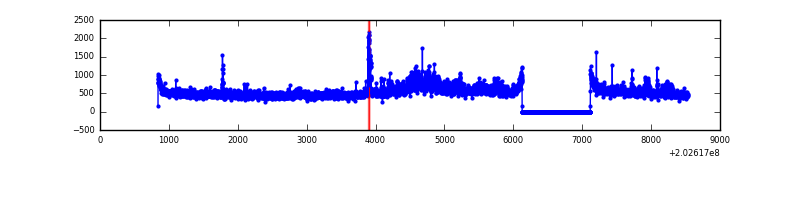 |
| C | 7690 | 6700 | 513 | 513 | 6.67% | 7.66% | 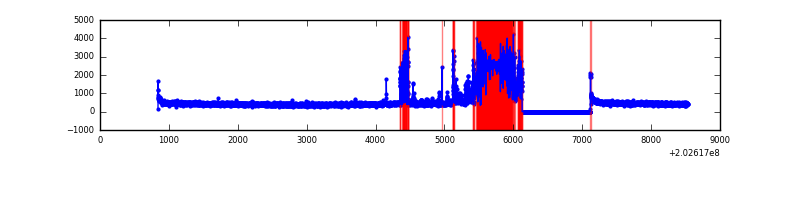 |
| D | 7690 | 6701 | 11 | 11 | 0.14% | 0.16% | 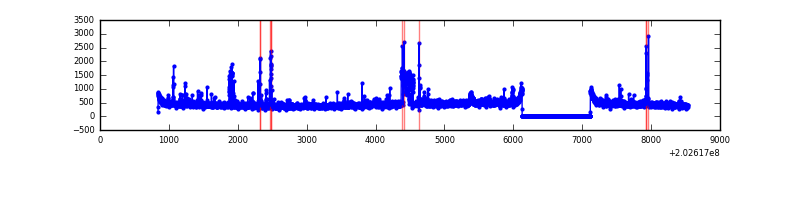 |
Top three noisy pixels from each quadrant. If the there are fewer than three noisy pixels in the level2.evt file, extra rows are filled as -1
| Pixel properties | Quadrant properties | ||||||
|---|---|---|---|---|---|---|---|
| Quadrant | DetID | PixID | Counts | Sigma | Mean | Median | Sigma |
| A | 13 | 251 | 565116 | 3576.01 | 772 | 755 | 157.8 |
| A | 13 | 164 | 373599 | 2362.49 | 772 | 755 | 157.8 |
| A | 0 | 50 | 84919 | 533.3 | 772 | 755 | 157.8 |
| B | 15 | 204 | 280164 | 1823.86 | 790 | 770 | 153.2 |
| B | 14 | 167 | 110642 | 717.24 | 790 | 770 | 153.2 |
| B | 3 | 0 | 101993 | 660.78 | 790 | 770 | 153.2 |
| C | 2 | 53 | 1563865 | 9328.94 | 713 | 715 | 167.6 |
| C | 14 | 234 | 63553 | 375.02 | 713 | 715 | 167.6 |
| C | 13 | 61 | 6146 | 32.41 | 713 | 715 | 167.6 |
| D | 1 | 20 | 157238 | 858.76 | 752 | 730 | 182.2 |
| D | 5 | 233 | 49388 | 266.98 | 752 | 730 | 182.2 |
| D | 2 | 37 | 45182 | 243.91 | 752 | 730 | 182.2 |
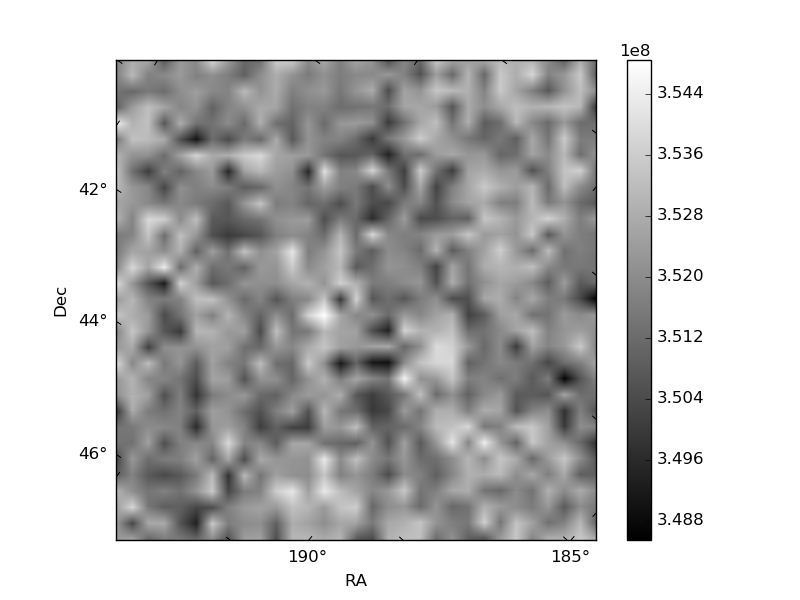
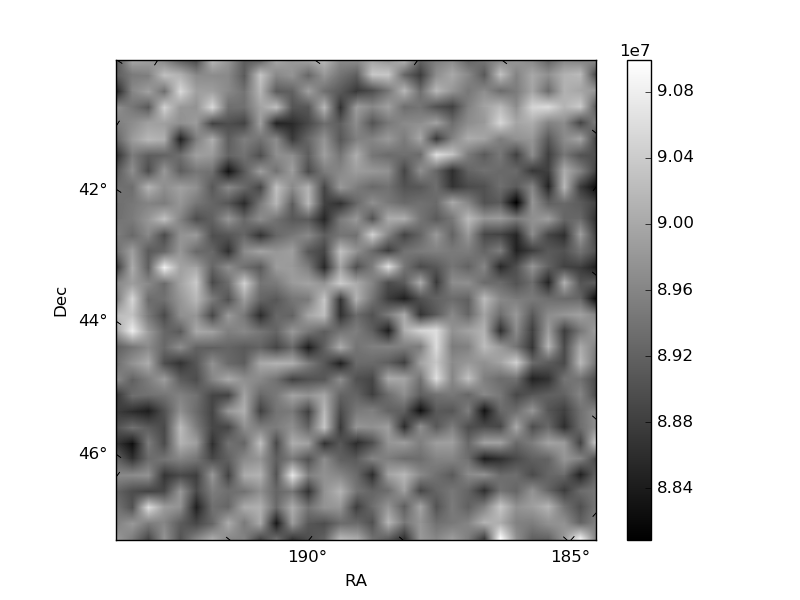
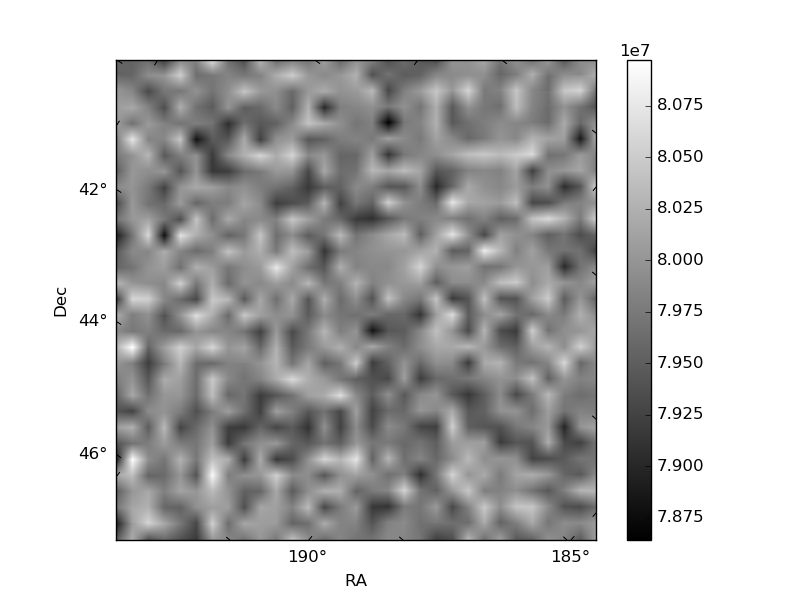
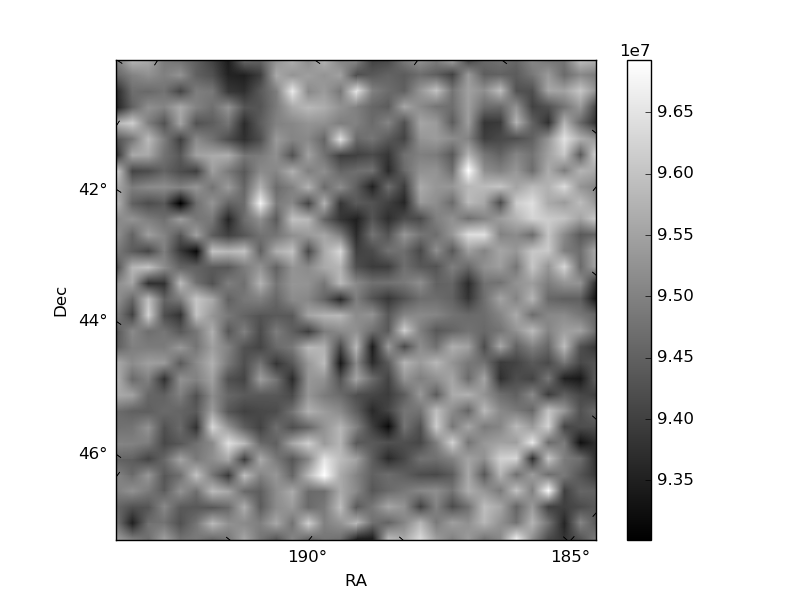
Histogram calculated using DETX and DETY for each event in the final _common_clean file
| Quadrant A | 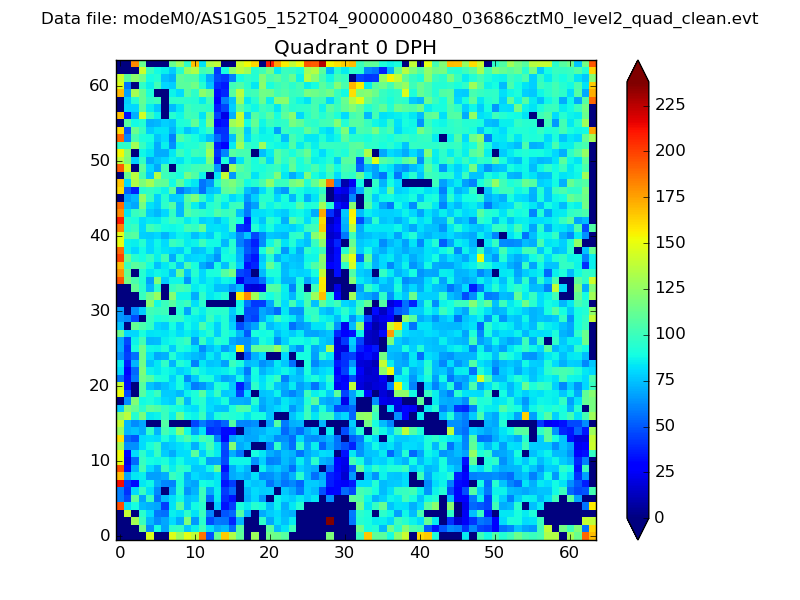 |
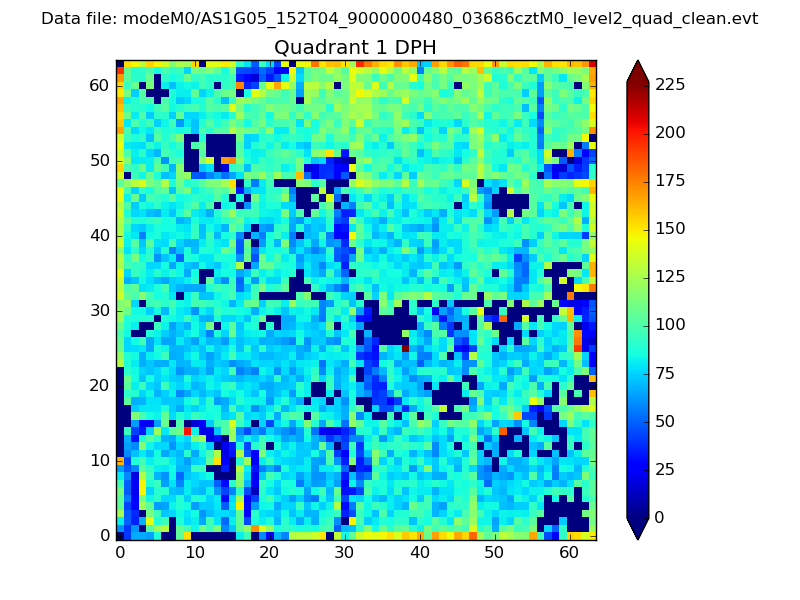 |
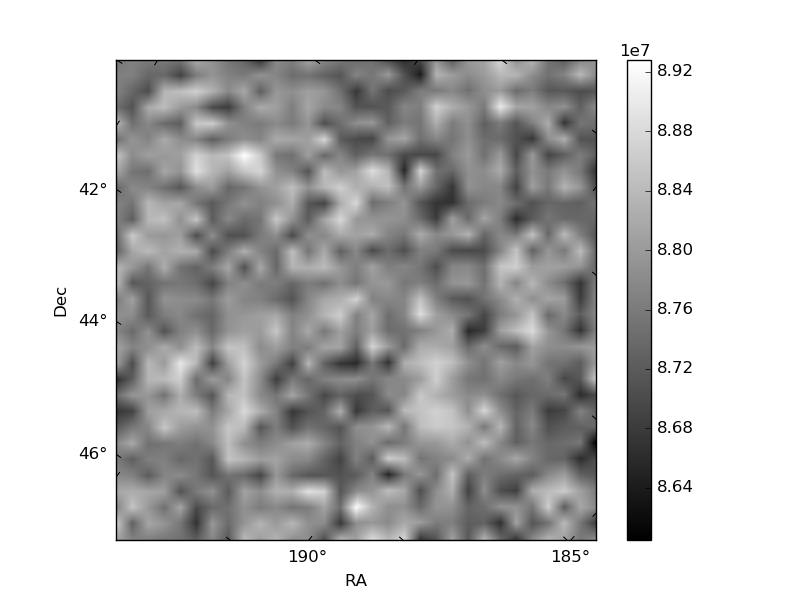
Quadrant B |
|---|---|---|---|
| Quadrant D | 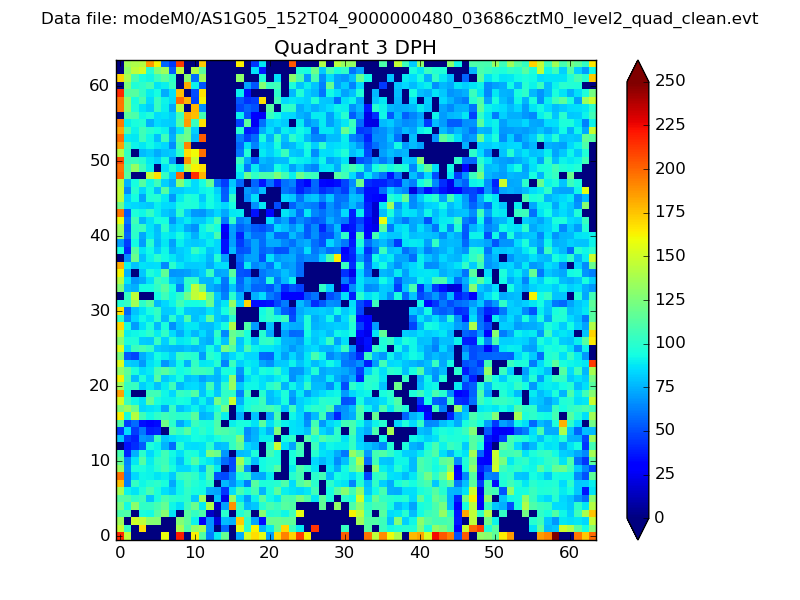 |
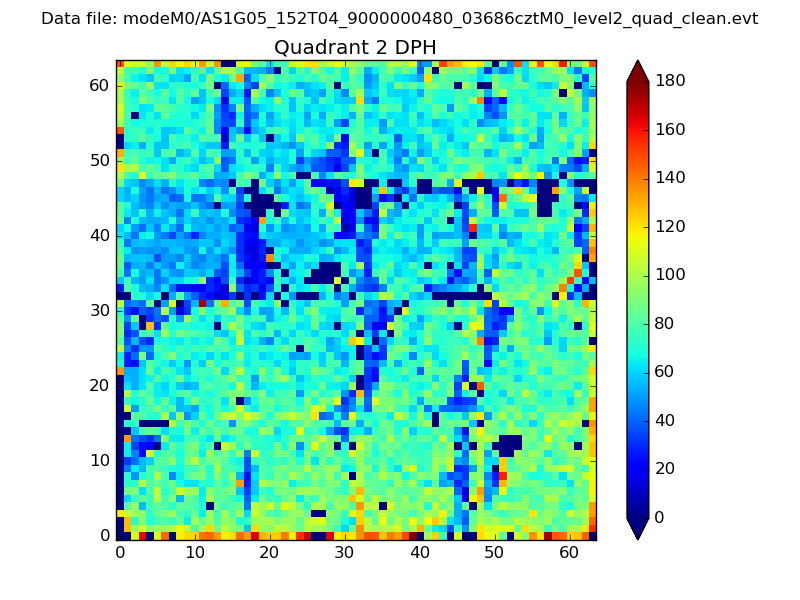 |
Quadrant C |
| Plot type | Count rate plots | Images |
|---|---|---|
| Comparison with Poisson distribution Blue bars denote a histogram of data divided into 1 sec bins. Red curve is a Poisson curve with rate = median count rate of data. |
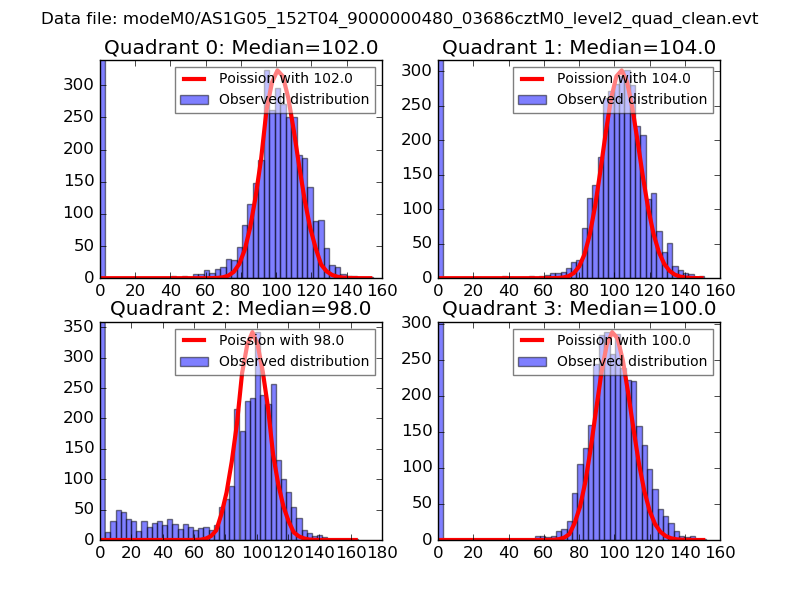 |
 |
| Quadrant-wise count rates Data is divided into 100 sec bins |
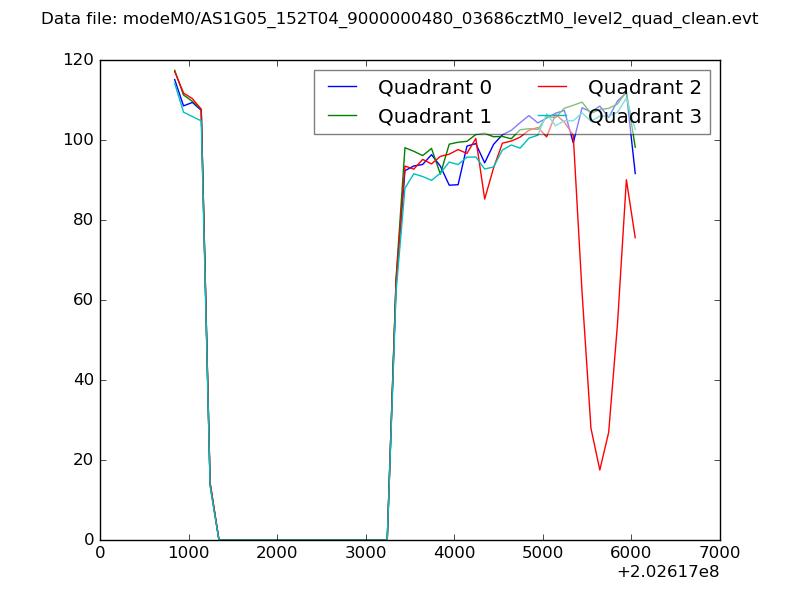 |
|
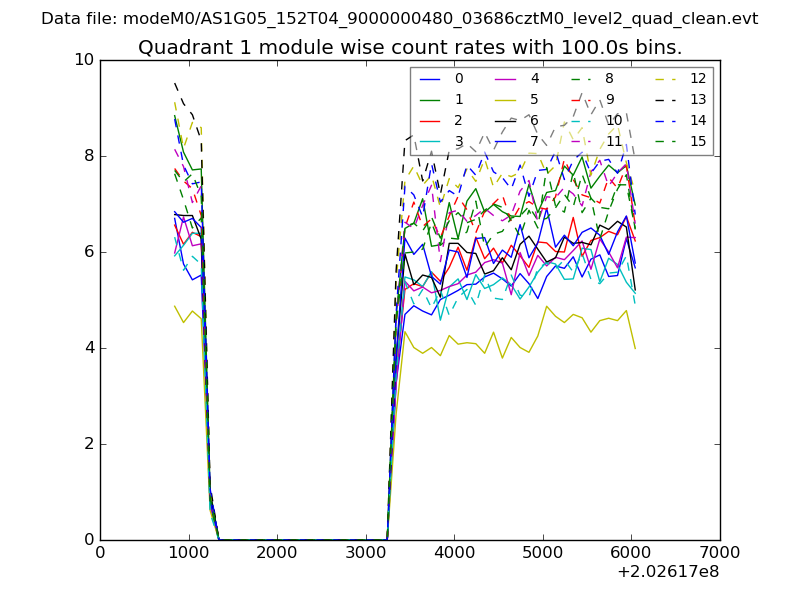
| Module-wise count rates for Quadrant A Data is divided into 100 sec bins |
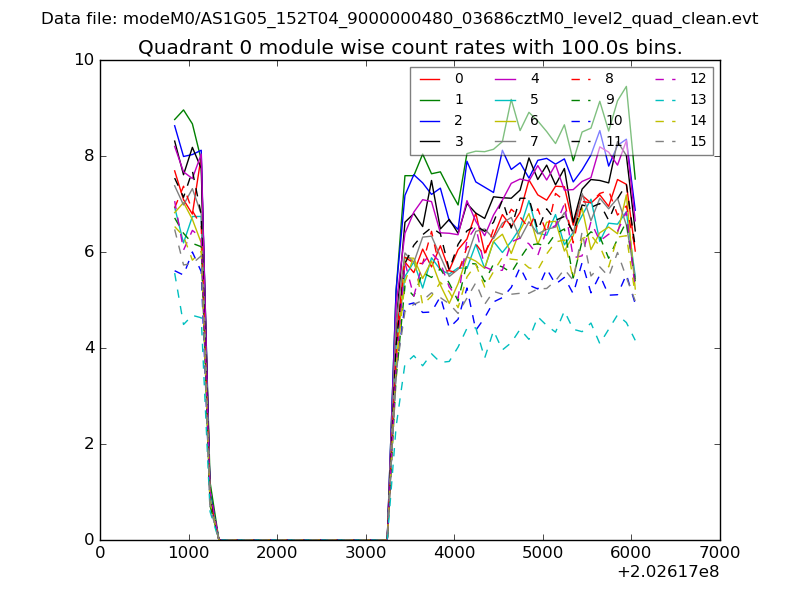 |
 |
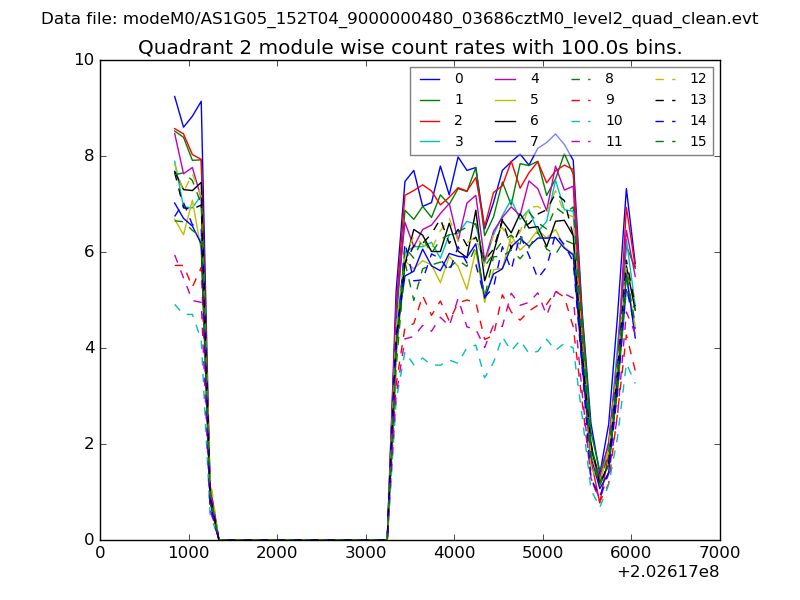
| Module-wise count rates for Quadrant B Data is divided into 100 sec bins |
 |
 |
| Module-wise count rates for Quadrant C Data is divided into 100 sec bins |
 |
 |
| Module-wise count rates for Quadrant D Data is divided into 100 sec bins |
 |
 |
| Parameter | Plot |
|---|---|
| CZT HV Monitor | 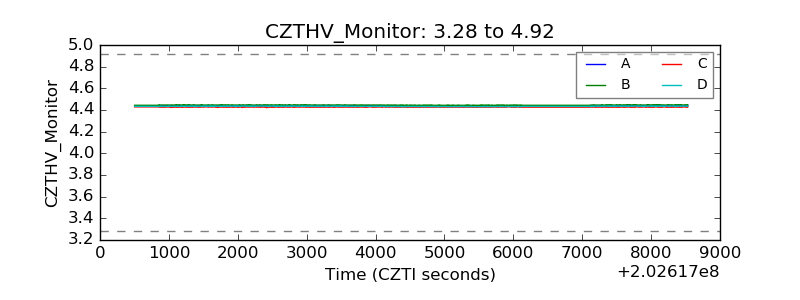 |
| D_VDD | 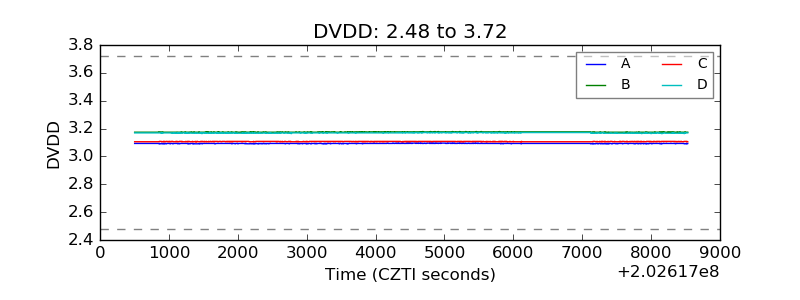 |
| Temperature 1 | 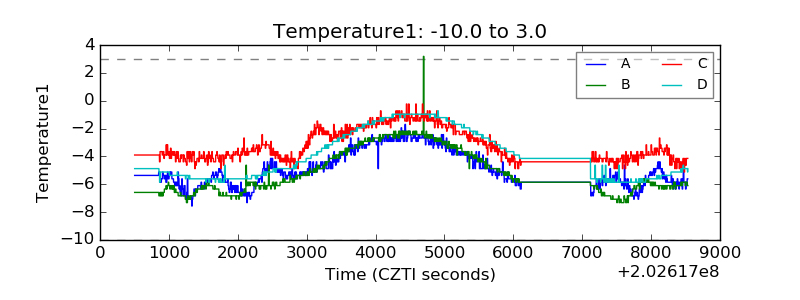 |
| Veto HV Monitor | 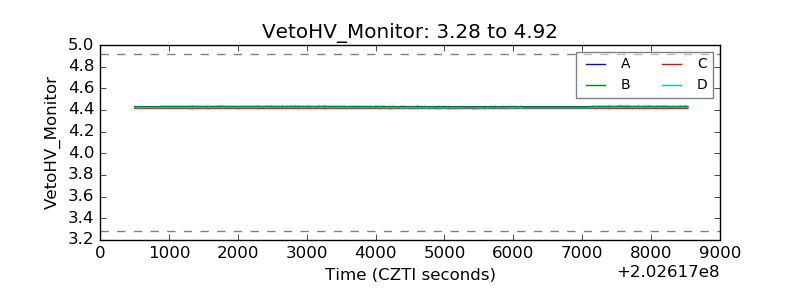 |
| Veto LLD | 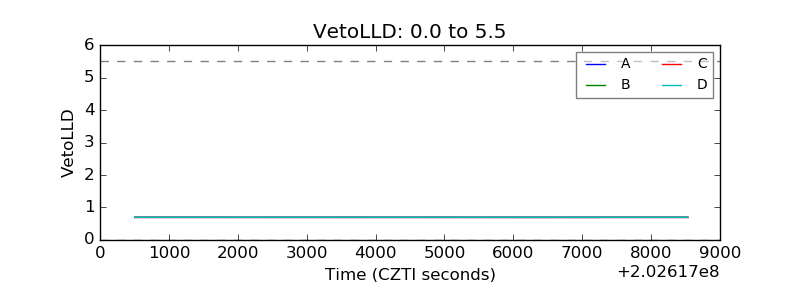 |
| Alpha Counter | 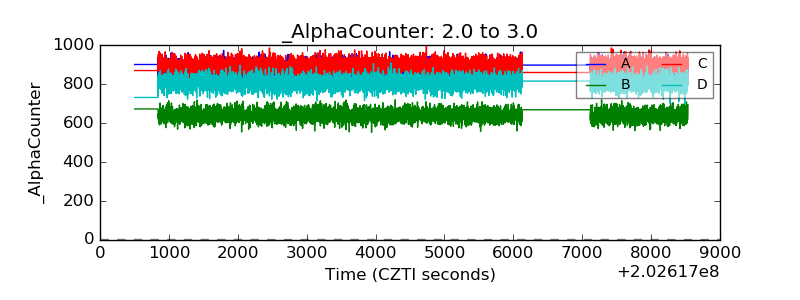 |
| _CPM_Rate | 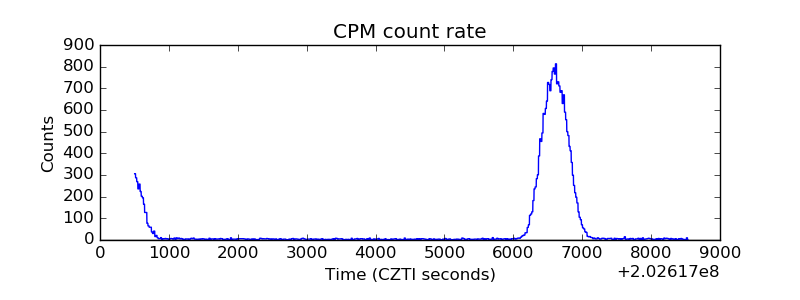 |
| CZT Counter | 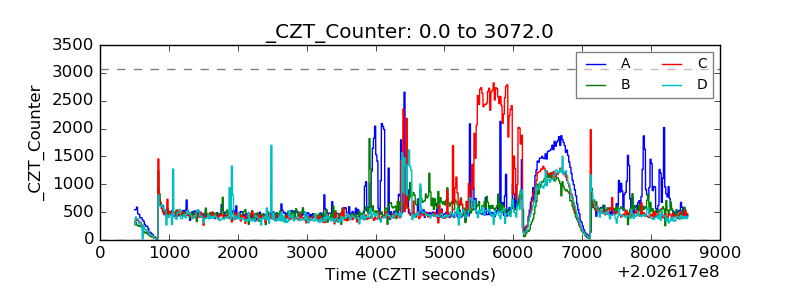 |
| +2.5 Volts monitor |  |
| +5 Volts monitor |  |
| Veto Counter | 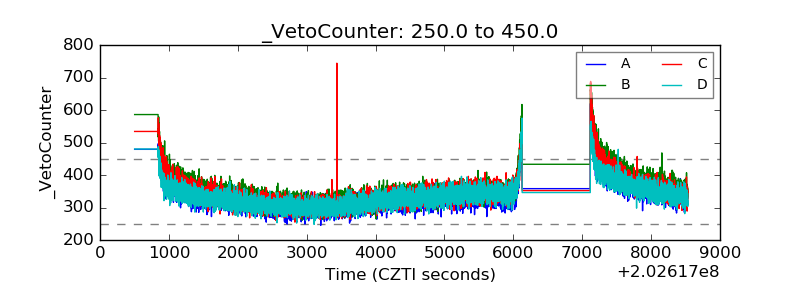 |