| Param | Original file | Final file |
|---|---|---|
| Filename | modeM0/AS1G05_152T04_9000000480_03688cztM0_level2.evt | modeM0/AS1G05_152T04_9000000480_03688cztM0_level2_quad_clean.evt |
| Size (bytes) | 487,192,320 | 56,580,480 |
| Size | 464.6 MB | 54.0 MB |
| Events in quadrant A | 4,700,773 | 308,864 |
| Events in quadrant B | 3,562,795 | 320,523 |
| Events in quadrant C | 3,042,211 | 317,071 |
| Events in quadrant D | 3,004,698 | 309,986 |
| Mode M9 | |||
|---|---|---|---|
| Quadrant | BADHDUFLAG | Total packets | Discarded packets |
| A | 0 | 16 | 0 |
| B | 0 | 16 | 0 |
| C | 0 | 16 | 0 |
| D | 0 | 17 | 0 |
| Mode SS | |||
|---|---|---|---|
| Quadrant | BADHDUFLAG | Total packets | Discarded packets |
| A | 0 | 132 | 0 |
| B | 0 | 132 | 0 |
| C | 0 | 132 | 0 |
| D | 0 | 132 | 0 |
| Mode M0 | |||
|---|---|---|---|
| Quadrant | BADHDUFLAG | Total packets | Discarded packets |
| A | 0 | 18327 | 3 |
| B | 0 | 14523 | 2 |
| C | 0 | 13550 | 2 |
| D | 0 | 13671 | 2 |
| Quadrant | Total seconds | Saturated seconds | Saturation percentage |
|---|---|---|---|
| A | 6544 | 399 | 6.097188% |
| B | 6544 | 104 | 1.589242% |
| C | 6544 | 67 | 1.023839% |
| D | 6544 | 69 | 1.054401% |
Noise dominated data is calculated using 1-second bins in cleaned event files. If a bin has >2000 counts, and if more than 50% of those come from <1% of pixels, then it is considered to be noise-dominated and hence unusable.
| Quadrant | # 1 sec bins | Bins with >0 counts | Bins with >2000 counts | High rate bins dominated by noise | Noise dominated (total time) | Noise dominated (detector-on time) | Marked lightcurve |
|---|---|---|---|---|---|---|---|
| A | 7634 | 6545 | 235 | 235 | 3.08% | 3.59% | 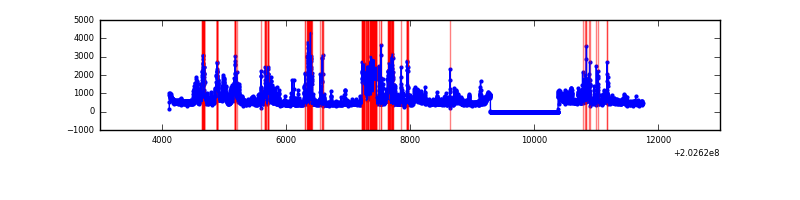 |
| B | 7634 | 6544 | 13 | 13 | 0.17% | 0.20% | 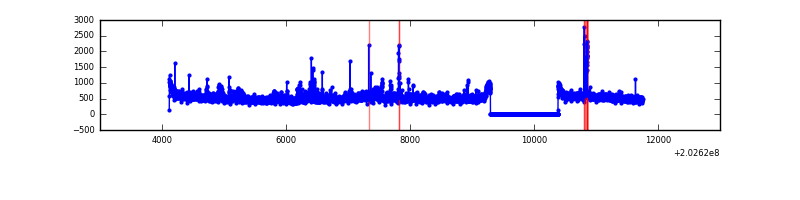 |
| C | 7634 | 6545 | 3 | 3 | 0.04% | 0.05% | 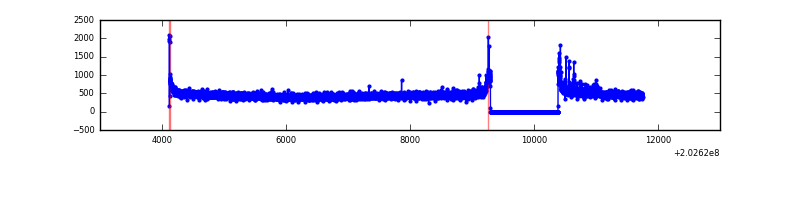 |
| D | 7634 | 6545 | 13 | 13 | 0.17% | 0.20% |  |
Top three noisy pixels from each quadrant. If the there are fewer than three noisy pixels in the level2.evt file, extra rows are filled as -1
| Pixel properties | Quadrant properties | ||||||
|---|---|---|---|---|---|---|---|
| Quadrant | DetID | PixID | Counts | Sigma | Mean | Median | Sigma |
| A | 13 | 251 | 1481179 | 9330.18 | 776 | 759 | 158.7 |
| A | 0 | 50 | 80761 | 504.2 | 776 | 759 | 158.7 |
| A | 13 | 164 | 48409 | 300.31 | 776 | 759 | 158.7 |
| B | 15 | 204 | 134161 | 866.23 | 799 | 780 | 154.0 |
| B | 14 | 167 | 88450 | 569.37 | 799 | 780 | 154.0 |
| B | 5 | 70 | 66193 | 424.82 | 799 | 780 | 154.0 |
| C | 9 | 144 | 28536 | 156.25 | 761 | 765 | 177.7 |
| C | 9 | 247 | 26749 | 146.2 | 761 | 765 | 177.7 |
| C | 2 | 53 | 10858 | 56.79 | 761 | 765 | 177.7 |
| D | 13 | 239 | 61607 | 329.26 | 759 | 737 | 184.9 |
| D | 5 | 233 | 27423 | 144.35 | 759 | 737 | 184.9 |
| D | 2 | 14 | 19339 | 100.62 | 759 | 737 | 184.9 |
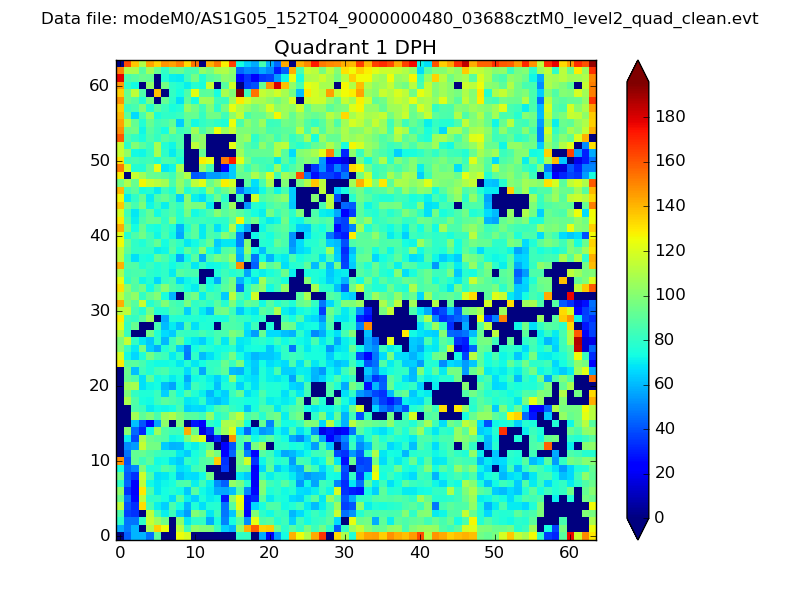
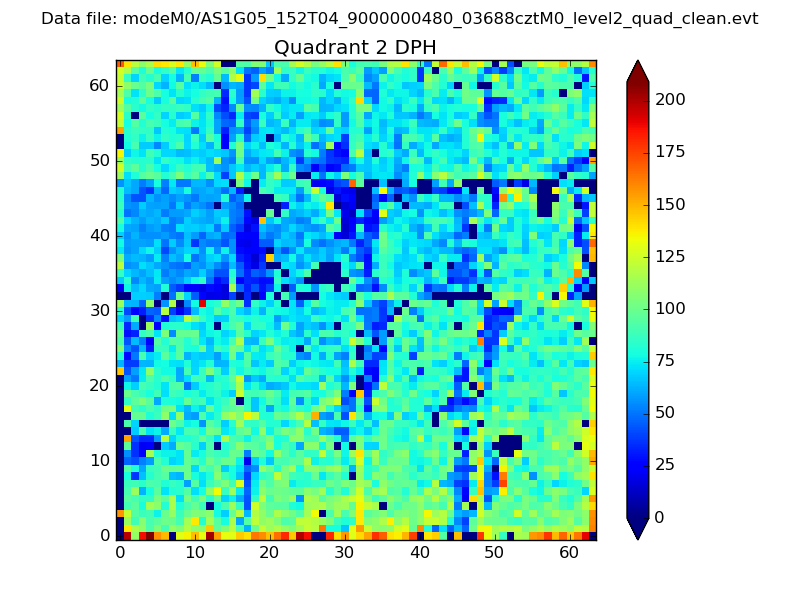
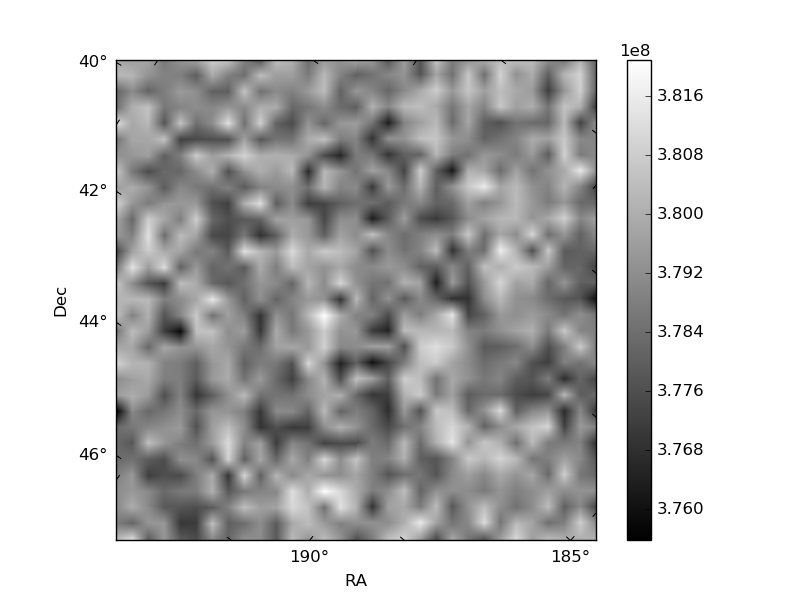
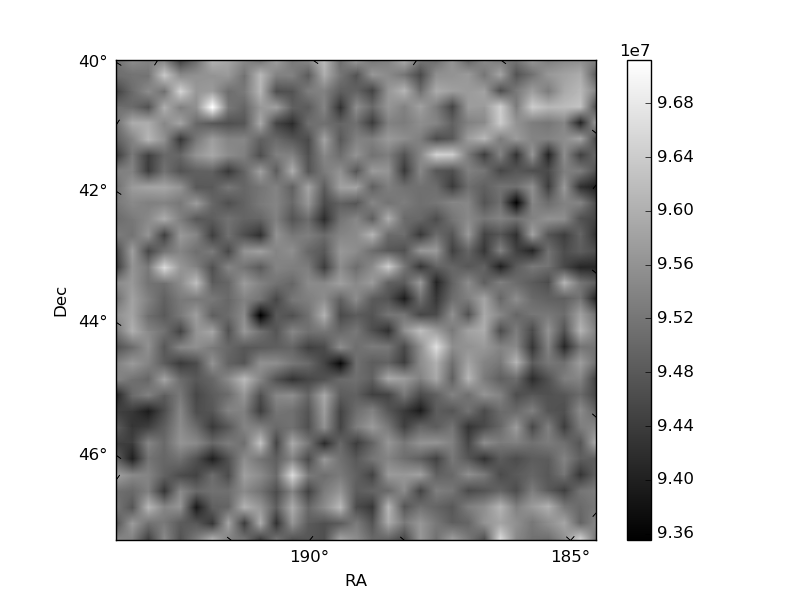
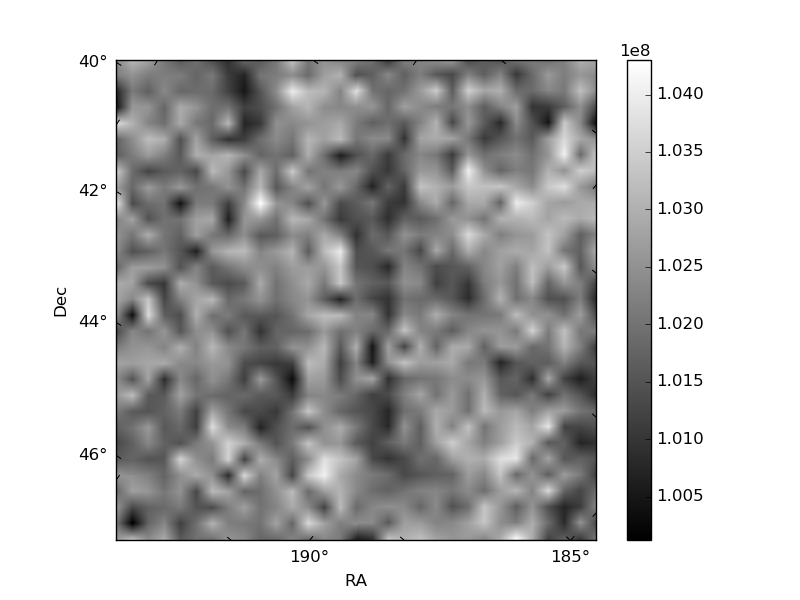
Histogram calculated using DETX and DETY for each event in the final _common_clean file
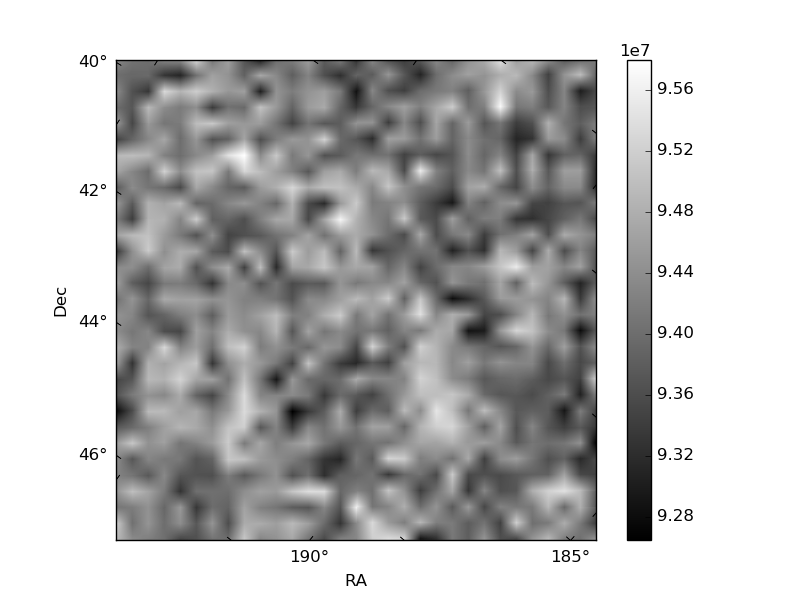
| Quadrant A | 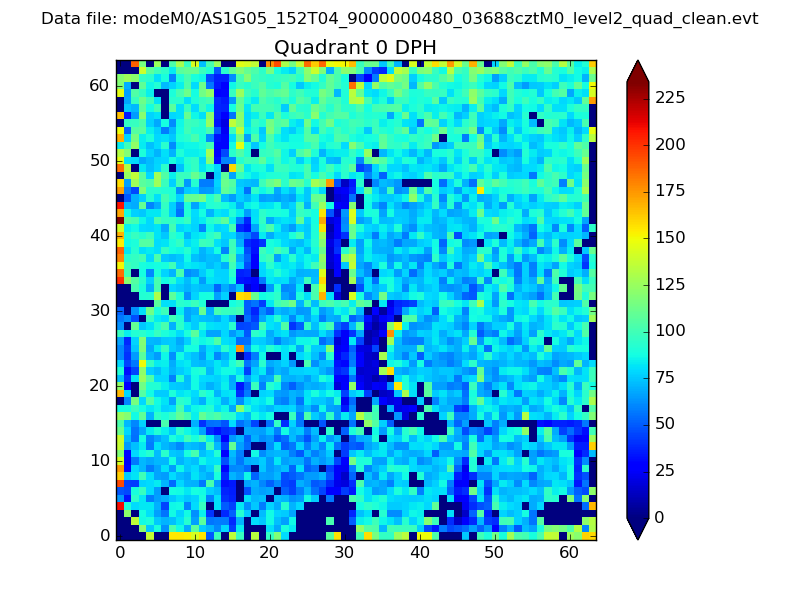 |
 |
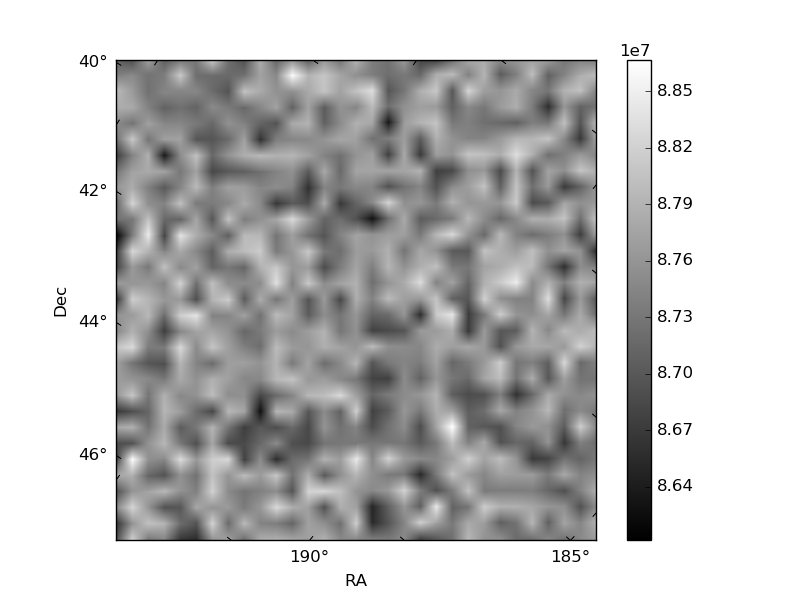
Quadrant B |
|---|---|---|---|
| Quadrant D | 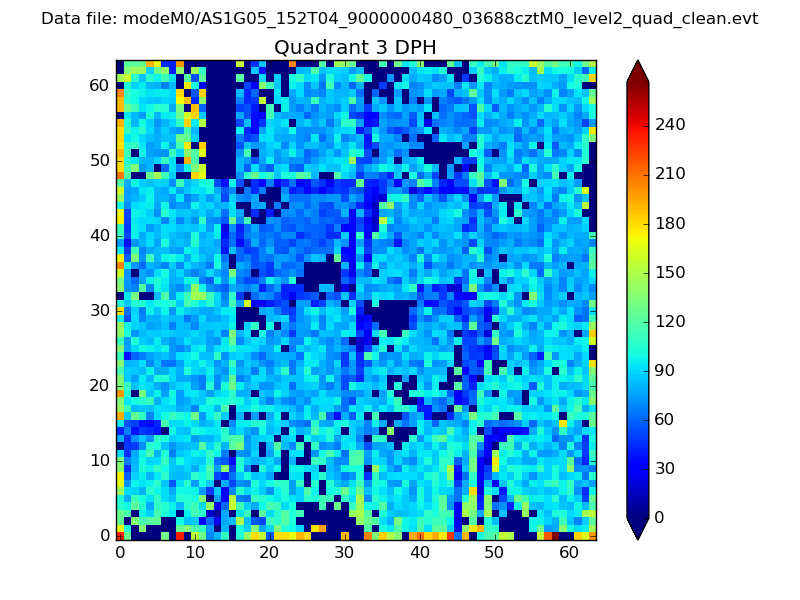 |
 |
Quadrant C |
| Plot type | Count rate plots | Images |
|---|---|---|
| Comparison with Poisson distribution Blue bars denote a histogram of data divided into 1 sec bins. Red curve is a Poisson curve with rate = median count rate of data. |
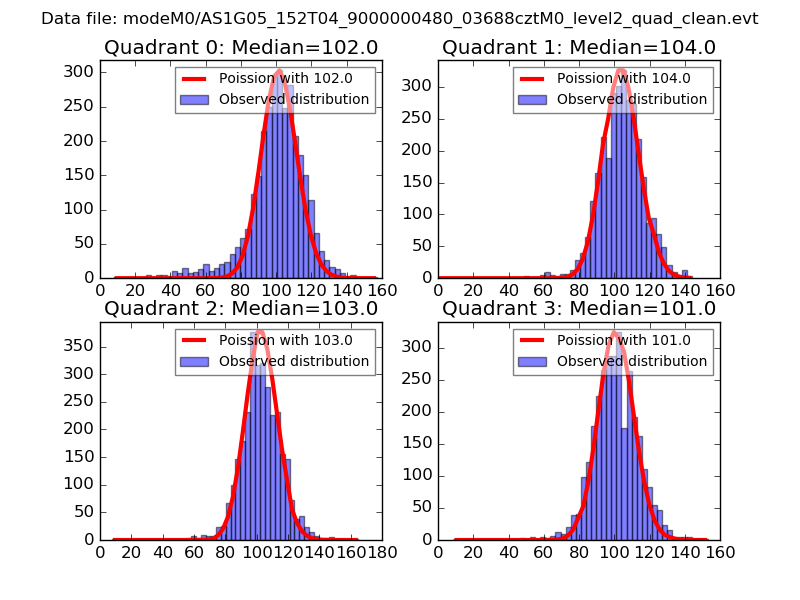 |
 |
| Quadrant-wise count rates Data is divided into 100 sec bins |
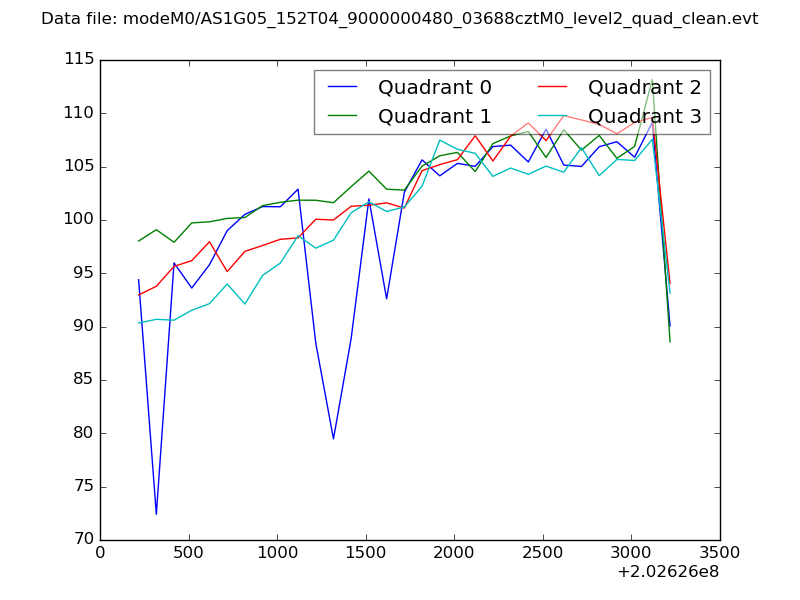 |
|
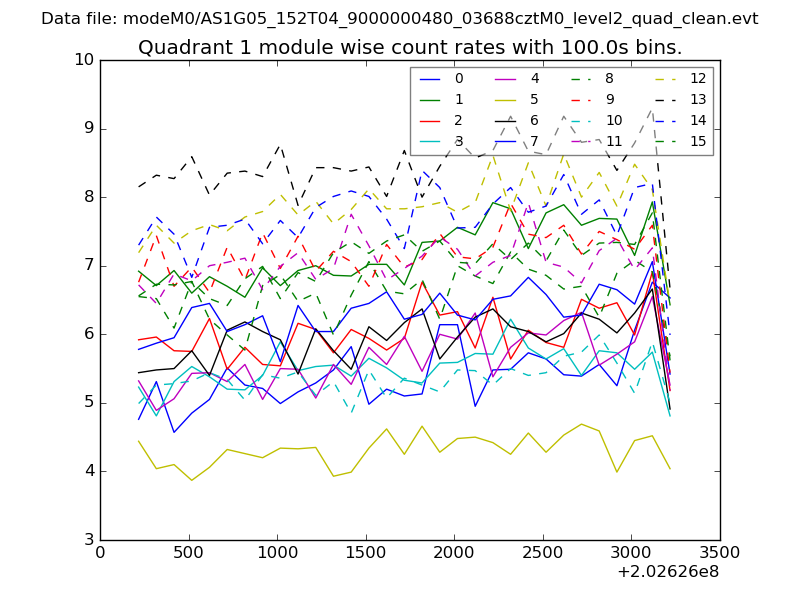
| Module-wise count rates for Quadrant A Data is divided into 100 sec bins |
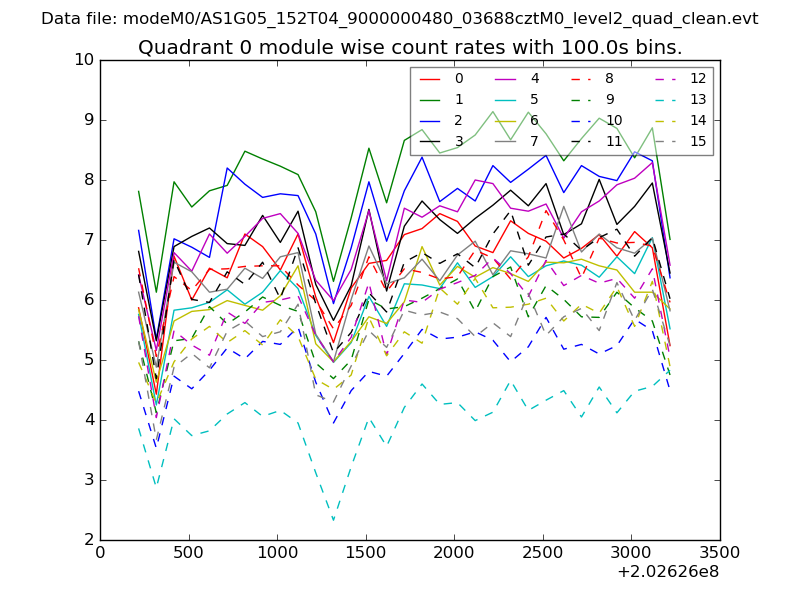 |
 |
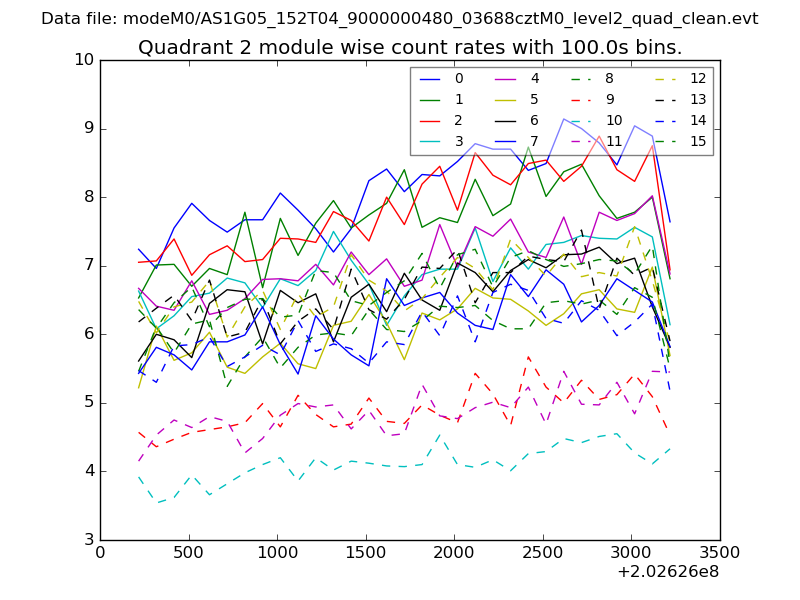
| Module-wise count rates for Quadrant B Data is divided into 100 sec bins |
 |
 |
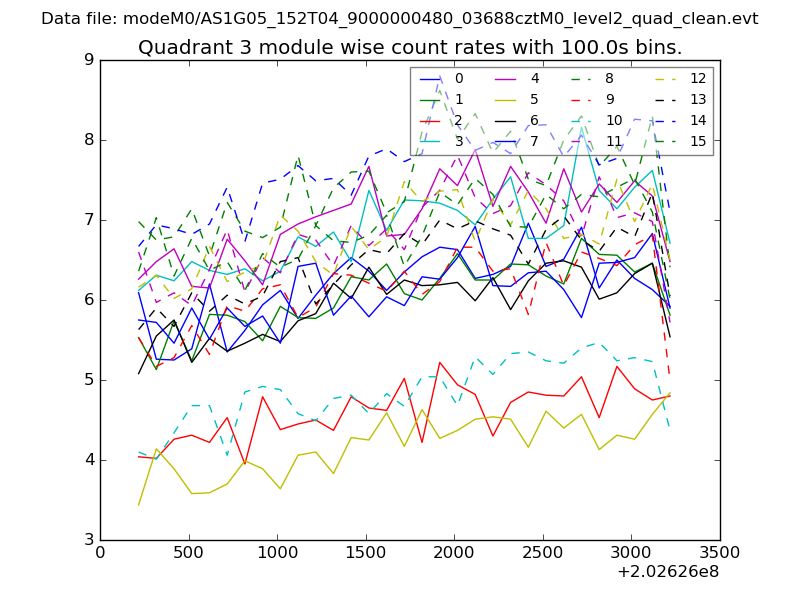
| Module-wise count rates for Quadrant C Data is divided into 100 sec bins |
 |
 |
| Module-wise count rates for Quadrant D Data is divided into 100 sec bins |
 |
 |
| Parameter | Plot |
|---|---|
| CZT HV Monitor | 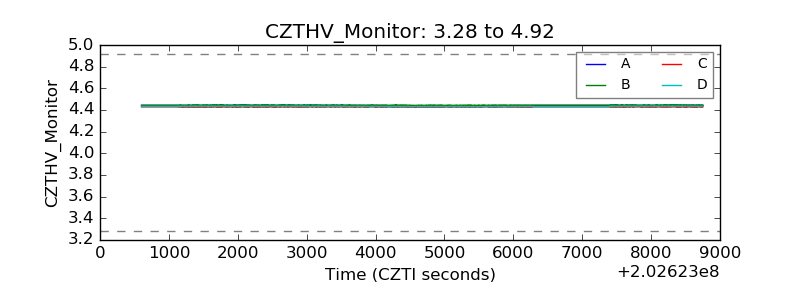 |
| D_VDD | 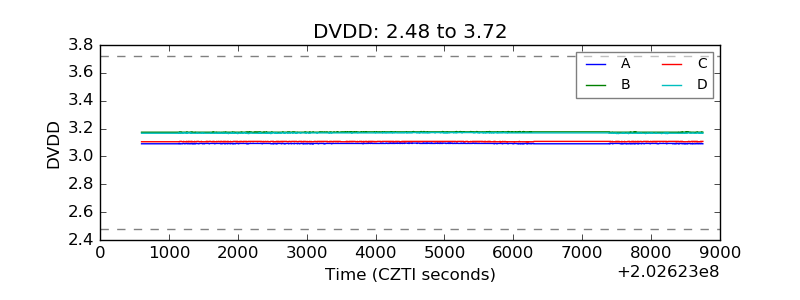 |
| Temperature 1 | 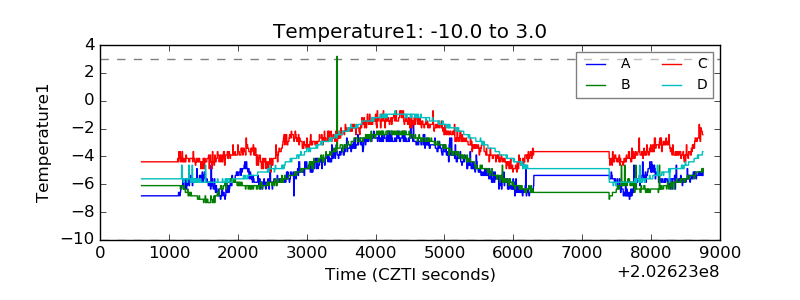 |
| Veto HV Monitor | 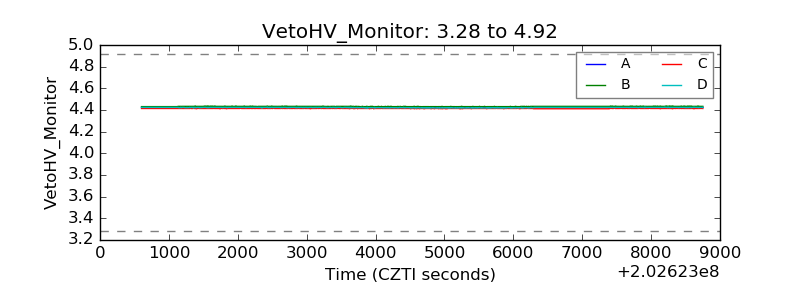 |
| Veto LLD | 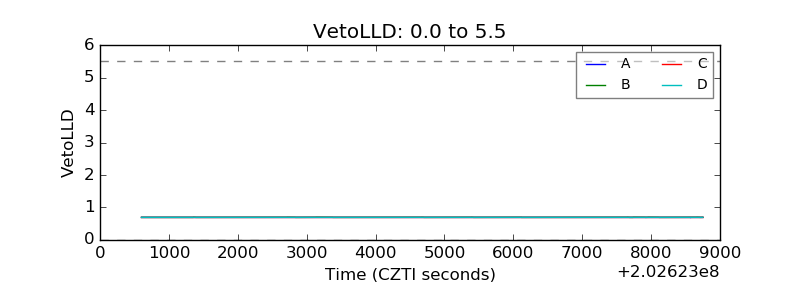 |
| Alpha Counter | 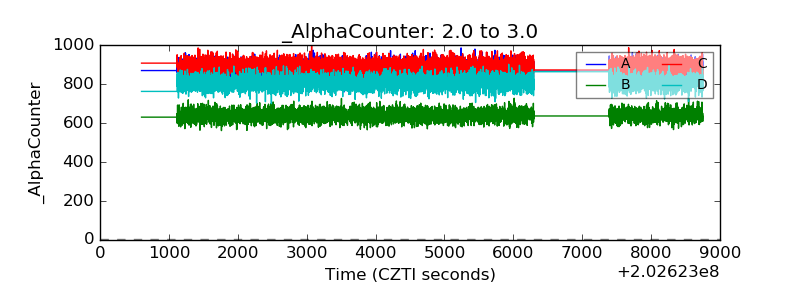 |
| _CPM_Rate | 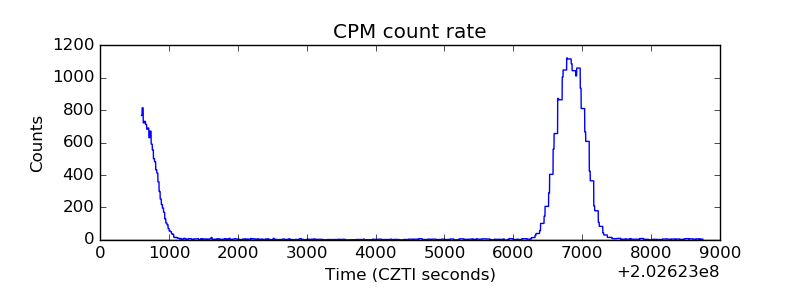 |
| CZT Counter | 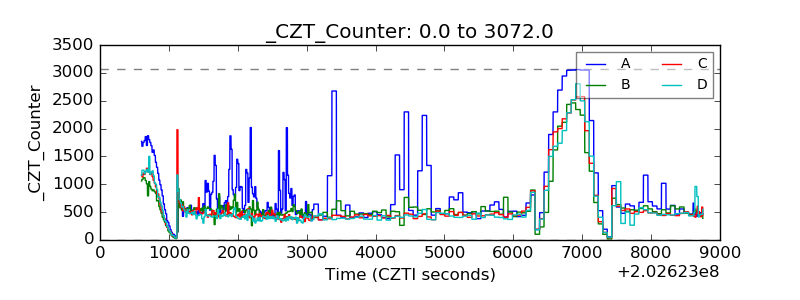 |
| +2.5 Volts monitor |  |
| +5 Volts monitor |  |
| Veto Counter | 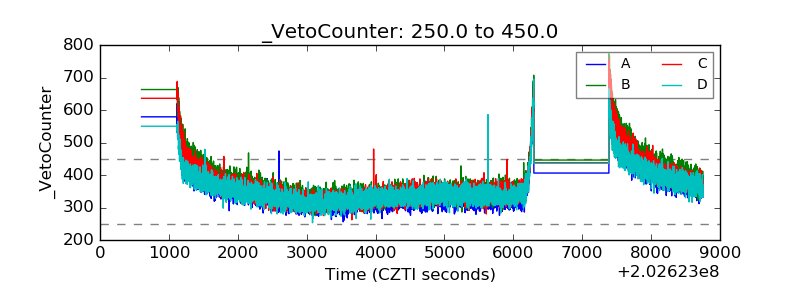 |