| Param | Original file | Final file |
|---|---|---|
| Filename | modeM0/AS1G05_152T04_9000000480_03689cztM0_level2.evt | modeM0/AS1G05_152T04_9000000480_03689cztM0_level2_quad_clean.evt |
| Size (bytes) | 512,190,720 | 63,103,680 |
| Size | 488.5 MB | 60.2 MB |
| Events in quadrant A | 4,412,058 | 355,170 |
| Events in quadrant B | 4,190,559 | 374,625 |
| Events in quadrant C | 3,155,578 | 371,807 |
| Events in quadrant D | 3,315,213 | 357,991 |
| Mode M9 | |||
|---|---|---|---|
| Quadrant | BADHDUFLAG | Total packets | Discarded packets |
| A | 0 | 17 | 0 |
| B | 0 | 17 | 0 |
| C | 0 | 17 | 0 |
| D | 0 | 18 | 0 |
| Mode SS | |||
|---|---|---|---|
| Quadrant | BADHDUFLAG | Total packets | Discarded packets |
| A | 0 | 132 | 0 |
| B | 0 | 132 | 0 |
| C | 0 | 132 | 0 |
| D | 0 | 132 | 0 |
| Mode M0 | |||
|---|---|---|---|
| Quadrant | BADHDUFLAG | Total packets | Discarded packets |
| A | 0 | 17316 | 3 |
| B | 0 | 16995 | 2 |
| C | 0 | 13643 | 2 |
| D | 0 | 14241 | 2 |
| Quadrant | Total seconds | Saturated seconds | Saturation percentage |
|---|---|---|---|
| A | 6459 | 444 | 6.874129% |
| B | 6459 | 122 | 1.888837% |
| C | 6459 | 65 | 1.006348% |
| D | 6459 | 105 | 1.625639% |
Noise dominated data is calculated using 1-second bins in cleaned event files. If a bin has >2000 counts, and if more than 50% of those come from <1% of pixels, then it is considered to be noise-dominated and hence unusable.
| Quadrant | # 1 sec bins | Bins with >0 counts | Bins with >2000 counts | High rate bins dominated by noise | Noise dominated (total time) | Noise dominated (detector-on time) | Marked lightcurve |
|---|---|---|---|---|---|---|---|
| A | 7644 | 6460 | 285 | 285 | 3.73% | 4.41% | 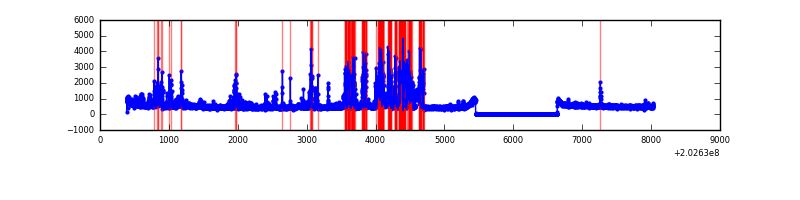 |
| B | 7644 | 6460 | 12 | 12 | 0.16% | 0.19% | 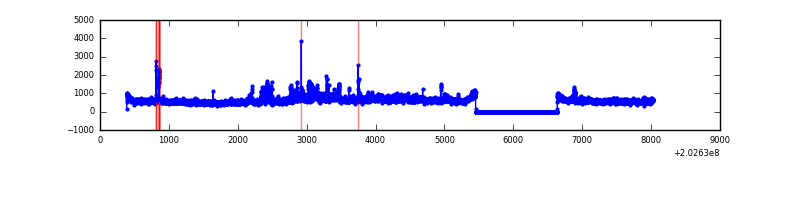 |
| C | 7644 | 6460 | 5 | 5 | 0.07% | 0.08% | 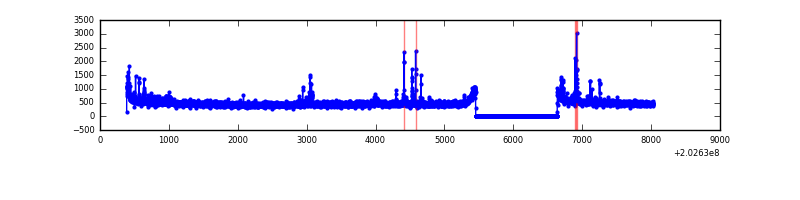 |
| D | 7644 | 6460 | 49 | 49 | 0.64% | 0.76% | 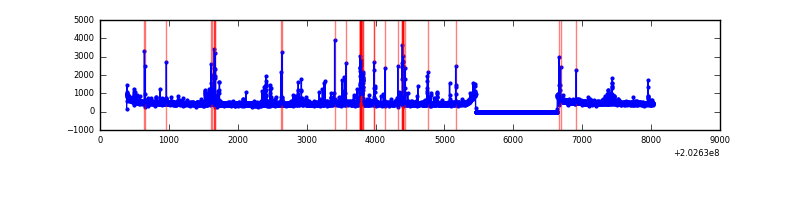 |
Top three noisy pixels from each quadrant. If the there are fewer than three noisy pixels in the level2.evt file, extra rows are filled as -1
| Pixel properties | Quadrant properties | ||||||
|---|---|---|---|---|---|---|---|
| Quadrant | DetID | PixID | Counts | Sigma | Mean | Median | Sigma |
| A | 13 | 251 | 1193510 | 7522.44 | 784 | 767 | 158.6 |
| A | 0 | 118 | 52458 | 326.01 | 784 | 767 | 158.6 |
| A | 0 | 50 | 46002 | 285.29 | 784 | 767 | 158.6 |
| B | 15 | 204 | 290560 | 1864.1 | 811 | 793 | 155.4 |
| B | 14 | 167 | 276596 | 1774.27 | 811 | 793 | 155.4 |
| B | 3 | 0 | 207616 | 1330.51 | 811 | 793 | 155.4 |
| C | 2 | 53 | 79936 | 441.99 | 771 | 775 | 179.1 |
| C | 9 | 144 | 39095 | 213.96 | 771 | 775 | 179.1 |
| C | 9 | 247 | 17590 | 93.88 | 771 | 775 | 179.1 |
| D | 2 | 37 | 83151 | 444.6 | 772 | 751 | 185.3 |
| D | 10 | 172 | 70700 | 377.42 | 772 | 751 | 185.3 |
| D | 13 | 239 | 43806 | 232.31 | 772 | 751 | 185.3 |
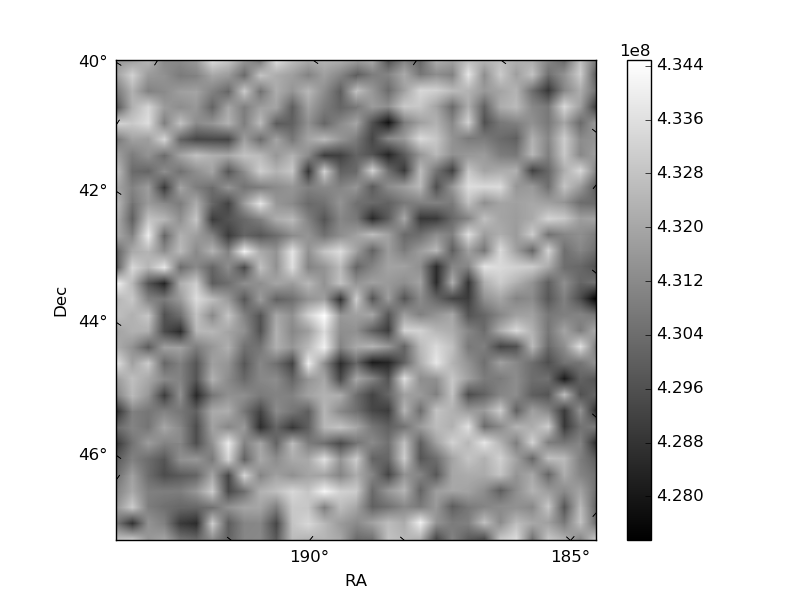
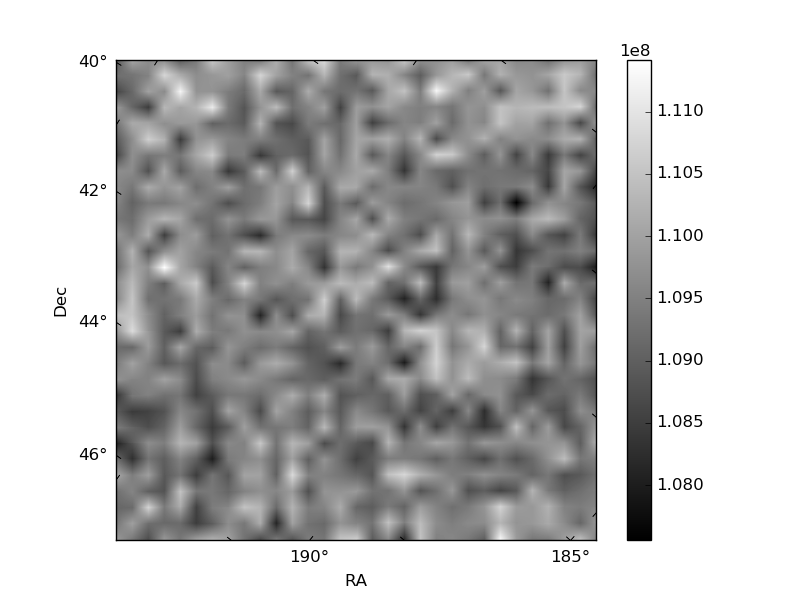
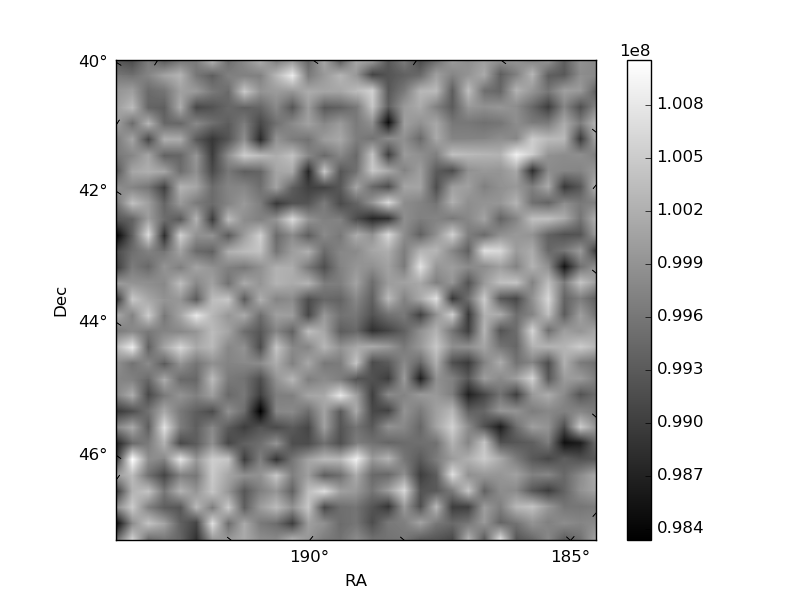
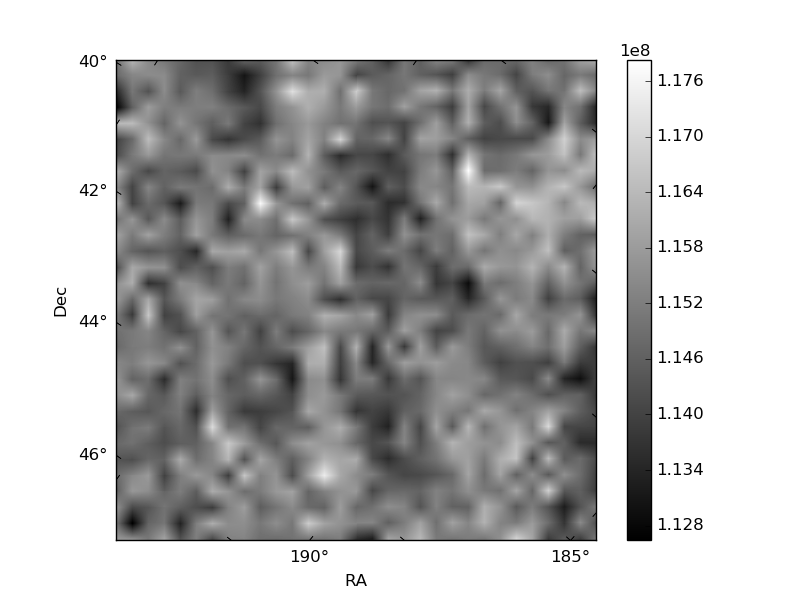
Histogram calculated using DETX and DETY for each event in the final _common_clean file
| Quadrant A | 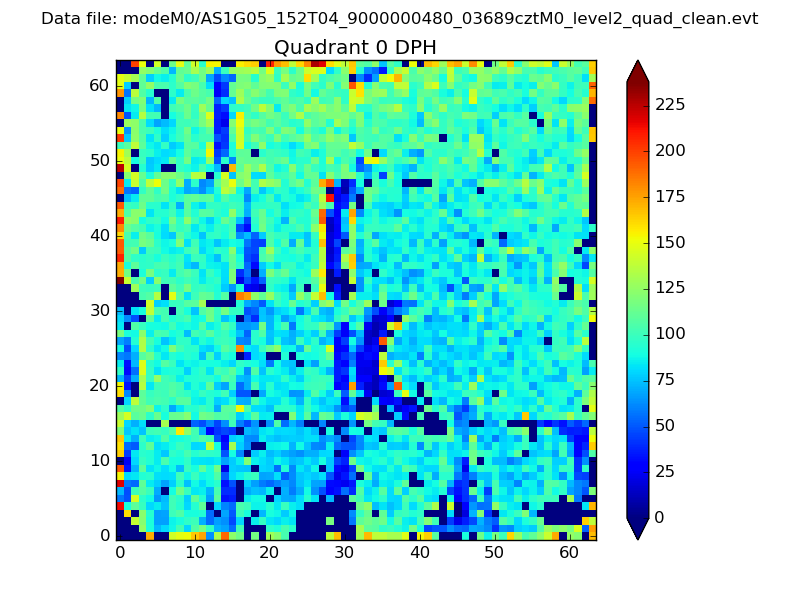 |
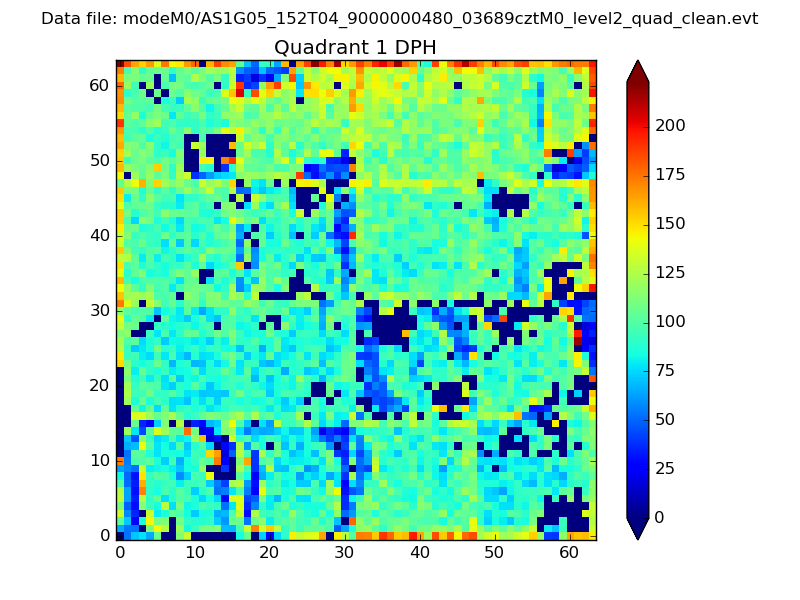 |
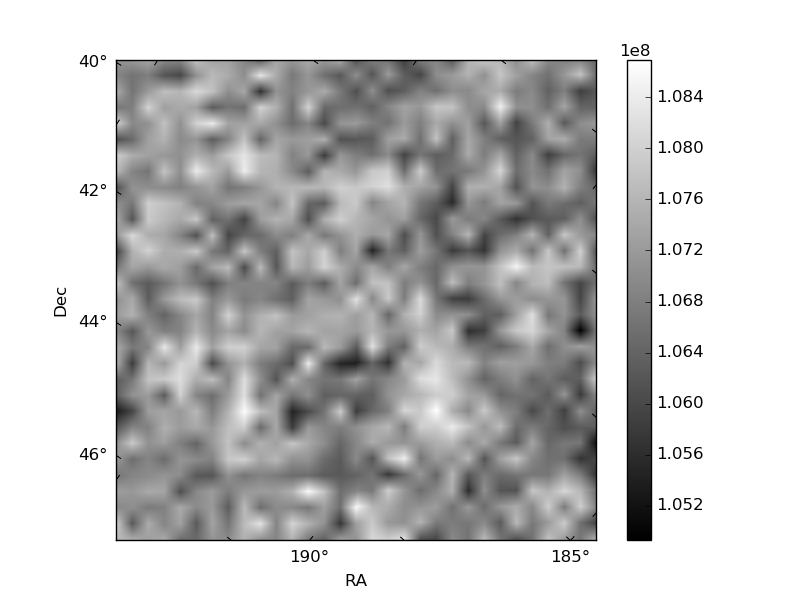
Quadrant B |
|---|---|---|---|
| Quadrant D | 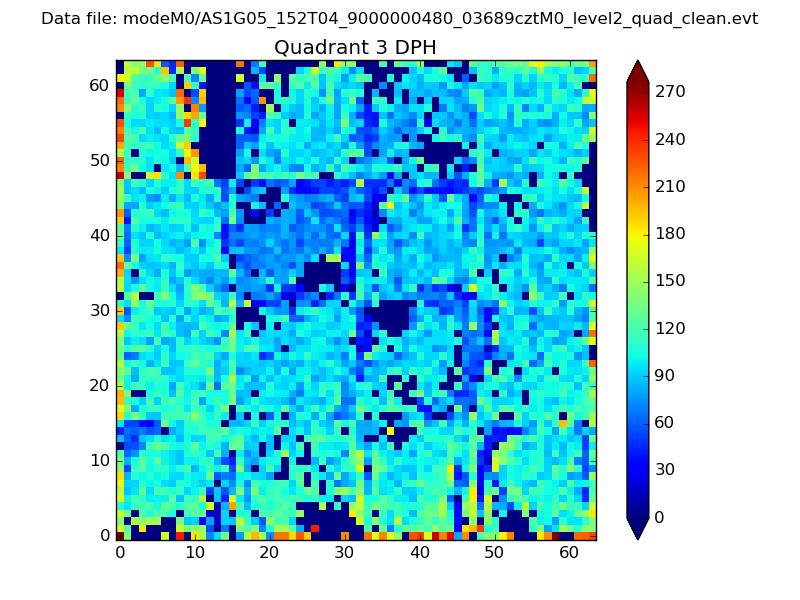 |
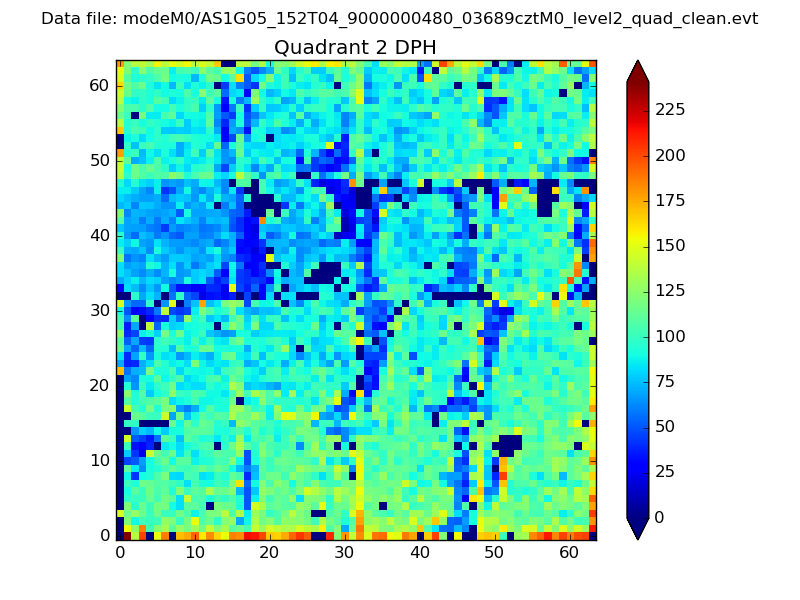 |
Quadrant C |
| Plot type | Count rate plots | Images |
|---|---|---|
| Comparison with Poisson distribution Blue bars denote a histogram of data divided into 1 sec bins. Red curve is a Poisson curve with rate = median count rate of data. |
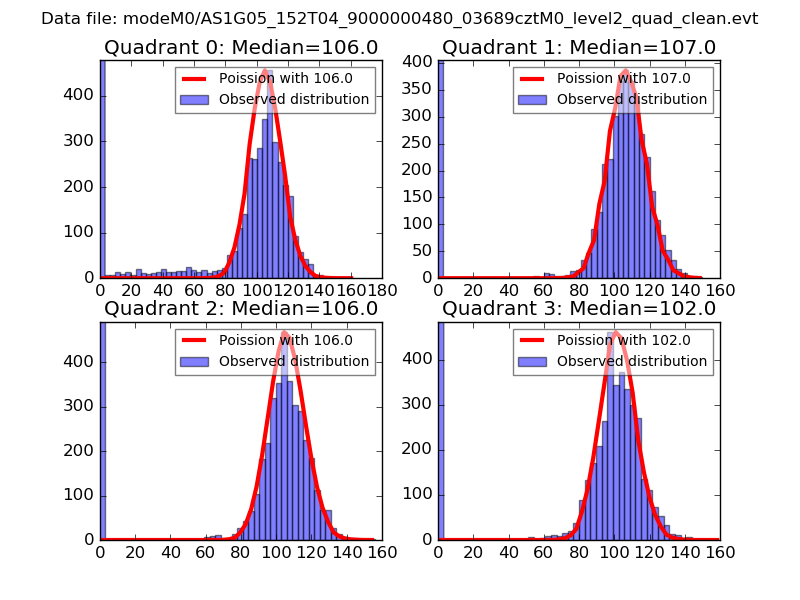 |
 |
| Quadrant-wise count rates Data is divided into 100 sec bins |
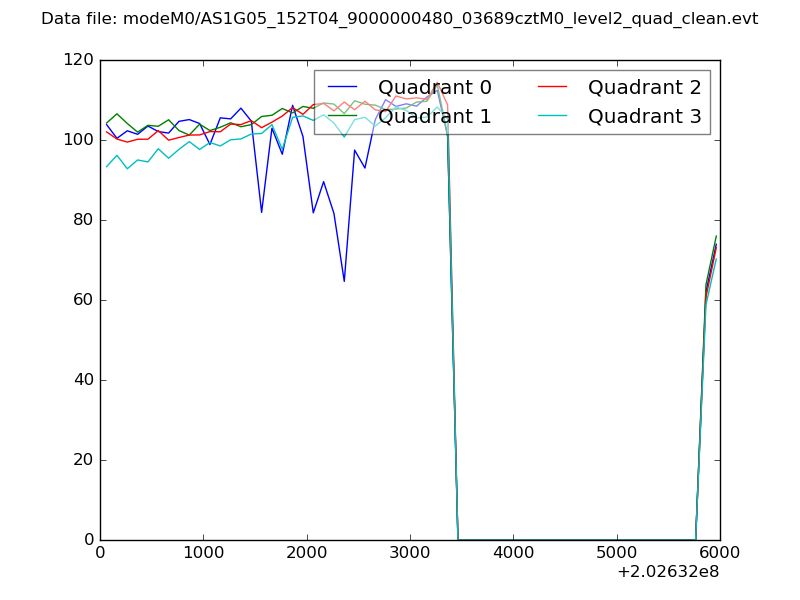 |
|
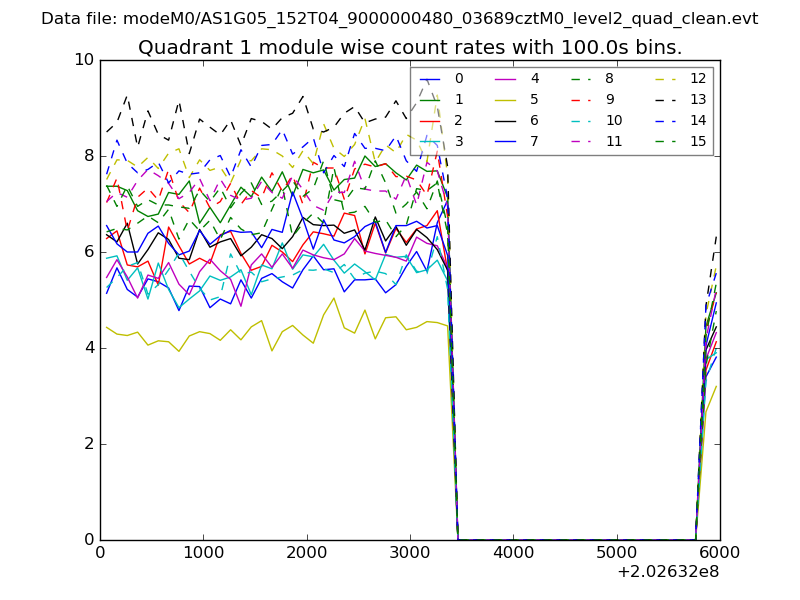
| Module-wise count rates for Quadrant A Data is divided into 100 sec bins |
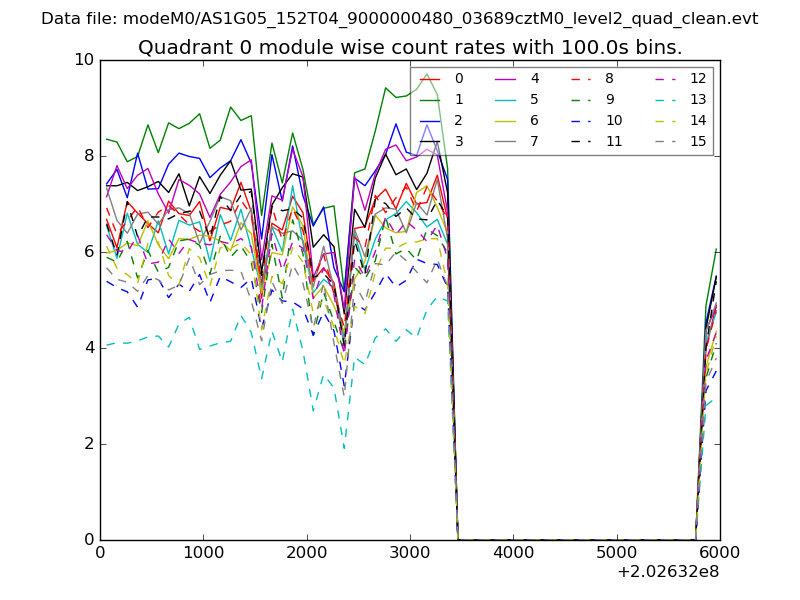 |
 |
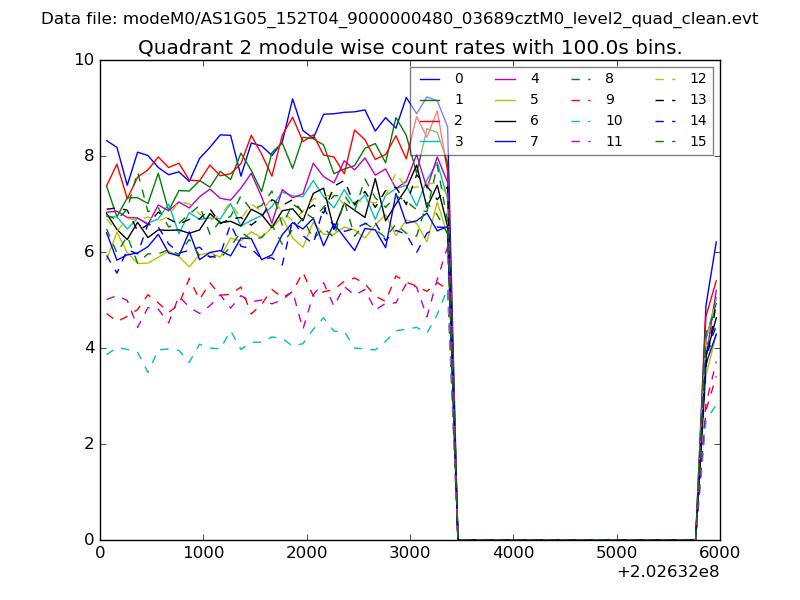
| Module-wise count rates for Quadrant B Data is divided into 100 sec bins |
 |
 |
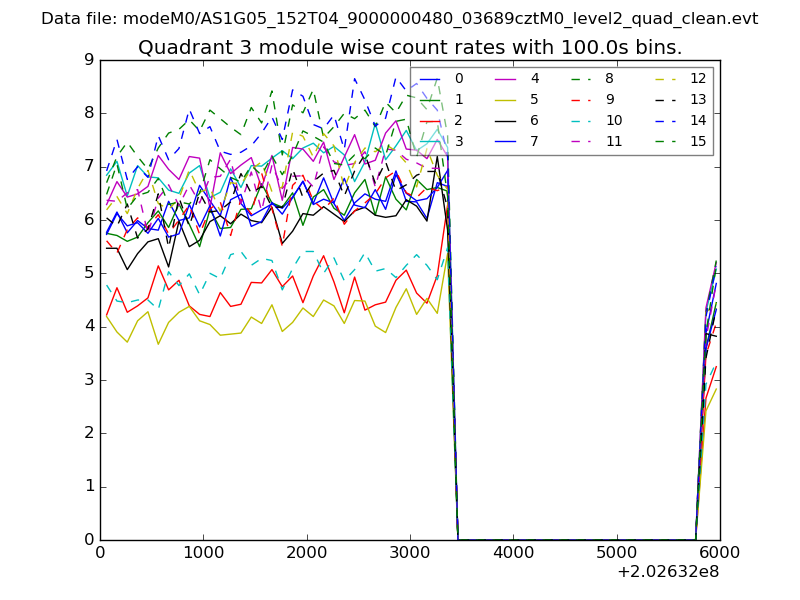
| Module-wise count rates for Quadrant C Data is divided into 100 sec bins |
 |
 |
| Module-wise count rates for Quadrant D Data is divided into 100 sec bins |
 |
 |
| Parameter | Plot |
|---|---|
| CZT HV Monitor | 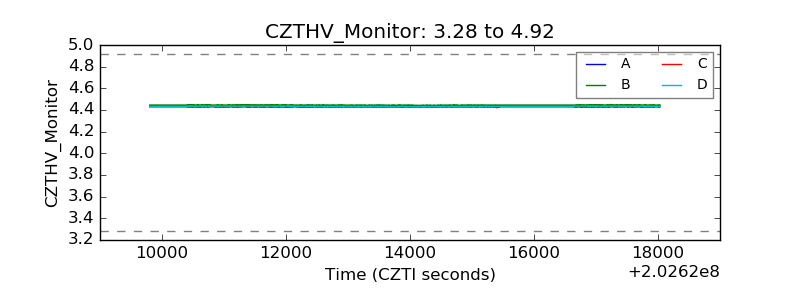 |
| D_VDD | 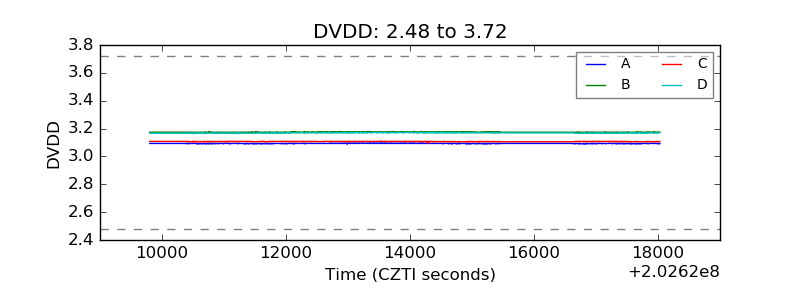 |
| Temperature 1 | 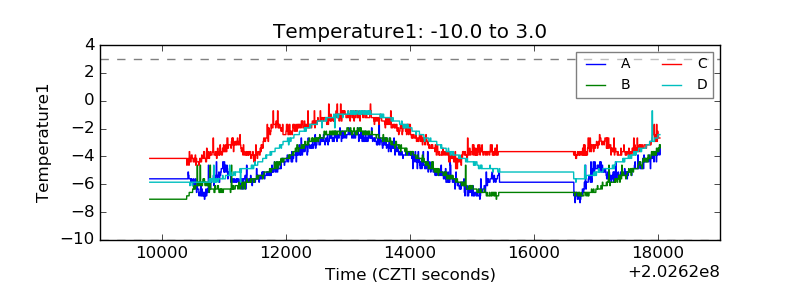 |
| Veto HV Monitor | 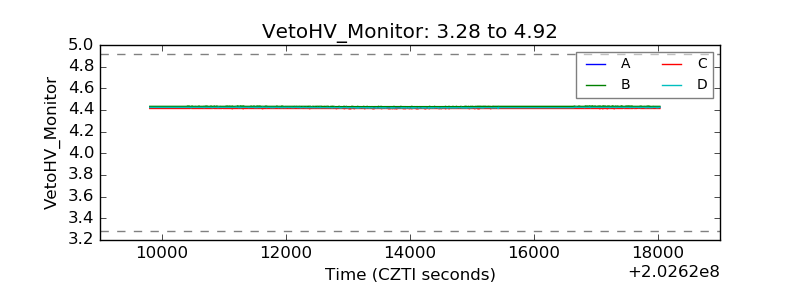 |
| Veto LLD | 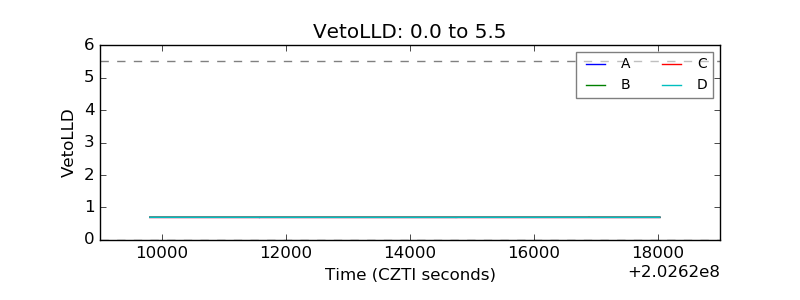 |
| Alpha Counter | 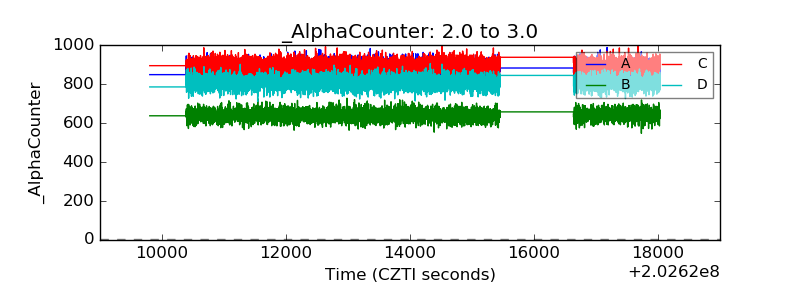 |
| _CPM_Rate | 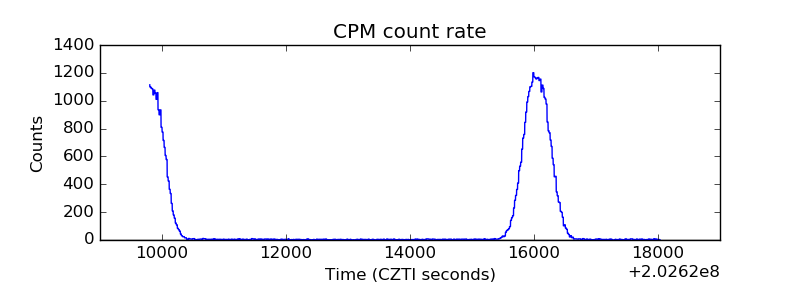 |
| CZT Counter | 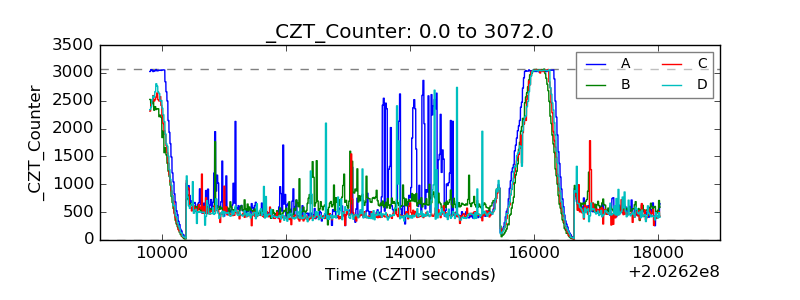 |
| +2.5 Volts monitor |  |
| +5 Volts monitor |  |
| Veto Counter | 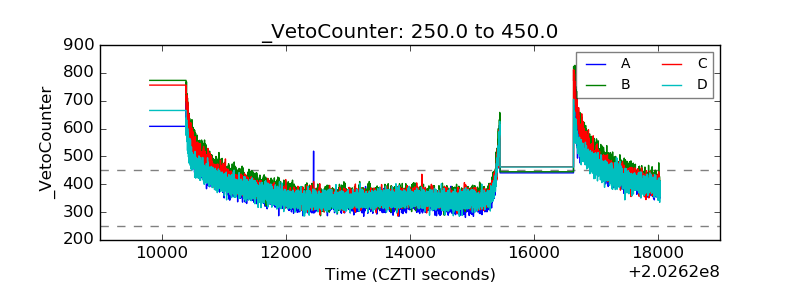 |