| Param | Original file | Final file |
|---|---|---|
| Filename | modeM0/AS1G05_152T04_9000000480_03690cztM0_level2.evt | modeM0/AS1G05_152T04_9000000480_03690cztM0_level2_quad_clean.evt |
| Size (bytes) | 487,817,280 | 76,671,360 |
| Size | 465.2 MB | 73.1 MB |
| Events in quadrant A | 3,649,050 | 473,430 |
| Events in quadrant B | 4,174,735 | 475,185 |
| Events in quadrant C | 3,137,861 | 467,830 |
| Events in quadrant D | 3,374,180 | 455,415 |
| Mode M9 | |||
|---|---|---|---|
| Quadrant | BADHDUFLAG | Total packets | Discarded packets |
| A | 0 | 20 | 0 |
| B | 0 | 20 | 0 |
| C | 0 | 20 | 0 |
| D | 0 | 21 | 0 |
| Mode SS | |||
|---|---|---|---|
| Quadrant | BADHDUFLAG | Total packets | Discarded packets |
| A | 0 | 130 | 0 |
| B | 0 | 130 | 0 |
| C | 0 | 130 | 0 |
| D | 0 | 130 | 0 |
| Mode M0 | |||
|---|---|---|---|
| Quadrant | BADHDUFLAG | Total packets | Discarded packets |
| A | 0 | 14799 | 3 |
| B | 0 | 17281 | 2 |
| C | 0 | 13514 | 2 |
| D | 0 | 14360 | 2 |
| Quadrant | Total seconds | Saturated seconds | Saturation percentage |
|---|---|---|---|
| A | 6449 | 231 | 3.581951% |
| B | 6449 | 171 | 2.651574% |
| C | 6449 | 107 | 1.659172% |
| D | 6449 | 135 | 2.093348% |
Noise dominated data is calculated using 1-second bins in cleaned event files. If a bin has >2000 counts, and if more than 50% of those come from <1% of pixels, then it is considered to be noise-dominated and hence unusable.
| Quadrant | # 1 sec bins | Bins with >0 counts | Bins with >2000 counts | High rate bins dominated by noise | Noise dominated (total time) | Noise dominated (detector-on time) | Marked lightcurve |
|---|---|---|---|---|---|---|---|
| A | 7649 | 6449 | 73 | 73 | 0.95% | 1.13% | 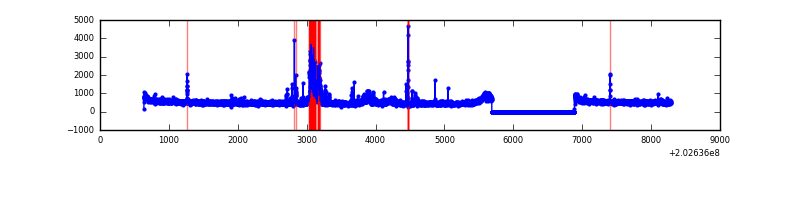 |
| B | 7649 | 6449 | 13 | 13 | 0.17% | 0.20% | 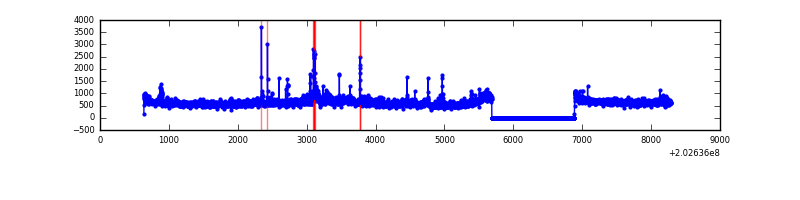 |
| C | 7649 | 6450 | 4 | 4 | 0.05% | 0.06% | 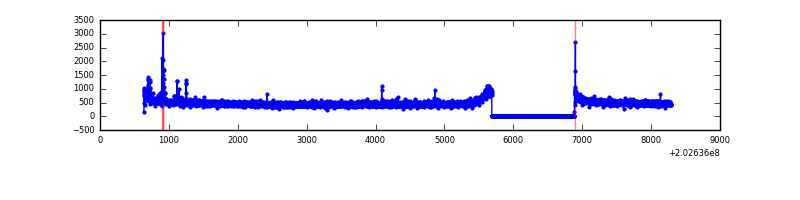 |
| D | 7649 | 6449 | 22 | 22 | 0.29% | 0.34% | 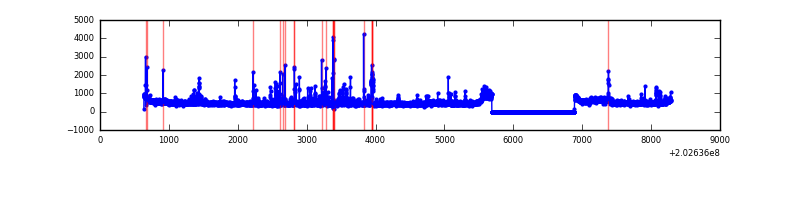 |
Top three noisy pixels from each quadrant. If the there are fewer than three noisy pixels in the level2.evt file, extra rows are filled as -1
| Pixel properties | Quadrant properties | ||||||
|---|---|---|---|---|---|---|---|
| Quadrant | DetID | PixID | Counts | Sigma | Mean | Median | Sigma |
| A | 13 | 251 | 354631 | 2115.43 | 823 | 805 | 167.3 |
| A | 0 | 50 | 51527 | 303.25 | 823 | 805 | 167.3 |
| A | 3 | 1 | 34187 | 199.58 | 823 | 805 | 167.3 |
| B | 14 | 167 | 491110 | 3102.18 | 828 | 810 | 158.0 |
| B | 15 | 204 | 191835 | 1208.64 | 828 | 810 | 158.0 |
| B | 3 | 0 | 179786 | 1132.4 | 828 | 810 | 158.0 |
| C | 2 | 53 | 47707 | 257.01 | 788 | 793 | 182.5 |
| C | 13 | 61 | 6684 | 32.27 | 788 | 793 | 182.5 |
| C | 12 | 4 | 5074 | 23.45 | 788 | 793 | 182.5 |
| D | 2 | 37 | 155781 | 814.28 | 794 | 770 | 190.4 |
| D | 5 | 233 | 59960 | 310.93 | 794 | 770 | 190.4 |
| D | 9 | 35 | 54180 | 280.56 | 794 | 770 | 190.4 |
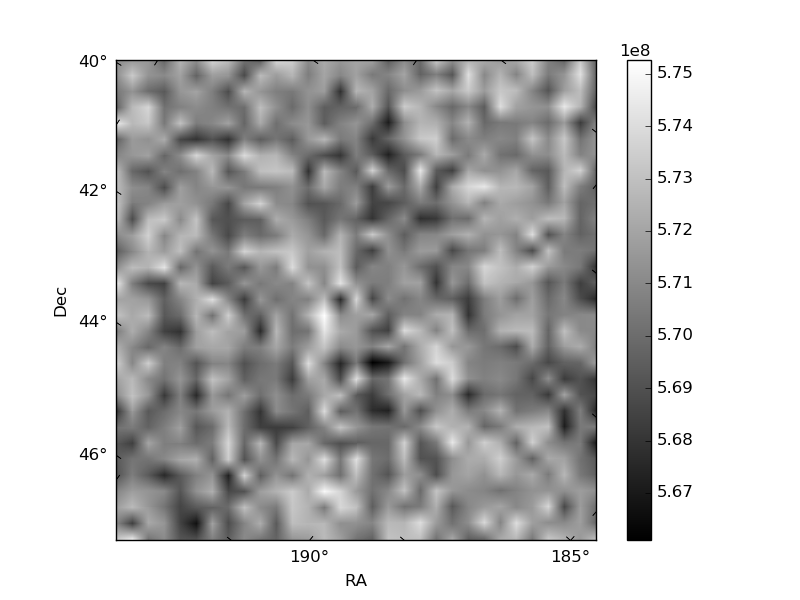
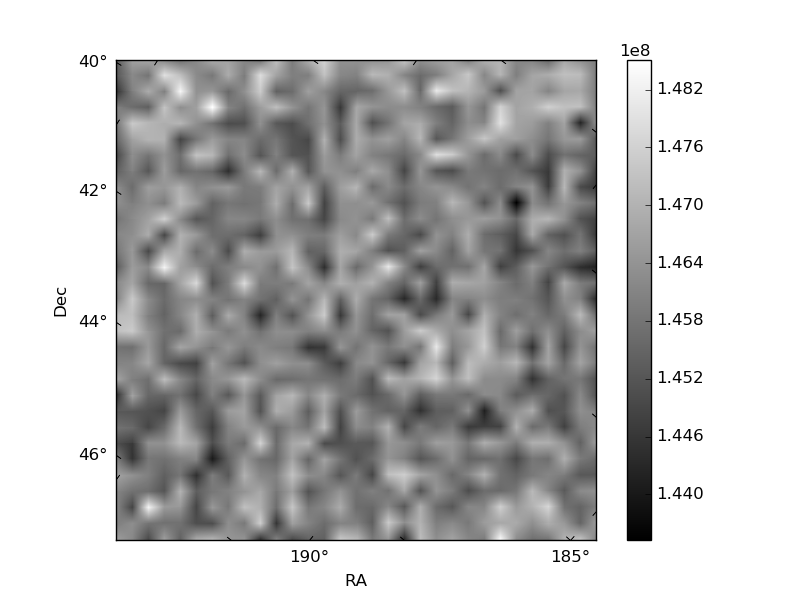
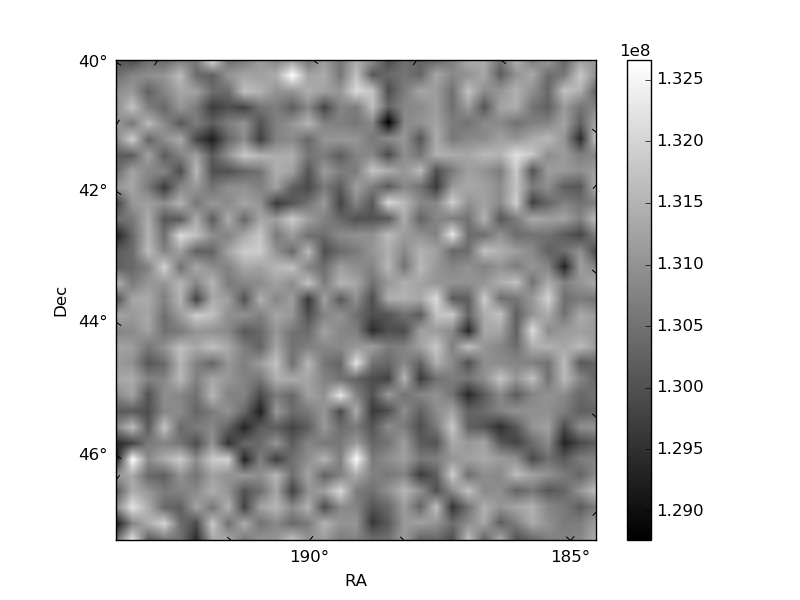
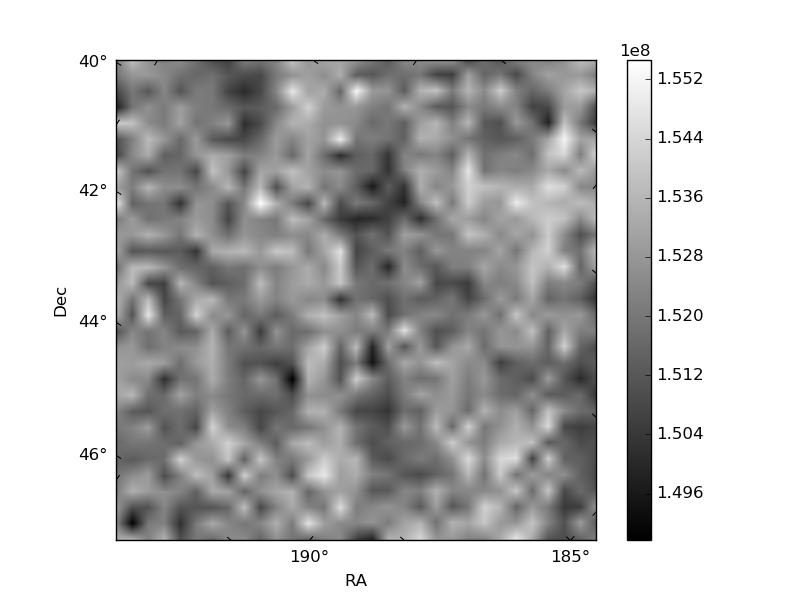
Histogram calculated using DETX and DETY for each event in the final _common_clean file
| Quadrant A | 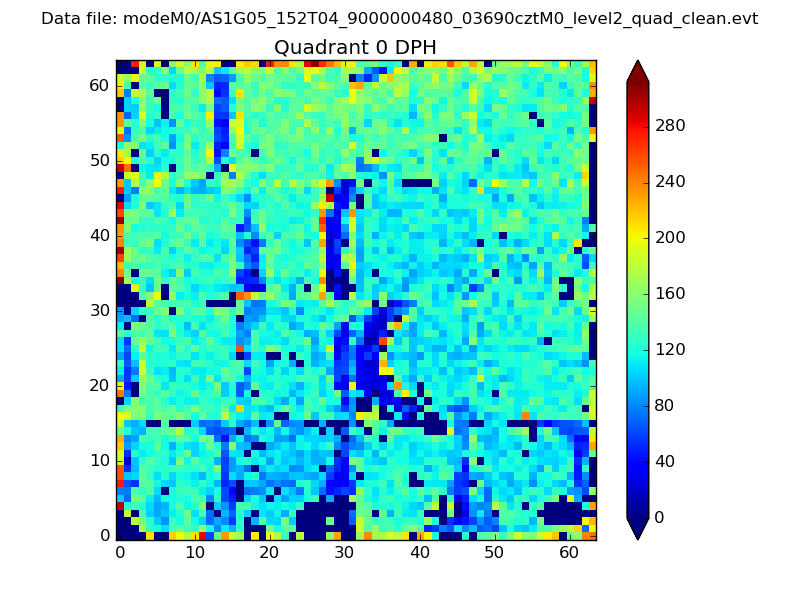 |
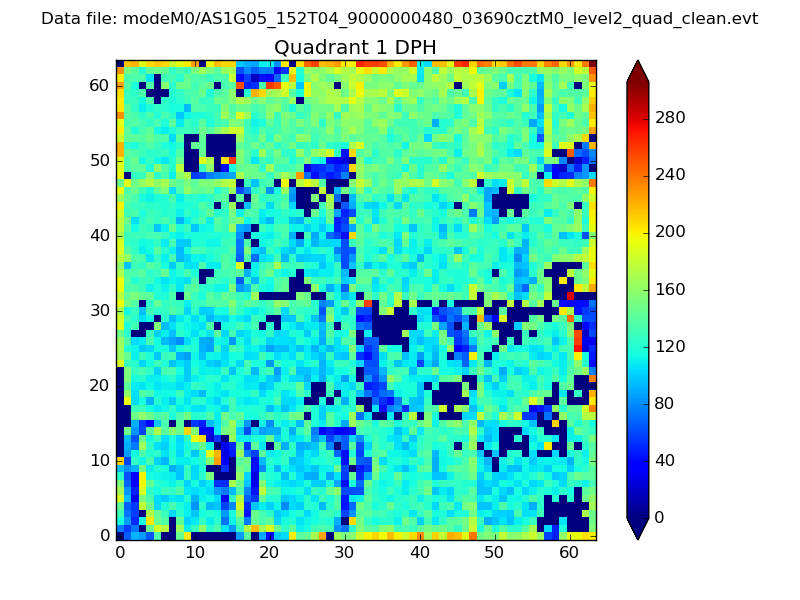 |
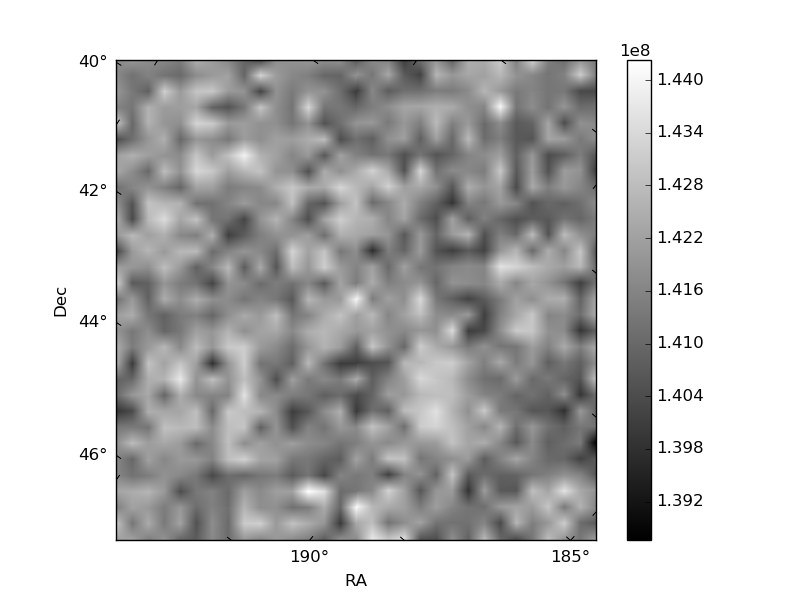
Quadrant B |
|---|---|---|---|
| Quadrant D | 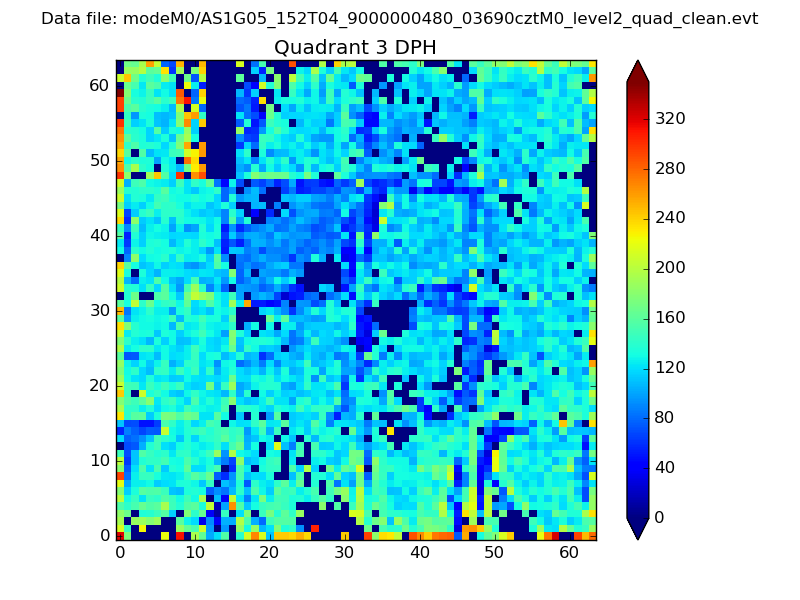 |
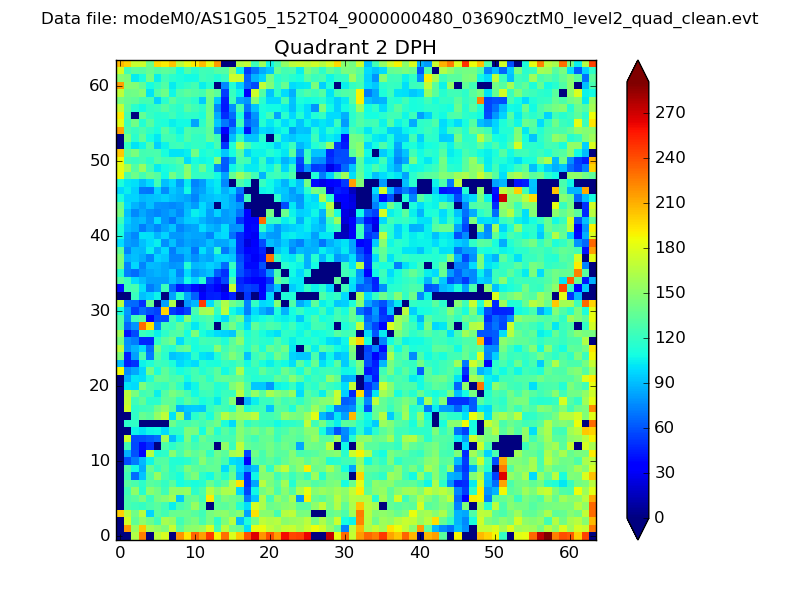 |
Quadrant C |
| Plot type | Count rate plots | Images |
|---|---|---|
| Comparison with Poisson distribution Blue bars denote a histogram of data divided into 1 sec bins. Red curve is a Poisson curve with rate = median count rate of data. |
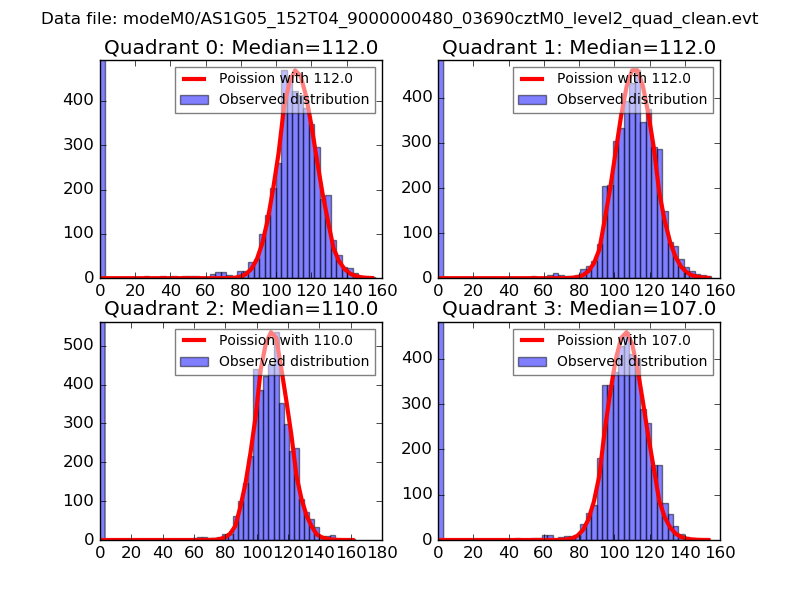 |
 |
| Quadrant-wise count rates Data is divided into 100 sec bins |
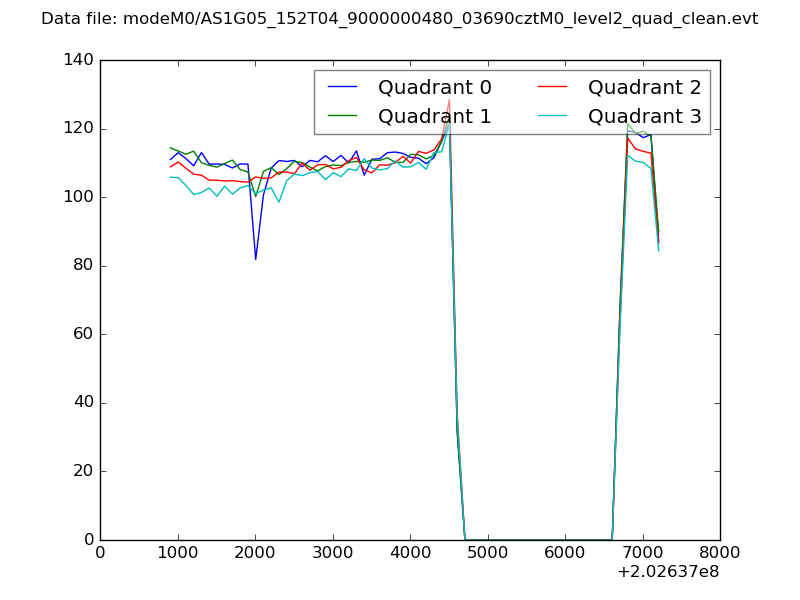 |
|
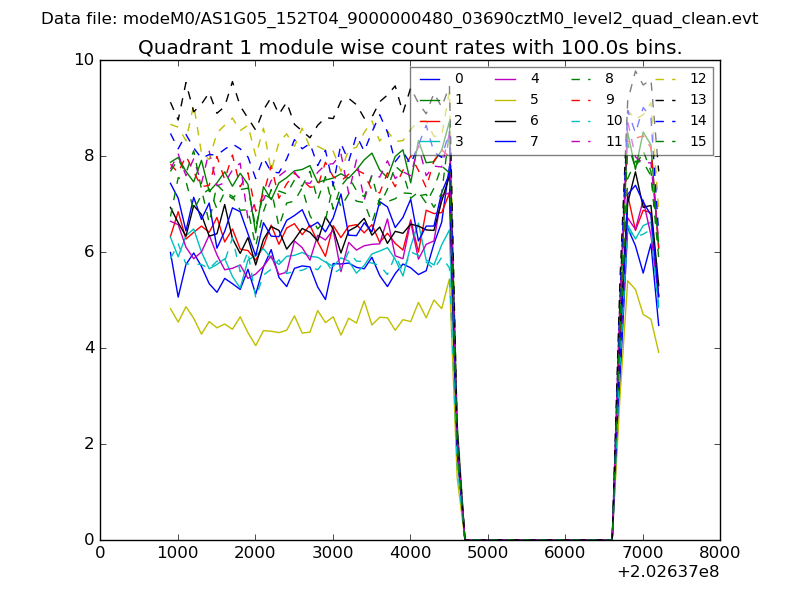
| Module-wise count rates for Quadrant A Data is divided into 100 sec bins |
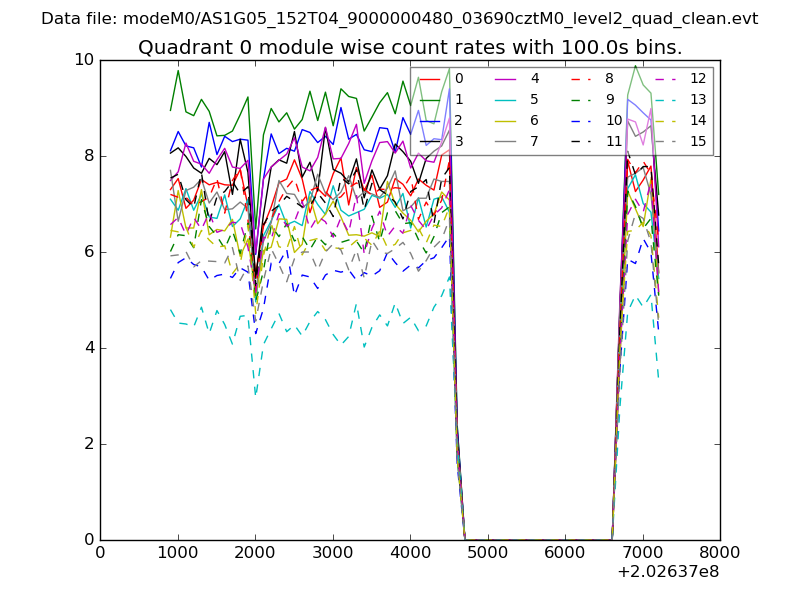 |
 |
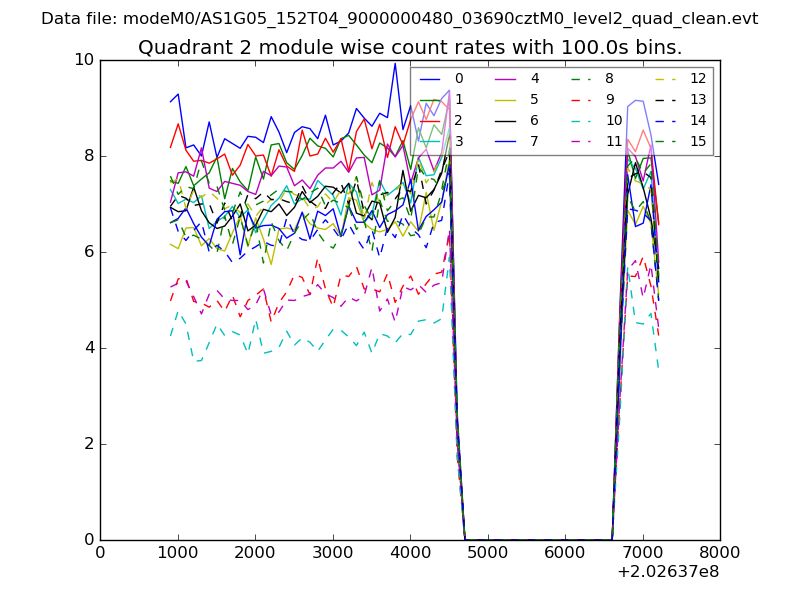
| Module-wise count rates for Quadrant B Data is divided into 100 sec bins |
 |
 |
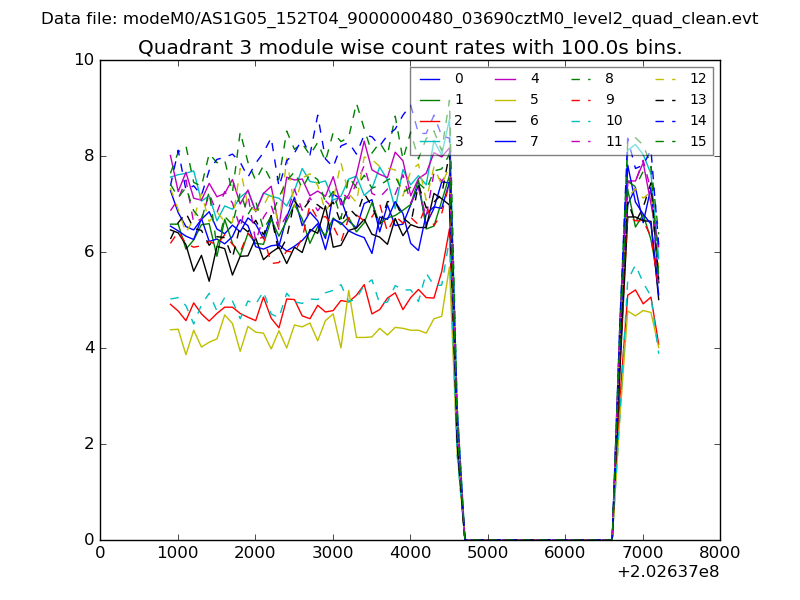
| Module-wise count rates for Quadrant C Data is divided into 100 sec bins |
 |
 |
| Module-wise count rates for Quadrant D Data is divided into 100 sec bins |
 |
 |
| Parameter | Plot |
|---|---|
| CZT HV Monitor | 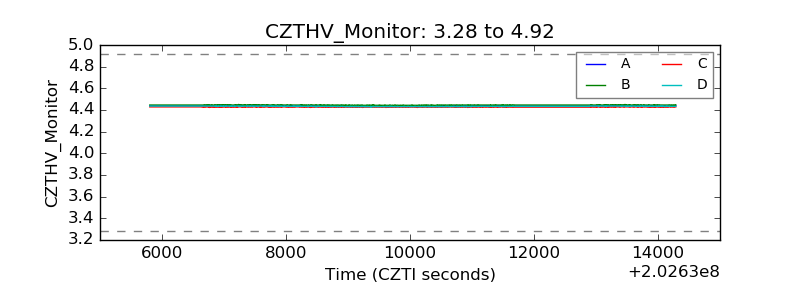 |
| D_VDD | 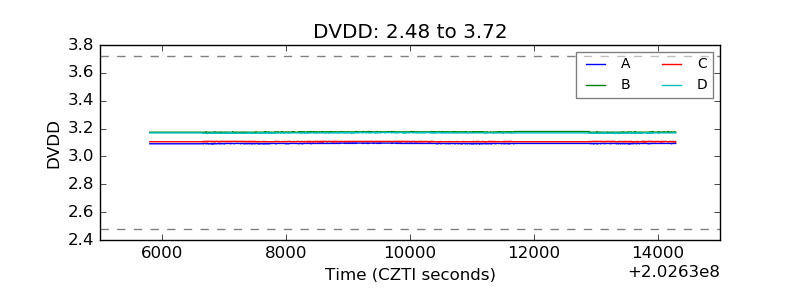 |
| Temperature 1 | 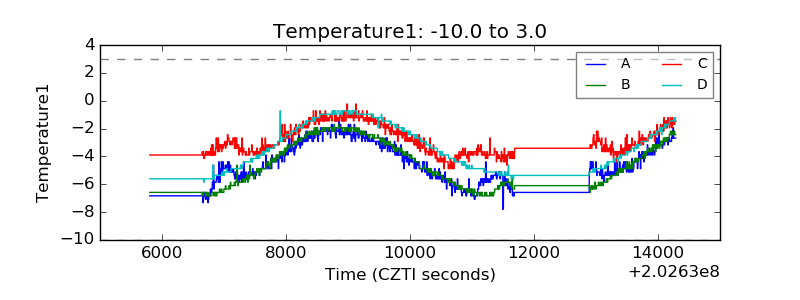 |
| Veto HV Monitor |  |
| Veto LLD |  |
| Alpha Counter | 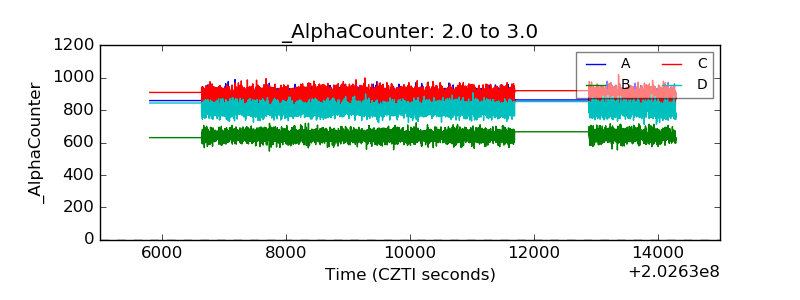 |
| _CPM_Rate | 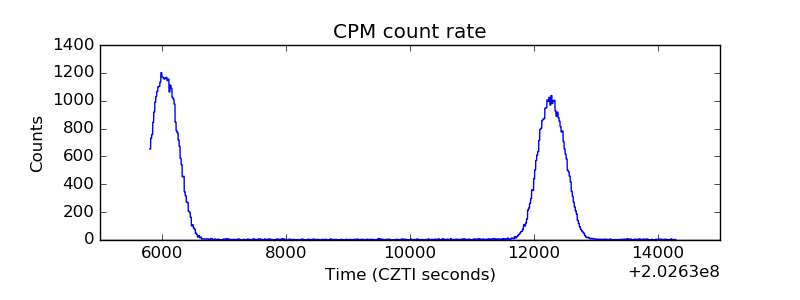 |
| CZT Counter | 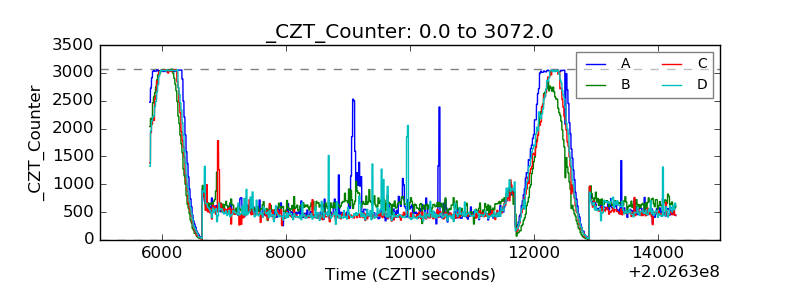 |
| +2.5 Volts monitor |  |
| +5 Volts monitor |  |
| Veto Counter | 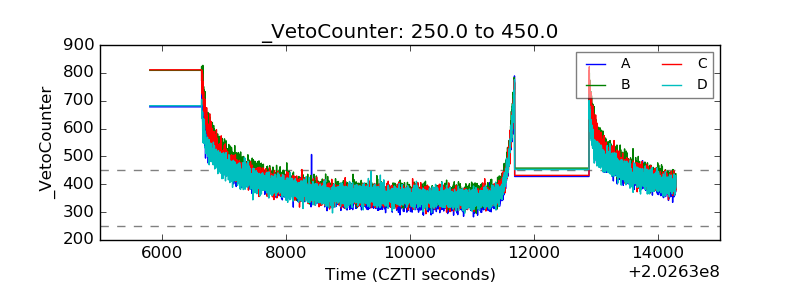 |