| Param | Original file | Final file |
|---|---|---|
| Filename | modeM0/AS1G05_152T04_9000000480_03691cztM0_level2.evt | modeM0/AS1G05_152T04_9000000480_03691cztM0_level2_quad_clean.evt |
| Size (bytes) | 341,461,440 | 65,111,040 |
| Size | 325.6 MB | 62.1 MB |
| Events in quadrant A | 2,293,057 | 418,977 |
| Events in quadrant B | 3,087,665 | 414,924 |
| Events in quadrant C | 2,172,831 | 409,057 |
| Events in quadrant D | 2,467,857 | 398,775 |
| Mode M9 | |||
|---|---|---|---|
| Quadrant | BADHDUFLAG | Total packets | Discarded packets |
| A | 0 | 11 | 0 |
| B | 0 | 11 | 0 |
| C | 0 | 11 | 0 |
| D | 0 | 11 | 0 |
| Mode SS | |||
|---|---|---|---|
| Quadrant | BADHDUFLAG | Total packets | Discarded packets |
| A | 0 | 94 | 0 |
| B | 0 | 94 | 0 |
| C | 0 | 94 | 0 |
| D | 0 | 94 | 0 |
| Mode M0 | |||
|---|---|---|---|
| Quadrant | BADHDUFLAG | Total packets | Discarded packets |
| A | 0 | 9755 | 1 |
| B | 0 | 13000 | 1 |
| C | 0 | 9591 | 1 |
| D | 0 | 10643 | 1 |
| Quadrant | Total seconds | Saturated seconds | Saturation percentage |
|---|---|---|---|
| A | 4694 | 24 | 0.511291% |
| B | 4694 | 34 | 0.724329% |
| C | 4694 | 12 | 0.255646% |
| D | 4694 | 45 | 0.958671% |
Noise dominated data is calculated using 1-second bins in cleaned event files. If a bin has >2000 counts, and if more than 50% of those come from <1% of pixels, then it is considered to be noise-dominated and hence unusable.
| Quadrant | # 1 sec bins | Bins with >0 counts | Bins with >2000 counts | High rate bins dominated by noise | Noise dominated (total time) | Noise dominated (detector-on time) | Marked lightcurve |
|---|---|---|---|---|---|---|---|
| A | 4694 | 4694 | 4 | 4 | 0.09% | 0.09% | 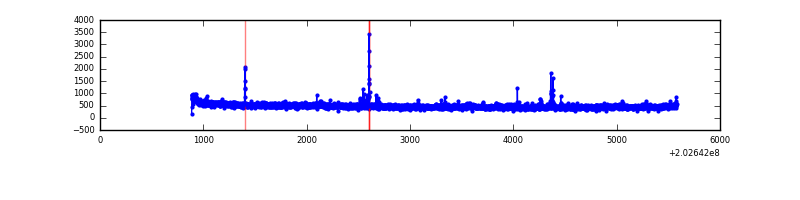 |
| B | 4694 | 4694 | 10 | 10 | 0.21% | 0.21% | 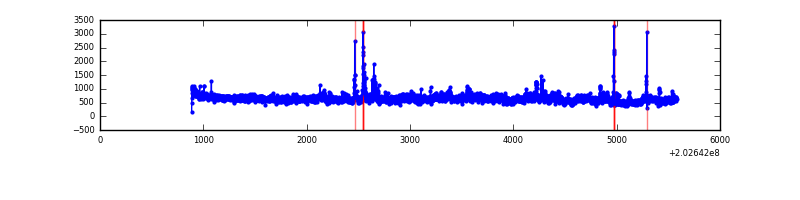 |
| C | 4694 | 4694 | 3 | 3 | 0.06% | 0.06% | 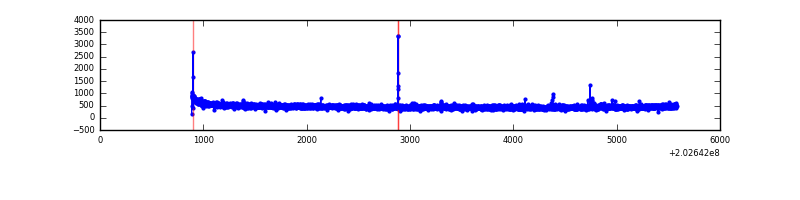 |
| D | 4694 | 4694 | 38 | 38 | 0.81% | 0.81% | 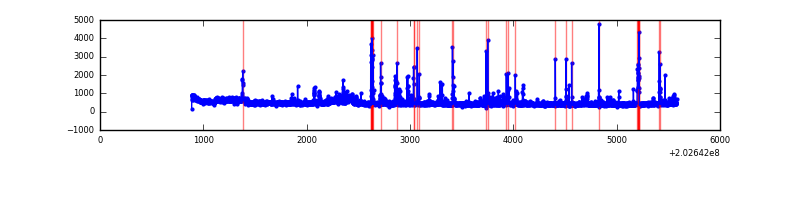 |
Top three noisy pixels from each quadrant. If the there are fewer than three noisy pixels in the level2.evt file, extra rows are filled as -1
| Pixel properties | Quadrant properties | ||||||
|---|---|---|---|---|---|---|---|
| Quadrant | DetID | PixID | Counts | Sigma | Mean | Median | Sigma |
| A | 3 | 1 | 46760 | 397.37 | 568 | 555 | 116.3 |
| A | 0 | 50 | 25155 | 211.57 | 568 | 555 | 116.3 |
| A | 0 | 118 | 24215 | 203.48 | 568 | 555 | 116.3 |
| B | 14 | 167 | 455018 | 4117.94 | 570 | 558 | 110.4 |
| B | 15 | 204 | 144386 | 1303.25 | 570 | 558 | 110.4 |
| B | 3 | 0 | 115142 | 1038.26 | 570 | 558 | 110.4 |
| C | 2 | 53 | 21556 | 164.99 | 546 | 547 | 127.3 |
| C | 9 | 144 | 18077 | 137.67 | 546 | 547 | 127.3 |
| C | 13 | 61 | 4562 | 31.53 | 546 | 547 | 127.3 |
| D | 2 | 37 | 171243 | 1298.9 | 547 | 531 | 131.4 |
| D | 5 | 233 | 127830 | 968.58 | 547 | 531 | 131.4 |
| D | 13 | 223 | 27439 | 204.74 | 547 | 531 | 131.4 |
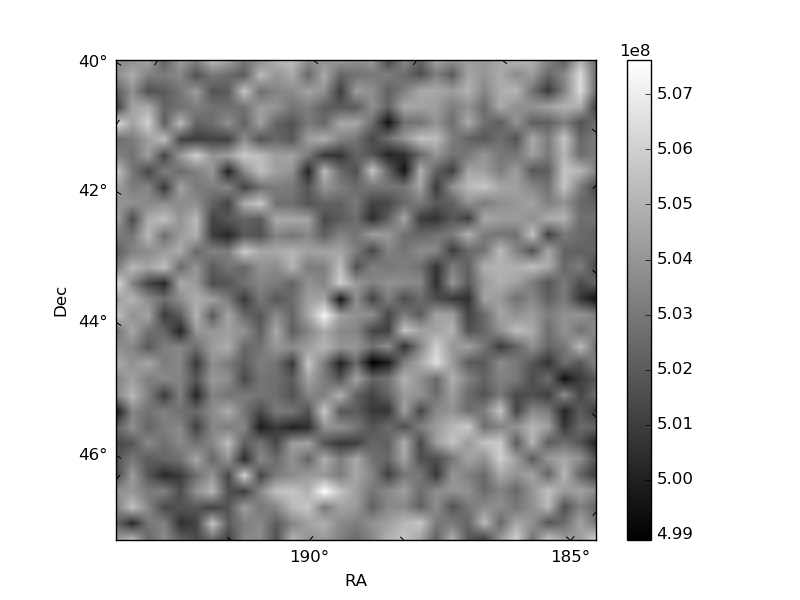
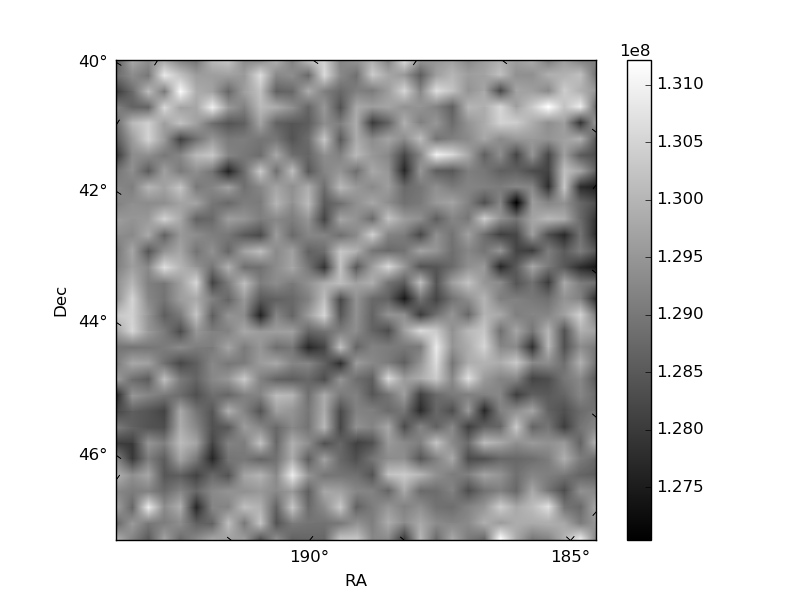
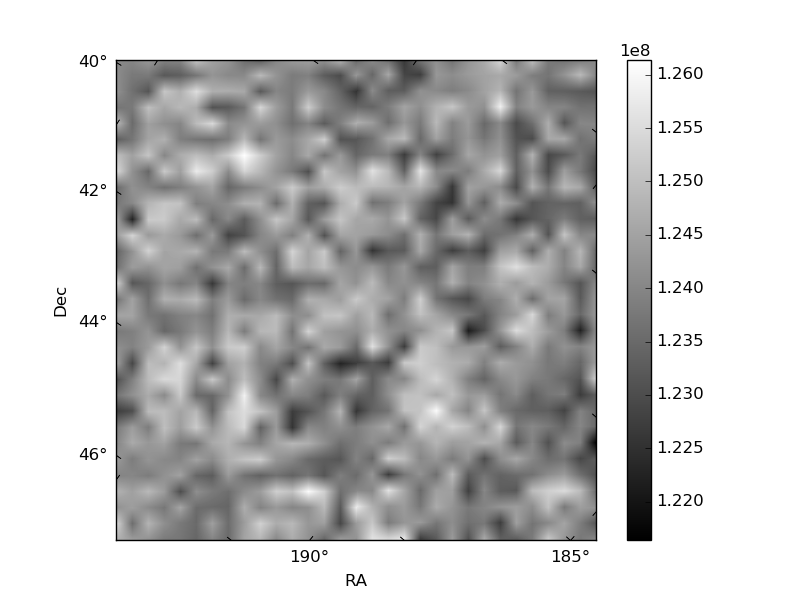
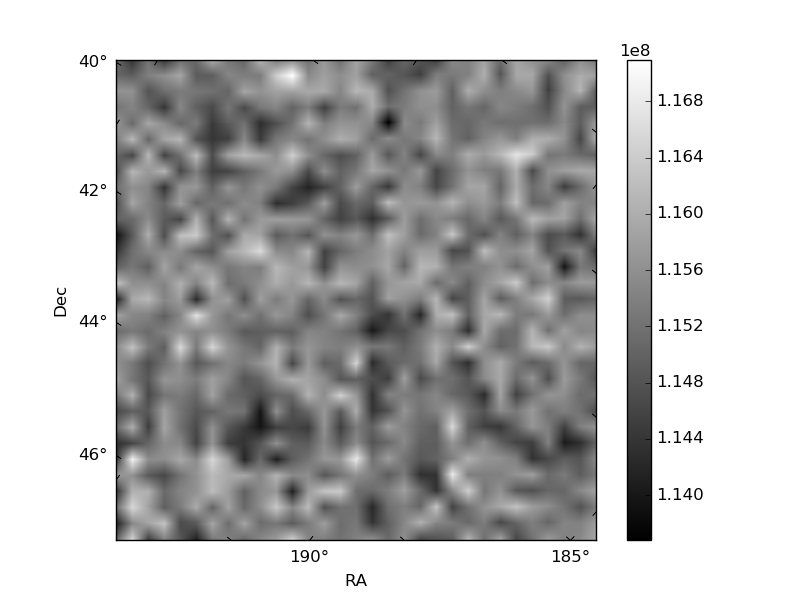
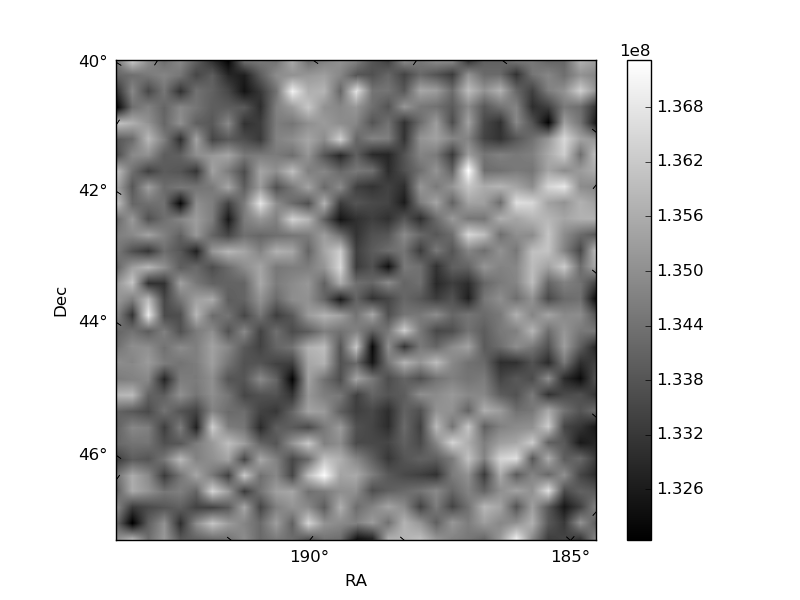
Histogram calculated using DETX and DETY for each event in the final _common_clean file
| Quadrant A | 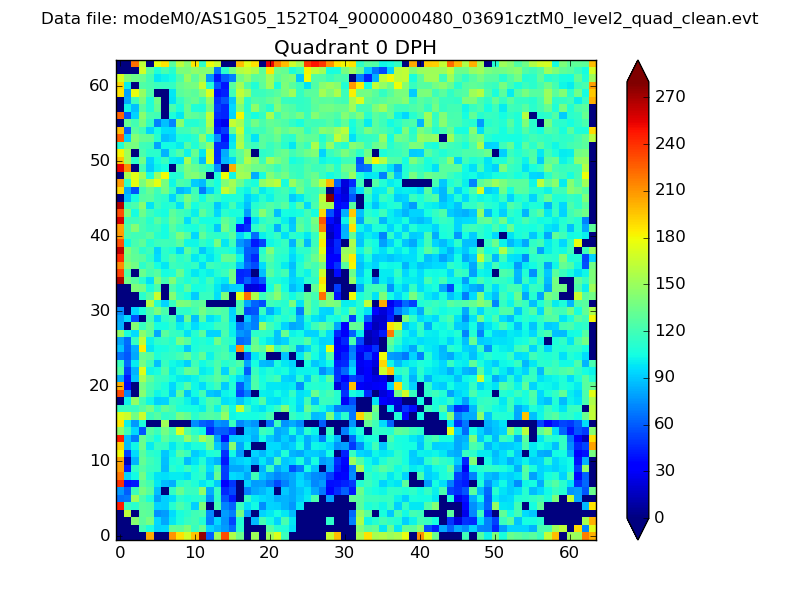 |
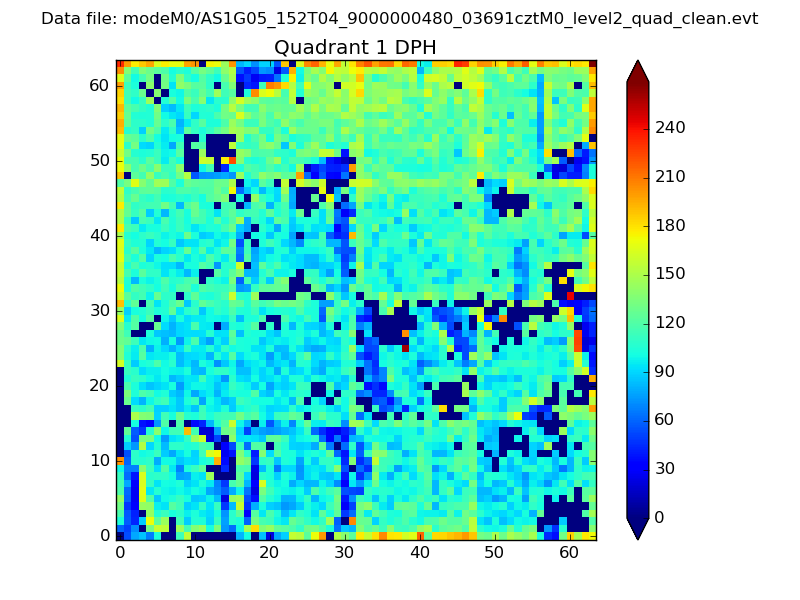 |
Quadrant B |
|---|---|---|---|
| Quadrant D | 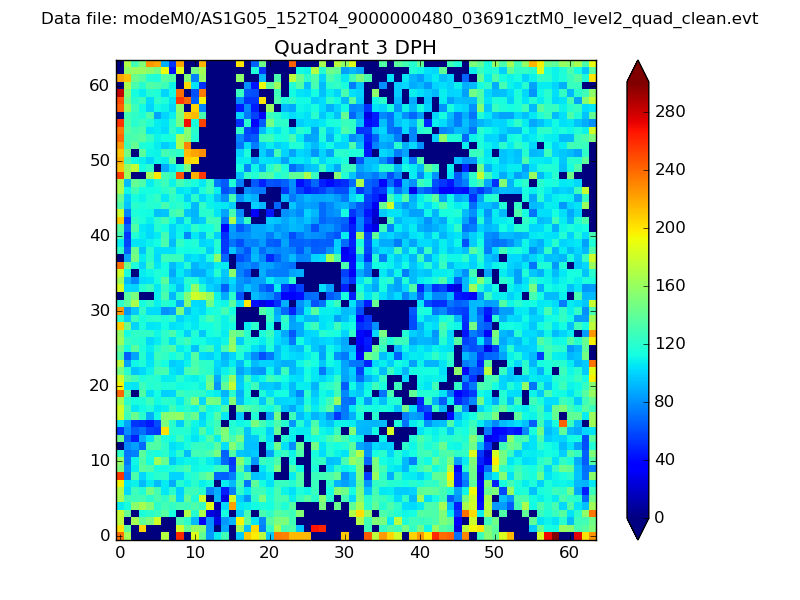 |
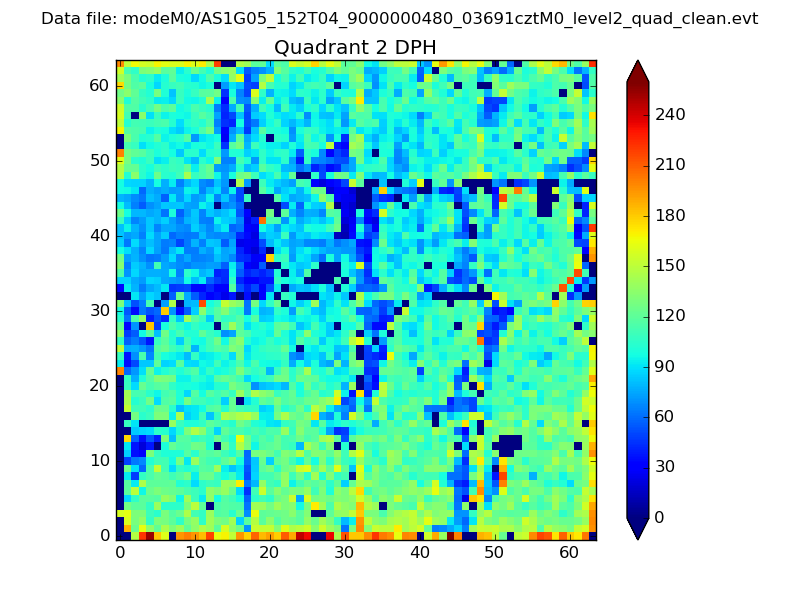 |
Quadrant C |
| Plot type | Count rate plots | Images |
|---|---|---|
| Comparison with Poisson distribution Blue bars denote a histogram of data divided into 1 sec bins. Red curve is a Poisson curve with rate = median count rate of data. |
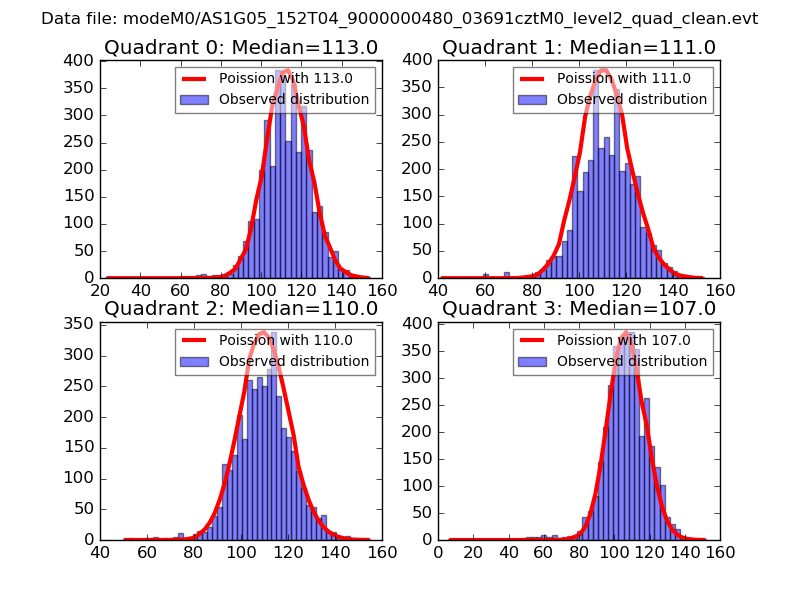 |
 |
| Quadrant-wise count rates Data is divided into 100 sec bins |
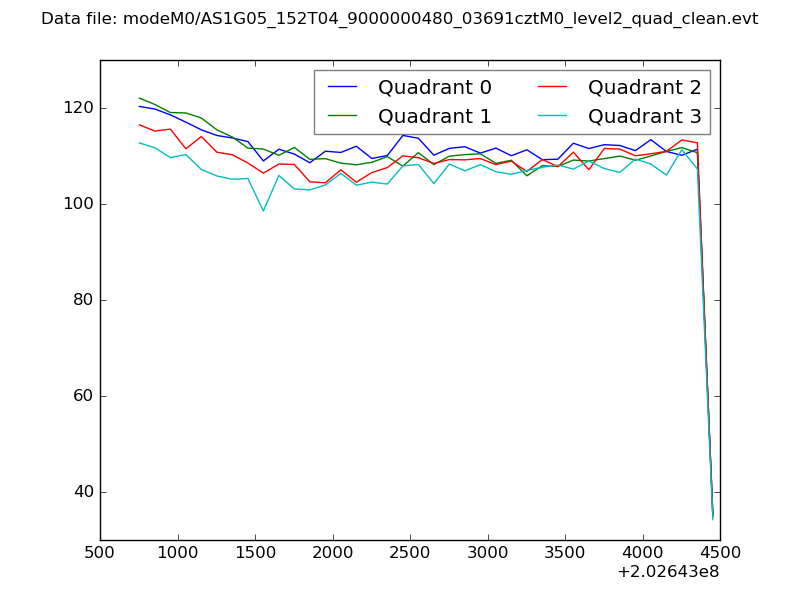 |
|
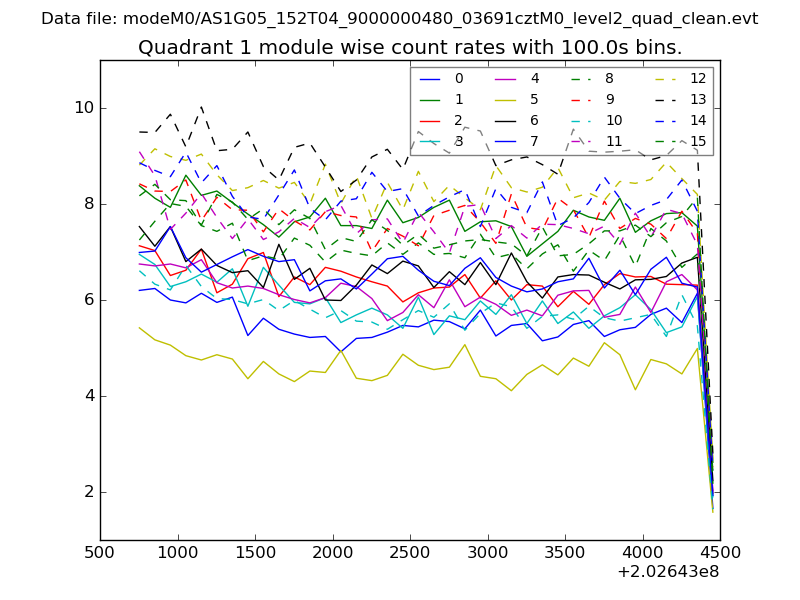
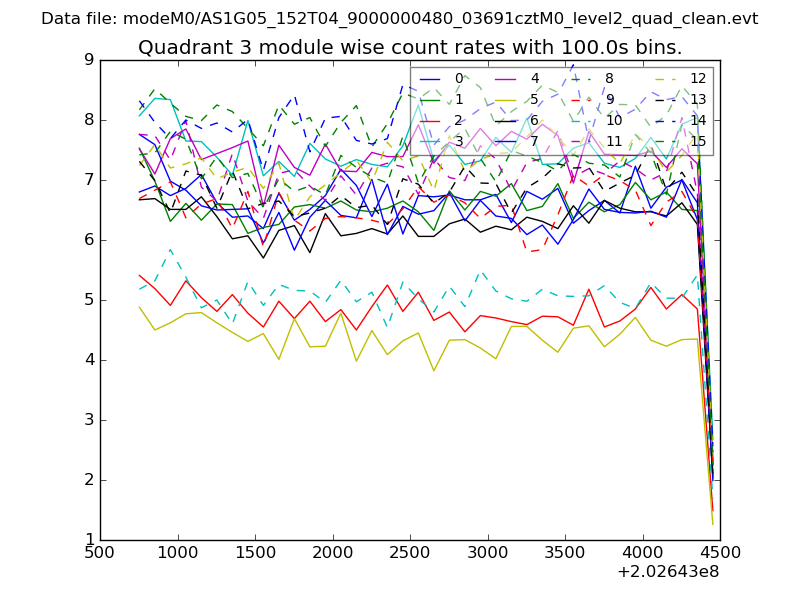
| Module-wise count rates for Quadrant A Data is divided into 100 sec bins |
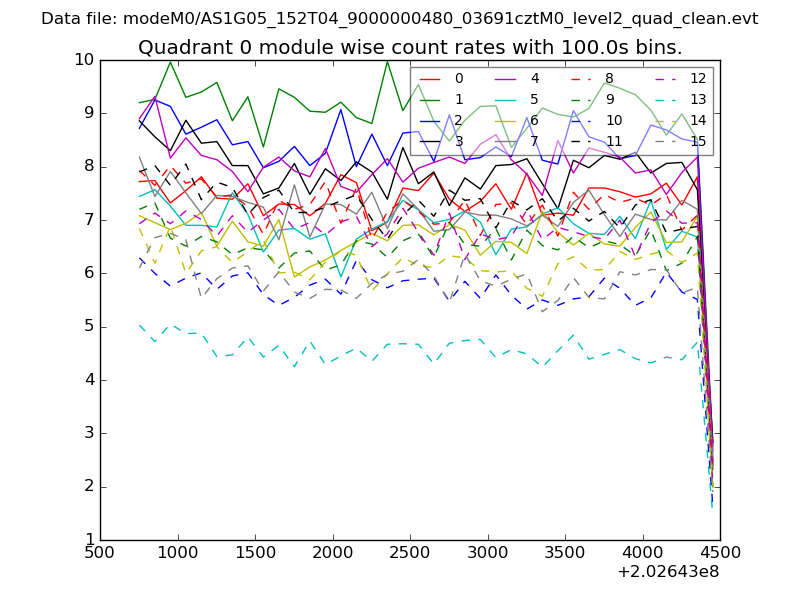 |
 |
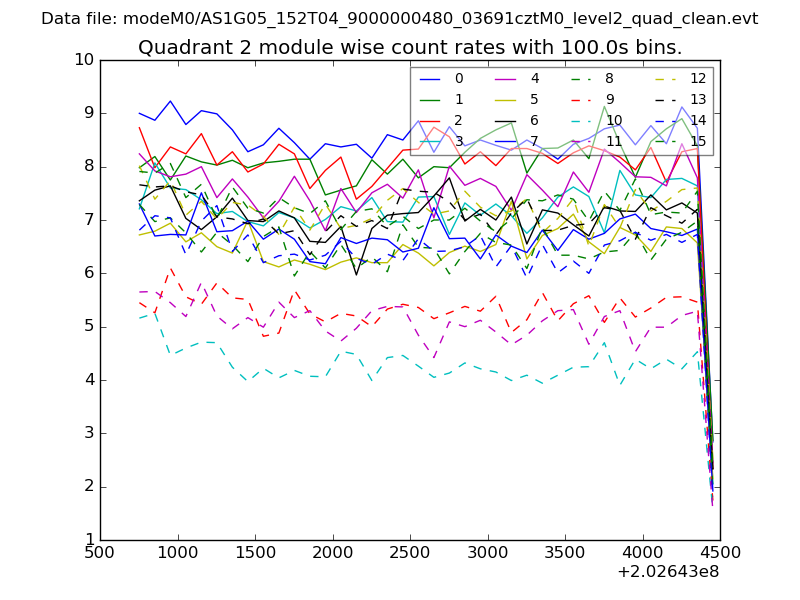
| Module-wise count rates for Quadrant B Data is divided into 100 sec bins |
 |
 |
| Module-wise count rates for Quadrant C Data is divided into 100 sec bins |
 |
 |
| Module-wise count rates for Quadrant D Data is divided into 100 sec bins |
 |
 |
| Parameter | Plot |
|---|---|
| CZT HV Monitor | 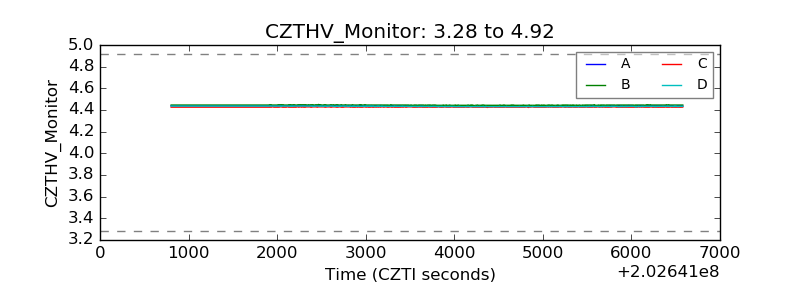 |
| D_VDD | 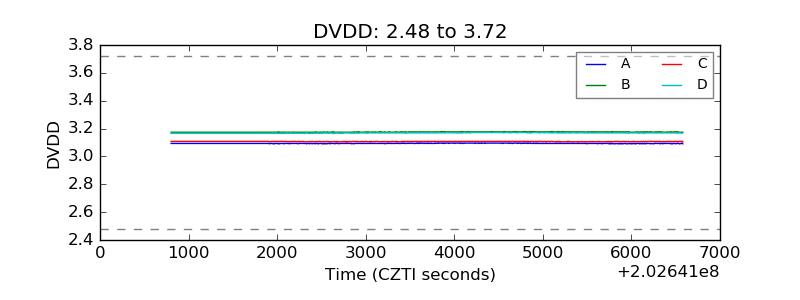 |
| Temperature 1 | 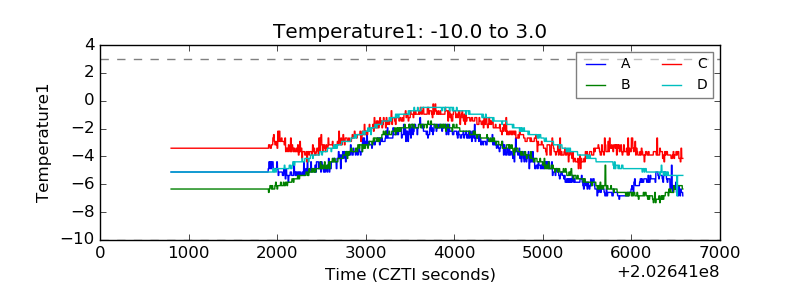 |
| Veto HV Monitor | 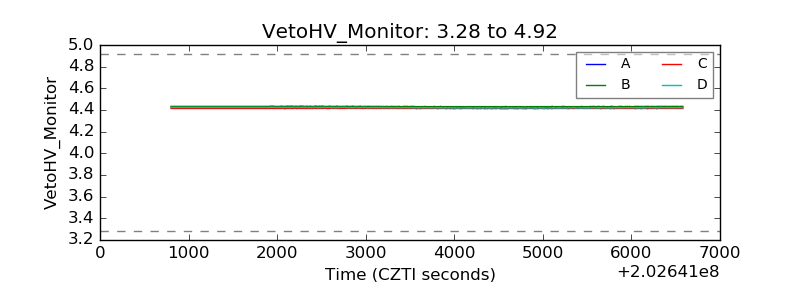 |
| Veto LLD | 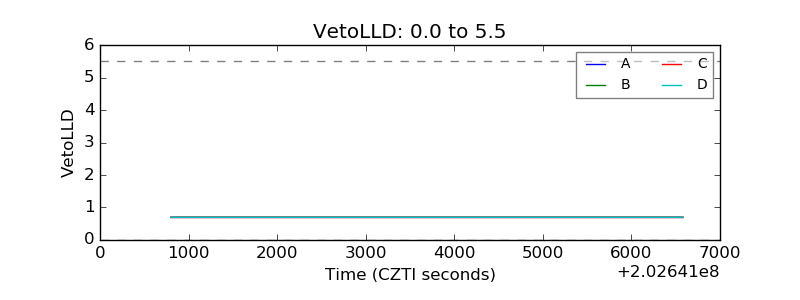 |
| Alpha Counter | 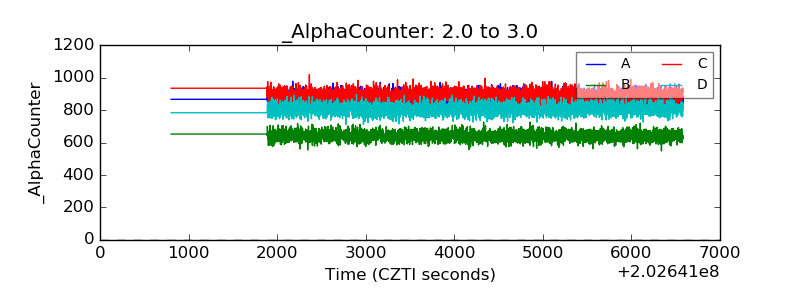 |
| _CPM_Rate | 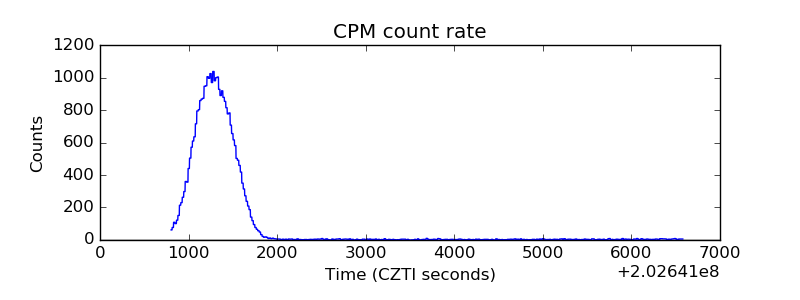 |
| CZT Counter | 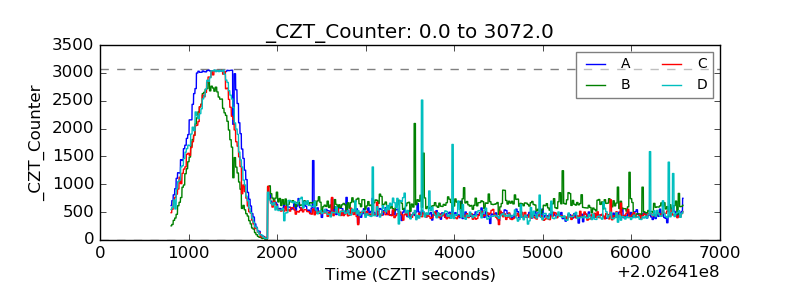 |
| +2.5 Volts monitor |  |
| +5 Volts monitor | 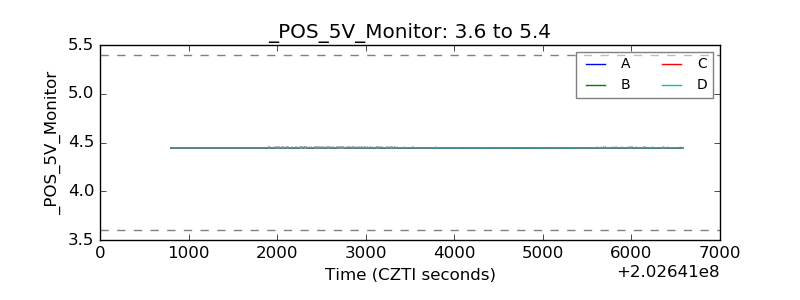 |
| Veto Counter | 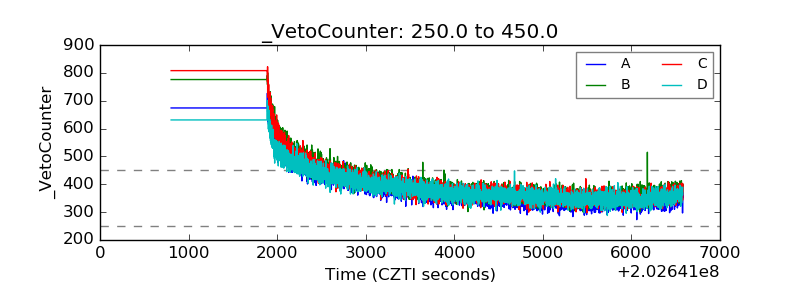 |