| Param | Original file | Final file |
|---|---|---|
| Filename | modeM0/AS1G05_201T01_9000000478cztM0_level2.fits | modeM0/AS1G05_201T01_9000000478cztM0_level2_quad_clean.evt |
| Size (bytes) | 502,387,200 | 563,964,480 |
| Size | 479.1 MB | 537.8 MB |
| Events in quadrant A | 3,010,328 | 3,468,741 |
| Events in quadrant B | 2,885,194 | 3,430,835 |
| Events in quadrant C | 2,961,824 | 3,314,267 |
| Events in quadrant D | 2,579,400 | 3,089,376 |
| Mode M9 | |||
|---|---|---|---|
| Quadrant | BADHDUFLAG | Total packets | Discarded packets |
| A | 0 | 84 | 0 |
| B | 0 | 84 | 0 |
| C | 0 | 84 | 0 |
| D | 0 | 84 | 0 |
| Mode M0 | |||
|---|---|---|---|
| Quadrant | BADHDUFLAG | Total packets | Discarded packets |
| A | 0 | 122652 | 0 |
| B | 0 | 133470 | 0 |
| C | 0 | 113926 | 0 |
| D | 0 | 116899 | 0 |
| Mode SS | |||
|---|---|---|---|
| Quadrant | BADHDUFLAG | Total packets | Discarded packets |
| A | 0 | 1126 | 0 |
| B | 0 | 1126 | 0 |
| C | 0 | 1126 | 0 |
| D | 0 | 1126 | 0 |
| Quadrant | Total seconds | Saturated seconds | Saturation percentage |
|---|---|---|---|
| A | 55043 | 1163 | 2.112894% |
| B | 55043 | 1138 | 2.067475% |
| C | 55043 | 497 | 0.902930% |
| D | 55043 | 692 | 1.257199% |
Noise dominated data is calculated using 1-second bins in cleaned event files. If a bin has >2000 counts, and if more than 50% of those come from <1% of pixels, then it is considered to be noise-dominated and hence unusable.
| Quadrant | # 1 sec bins | Bins with >0 counts | Bins with >2000 counts | High rate bins dominated by noise | Noise dominated (total time) | Noise dominated (detector-on time) | Marked lightcurve |
|---|---|---|---|---|---|---|---|
| A | 63663 | 55041 | 0 | 0 | 0.00% | 0.00% |  |
| B | 63663 | 55036 | 0 | 0 | 0.00% | 0.00% | 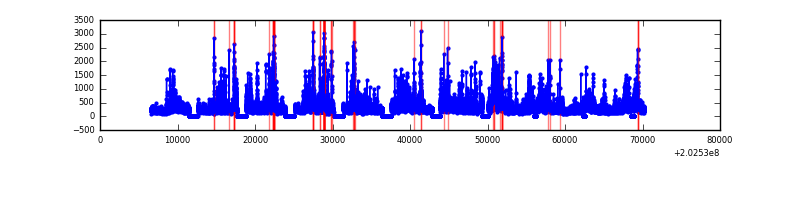 |
| C | 63663 | 55042 | 0 | 0 | 0.00% | 0.00% |  |
| D | 63663 | 55040 | 0 | 0 | 0.00% | 0.00% |  |
Top three noisy pixels from each quadrant. If the there are fewer than three noisy pixels in the level2.evt file, extra rows are filled as -1
| Pixel properties | Quadrant properties | ||||||
|---|---|---|---|---|---|---|---|
| Quadrant | DetID | PixID | Counts | Sigma | Mean | Median | Sigma |
| A | 0 | 29 | 2988 | 11.06 | 784 | 732 | 203.9 |
| A | 7 | 110 | 2612 | 9.22 | 784 | 732 | 203.9 |
| A | 0 | 30 | 2364 | 8.0 | 784 | 732 | 203.9 |
| B | 2 | 9 | 2570 | 11.87 | 763 | 725 | 155.4 |
| B | 12 | 226 | 2174 | 9.32 | 763 | 725 | 155.4 |
| B | 14 | 254 | 1986 | 8.11 | 763 | 725 | 155.4 |
| C | 1 | 80 | 2188 | 7.04 | 782 | 720 | 208.5 |
| C | 1 | 81 | 2144 | 6.83 | 782 | 720 | 208.5 |
| C | 3 | 158 | 2041 | 6.34 | 782 | 720 | 208.5 |
| D | 4 | 160 | 2059 | 6.99 | 738 | 670 | 198.8 |
| D | 6 | 231 | 1836 | 5.86 | 738 | 670 | 198.8 |
| D | 7 | 3 | 1827 | 5.82 | 738 | 670 | 198.8 |
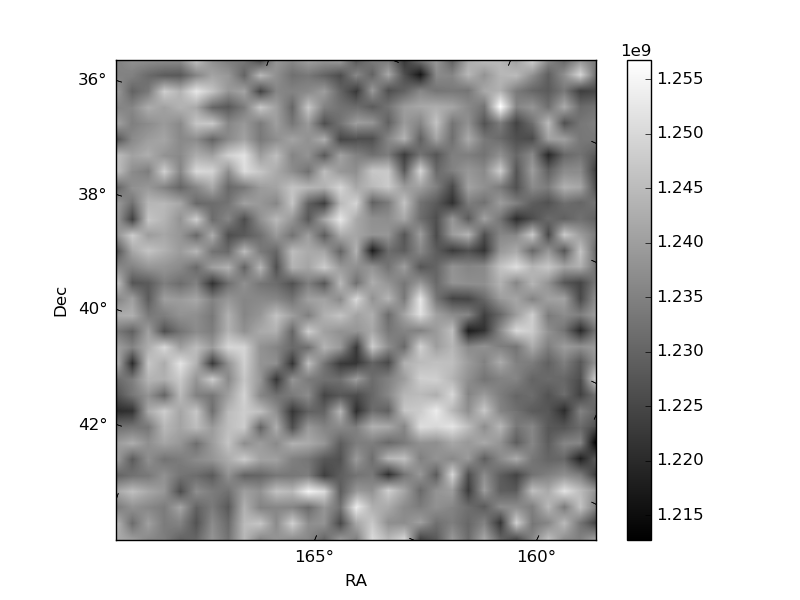
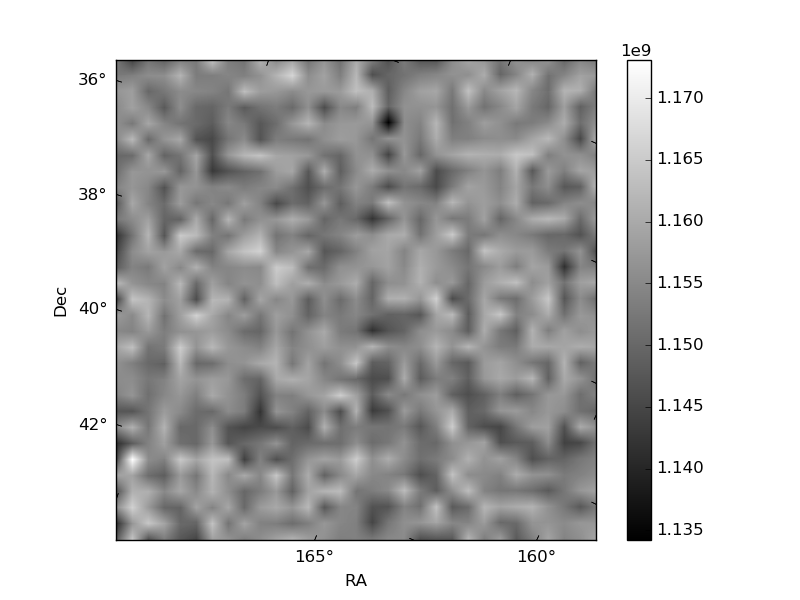
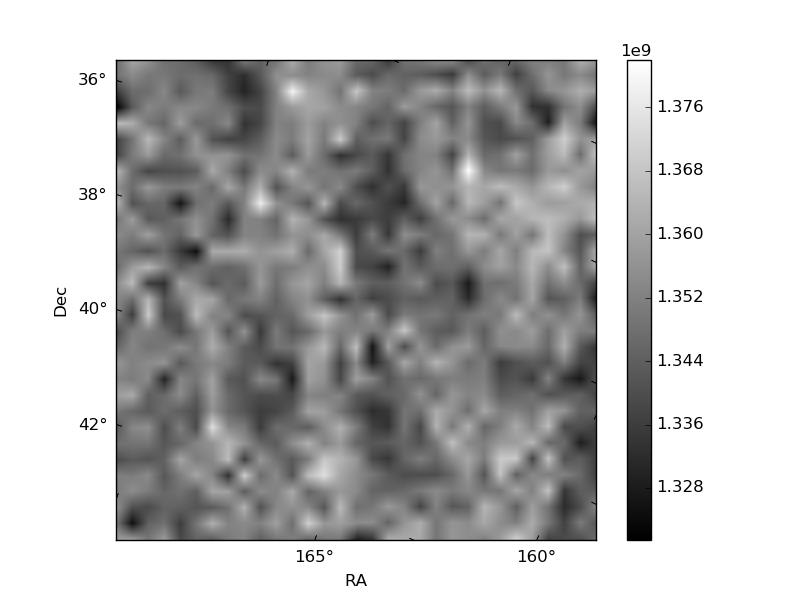
Histogram calculated using DETX and DETY for each event in the final _common_clean file
| Quadrant A | 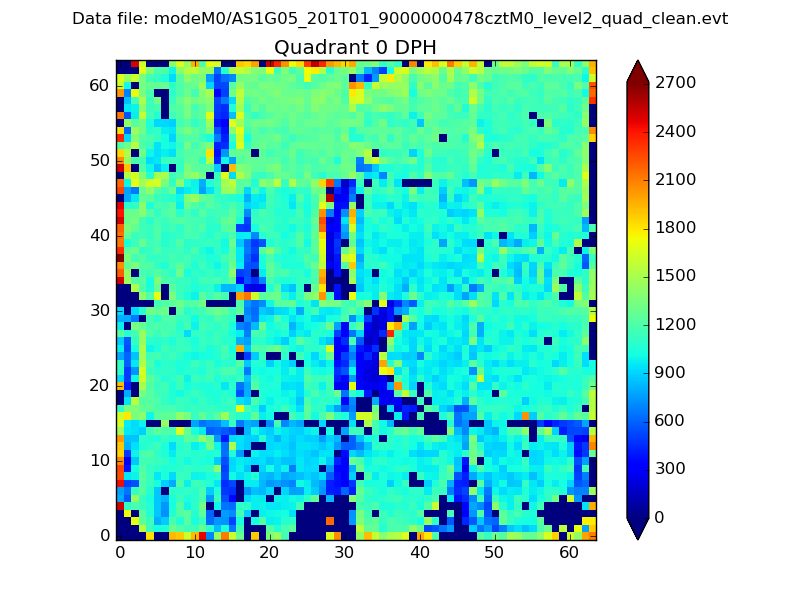 |
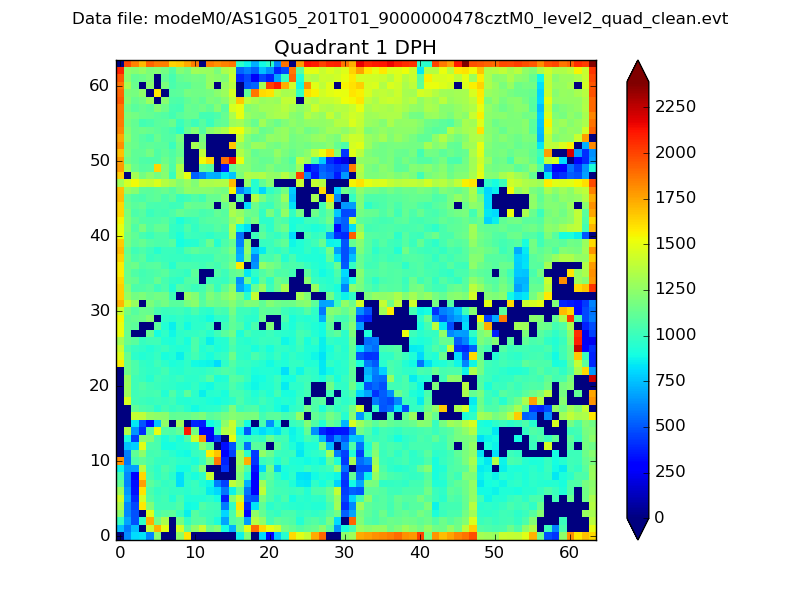 |
Quadrant B |
|---|---|---|---|
| Quadrant D | 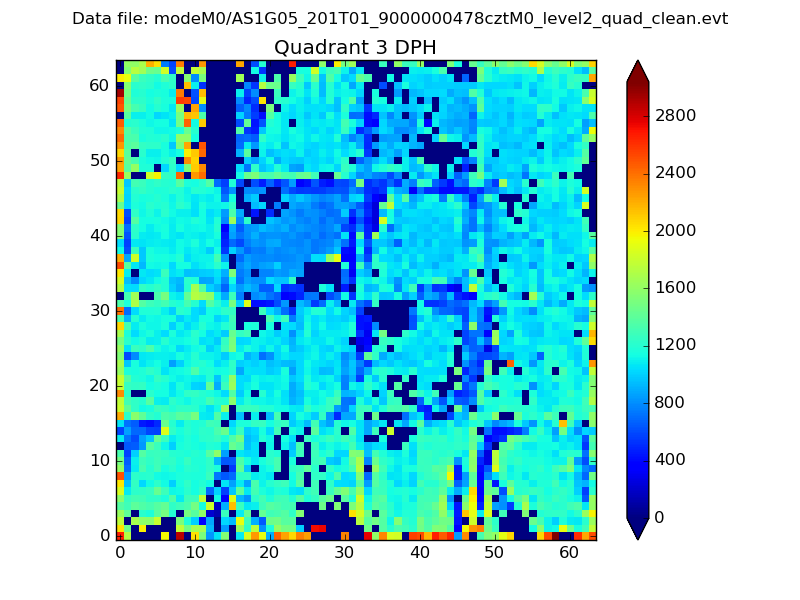 |
 |
Quadrant C |
| Plot type | Count rate plots | Images |
|---|---|---|
| Comparison with Poisson distribution Blue bars denote a histogram of data divided into 1 sec bins. Red curve is a Poisson curve with rate = median count rate of data. |
 |
 |
| Quadrant-wise count rates Data is divided into 100 sec bins |
 |
|
| Module-wise count rates for Quadrant A Data is divided into 100 sec bins |
 |
 |
| Module-wise count rates for Quadrant B Data is divided into 100 sec bins |
 |
 |
| Module-wise count rates for Quadrant C Data is divided into 100 sec bins |
 |
 |
| Module-wise count rates for Quadrant D Data is divided into 100 sec bins |
 |
 |
| Parameter | Plot |
|---|---|
| CZT HV Monitor |  |
| D_VDD |  |
| Temperature 1 |  |
| Veto HV Monitor | 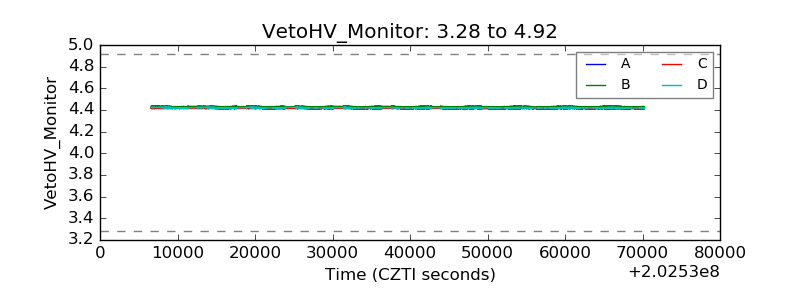 |
| Veto LLD | 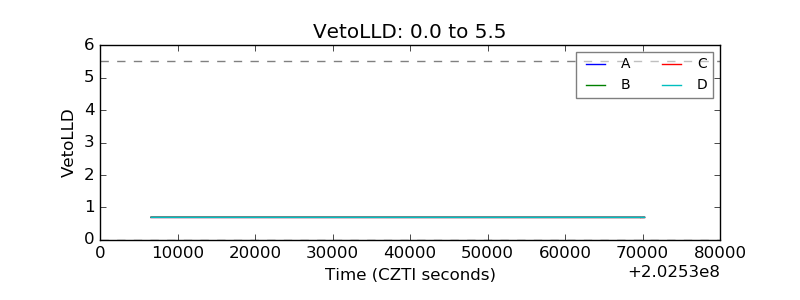 |
| Alpha Counter |  |
| _CPM_Rate | 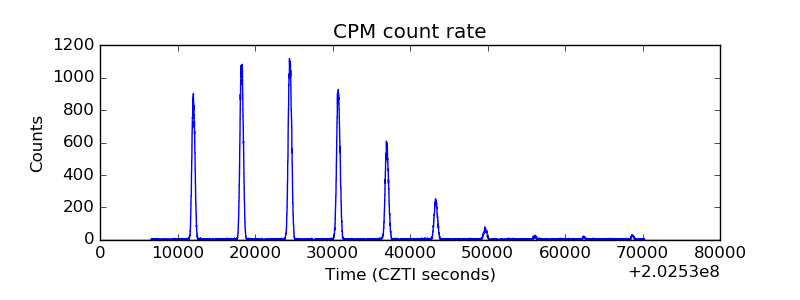 |
| CZT Counter |  |
| +2.5 Volts monitor | 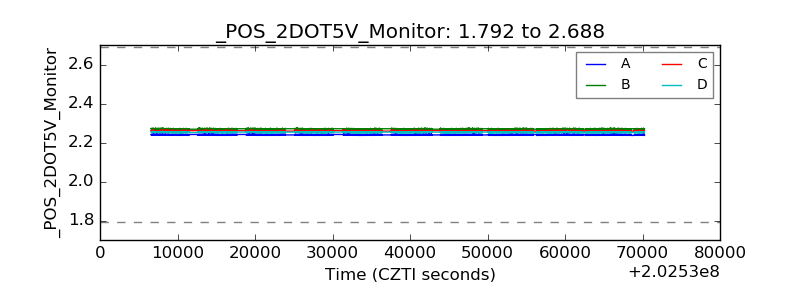 |
| +5 Volts monitor |  |
| _ROLL_ROT | 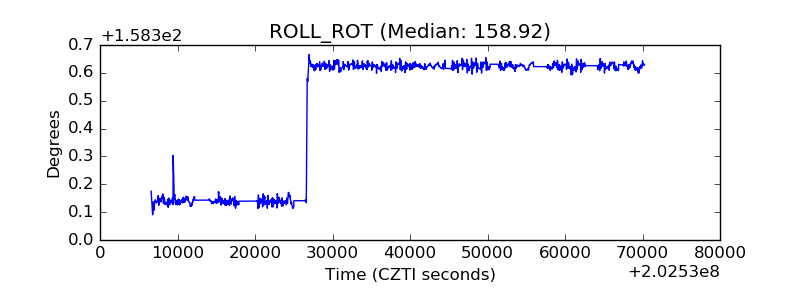 |
| _Roll_DEC | 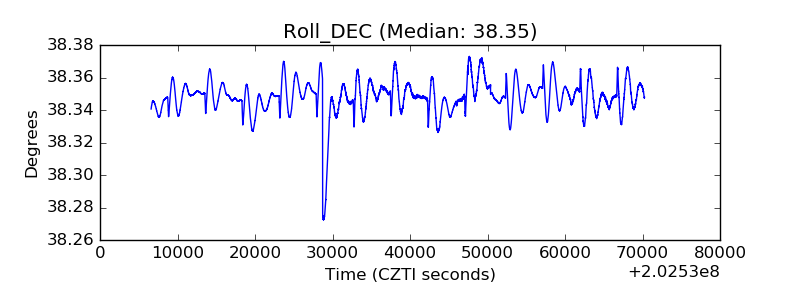 |
| _Roll_RA | 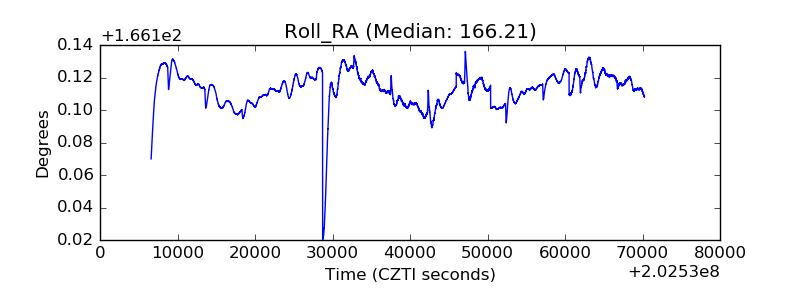 |
| Veto Counter | 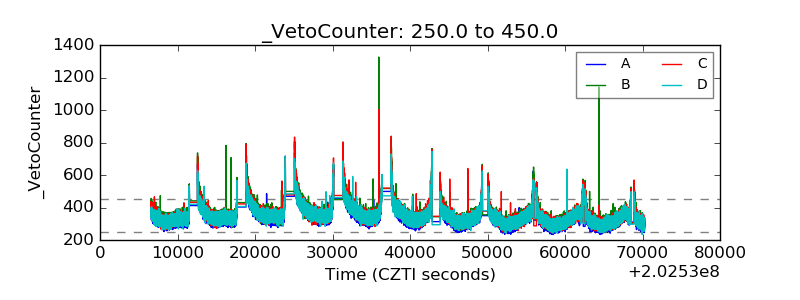 |