| Param | Original file | Final file |
|---|---|---|
| Filename | modeM0/AS1G05_201T01_9000000478_03673cztM0_level2.evt | modeM0/AS1G05_201T01_9000000478_03673cztM0_level2_quad_clean.evt |
| Size (bytes) | 425,370,240 | 59,054,400 |
| Size | 405.7 MB | 56.3 MB |
| Events in quadrant A | 3,160,620 | 341,642 |
| Events in quadrant B | 3,455,526 | 338,140 |
| Events in quadrant C | 2,920,348 | 336,761 |
| Events in quadrant D | 2,915,296 | 329,492 |
| Mode M9 | |||
|---|---|---|---|
| Quadrant | BADHDUFLAG | Total packets | Discarded packets |
| A | 0 | 10 | 0 |
| B | 0 | 10 | 0 |
| C | 0 | 10 | 0 |
| D | 0 | 10 | 0 |
| Mode M0 | |||
|---|---|---|---|
| Quadrant | BADHDUFLAG | Total packets | Discarded packets |
| A | 0 | 13348 | 2 |
| B | 0 | 14275 | 1 |
| C | 0 | 13059 | 1 |
| D | 0 | 13365 | 1 |
| Mode SS | |||
|---|---|---|---|
| Quadrant | BADHDUFLAG | Total packets | Discarded packets |
| A | 0 | 130 | 0 |
| B | 0 | 130 | 0 |
| C | 0 | 130 | 0 |
| D | 0 | 130 | 0 |
| Quadrant | Total seconds | Saturated seconds | Saturation percentage |
|---|---|---|---|
| A | 6325 | 61 | 0.964427% |
| B | 6325 | 57 | 0.901186% |
| C | 6325 | 27 | 0.426877% |
| D | 6325 | 59 | 0.932806% |
Noise dominated data is calculated using 1-second bins in cleaned event files. If a bin has >2000 counts, and if more than 50% of those come from <1% of pixels, then it is considered to be noise-dominated and hence unusable.
| Quadrant | # 1 sec bins | Bins with >0 counts | Bins with >2000 counts | High rate bins dominated by noise | Noise dominated (total time) | Noise dominated (detector-on time) | Marked lightcurve |
|---|---|---|---|---|---|---|---|
| A | 7380 | 6326 | 12 | 12 | 0.16% | 0.19% | 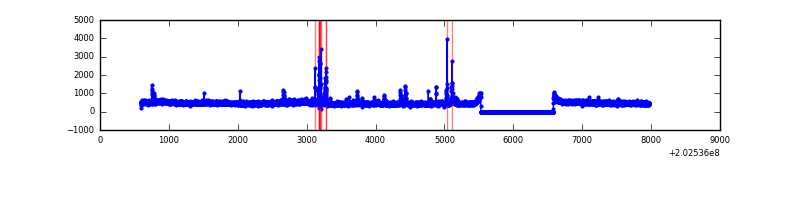 |
| B | 7380 | 6326 | 4 | 4 | 0.05% | 0.06% | 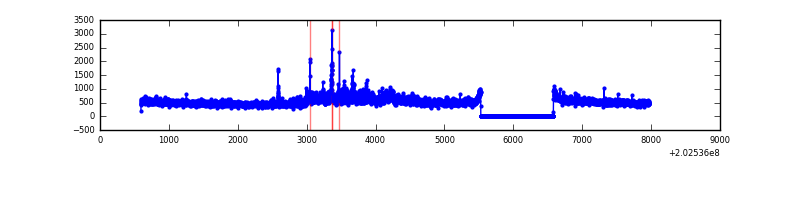 |
| C | 7380 | 6326 | 6 | 6 | 0.08% | 0.09% | 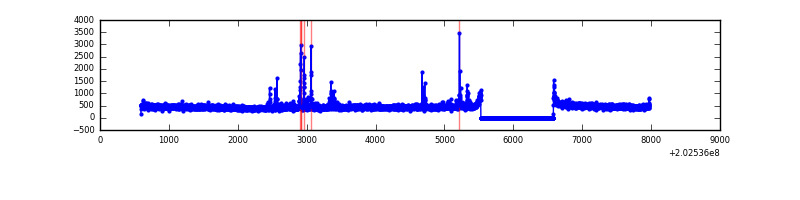 |
| D | 7380 | 6326 | 33 | 33 | 0.45% | 0.52% | 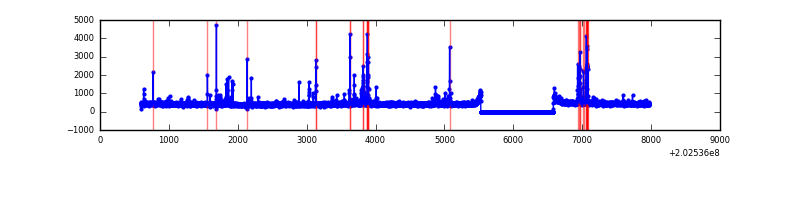 |
Top three noisy pixels from each quadrant. If the there are fewer than three noisy pixels in the level2.evt file, extra rows are filled as -1
| Pixel properties | Quadrant properties | ||||||
|---|---|---|---|---|---|---|---|
| Quadrant | DetID | PixID | Counts | Sigma | Mean | Median | Sigma |
| A | 13 | 164 | 145143 | 948.12 | 740 | 723 | 152.3 |
| A | 0 | 50 | 91477 | 595.8 | 740 | 723 | 152.3 |
| A | 13 | 251 | 42033 | 271.2 | 740 | 723 | 152.3 |
| B | 15 | 204 | 434924 | 2985.3 | 750 | 733 | 145.4 |
| B | 14 | 167 | 33102 | 222.55 | 750 | 733 | 145.4 |
| B | 7 | 252 | 23878 | 159.13 | 750 | 733 | 145.4 |
| C | 9 | 247 | 91345 | 537.92 | 716 | 718 | 168.5 |
| C | 1 | 16 | 14151 | 79.73 | 716 | 718 | 168.5 |
| C | 4 | 253 | 6871 | 36.52 | 716 | 718 | 168.5 |
| D | 13 | 223 | 135992 | 788.34 | 711 | 691 | 171.6 |
| D | 13 | 239 | 40829 | 233.87 | 711 | 691 | 171.6 |
| D | 10 | 187 | 29061 | 165.3 | 711 | 691 | 171.6 |
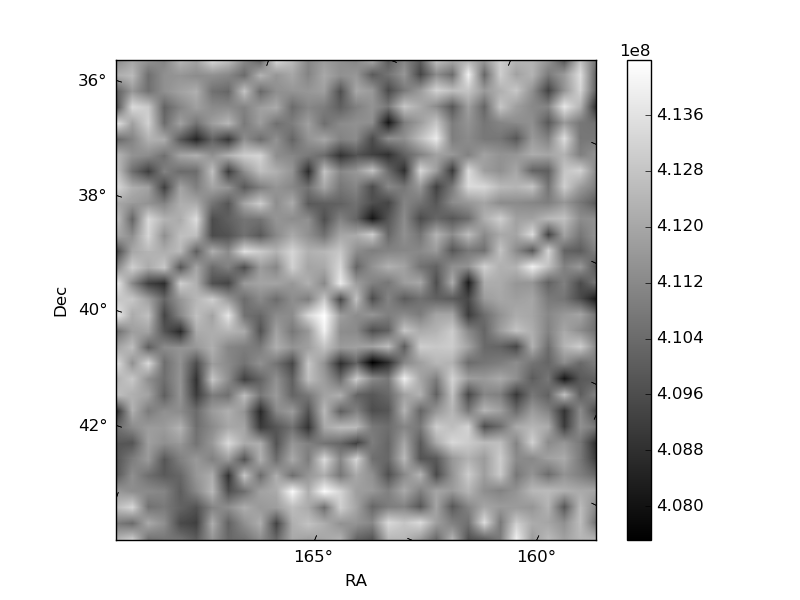
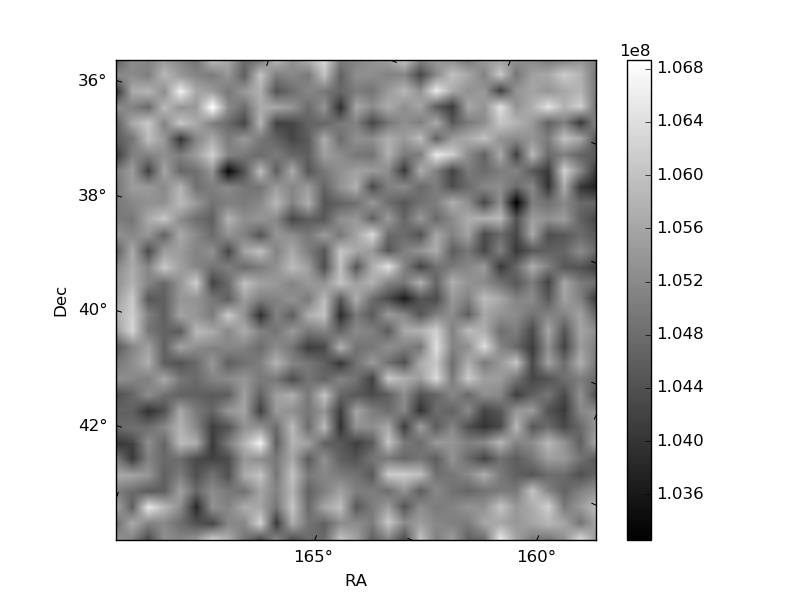
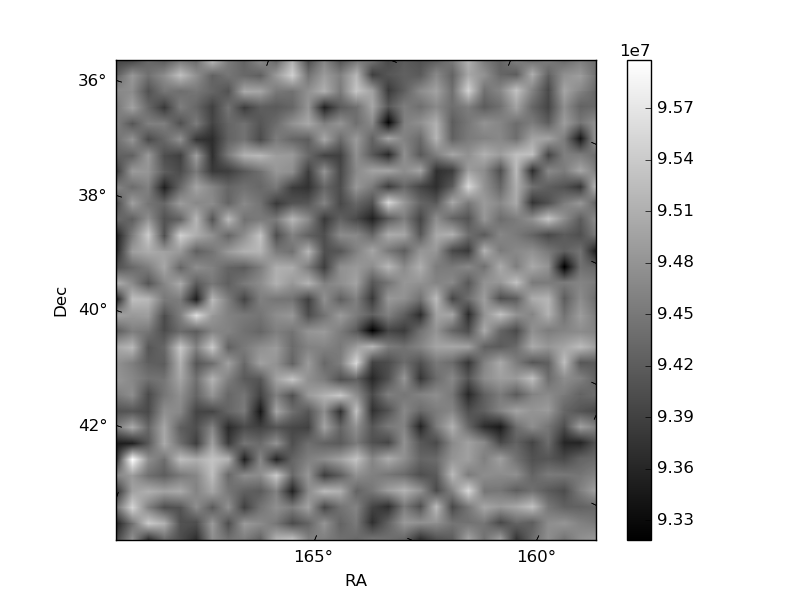
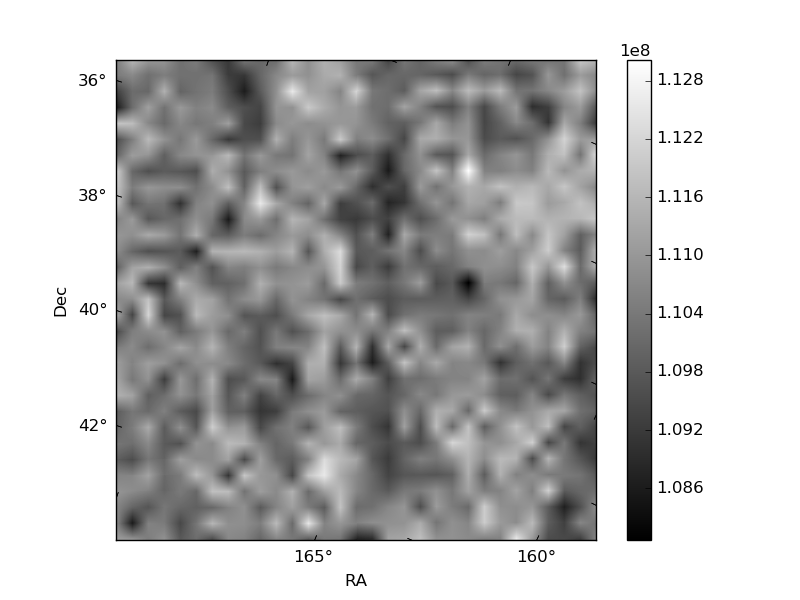
Histogram calculated using DETX and DETY for each event in the final _common_clean file
| Quadrant A | 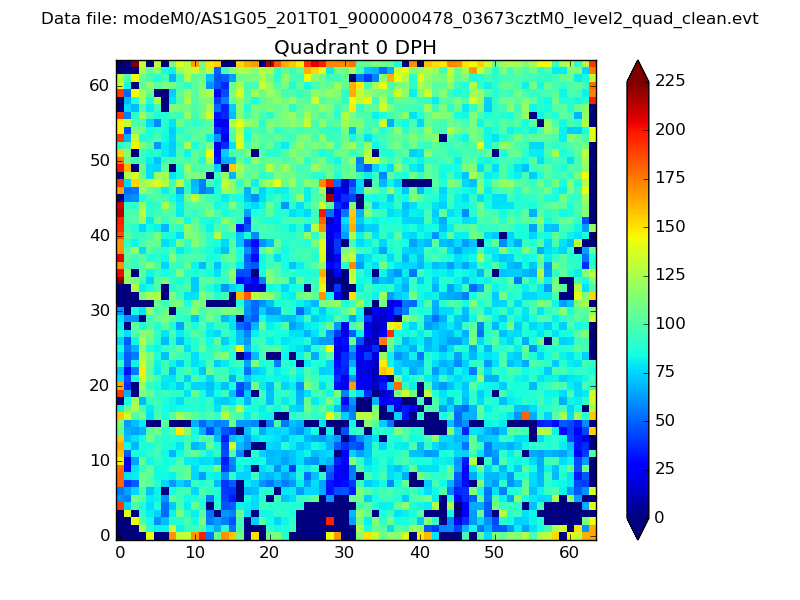 |
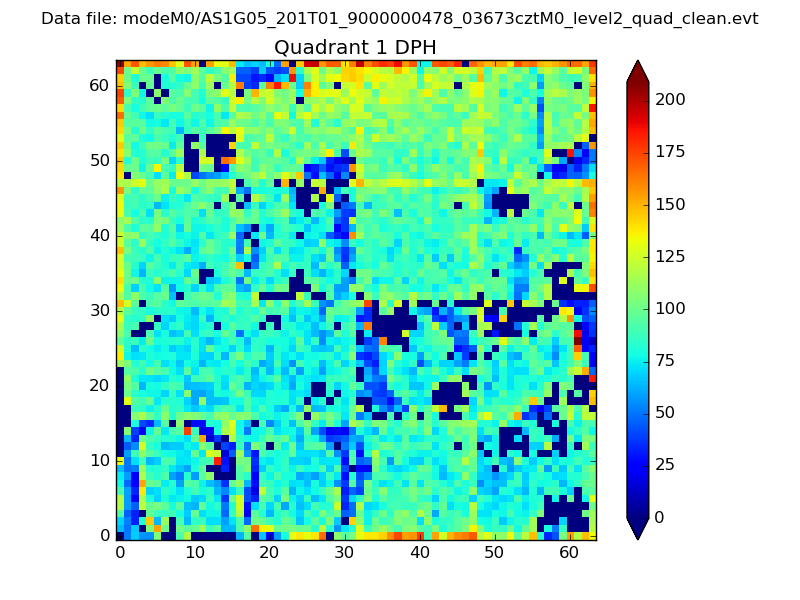 |
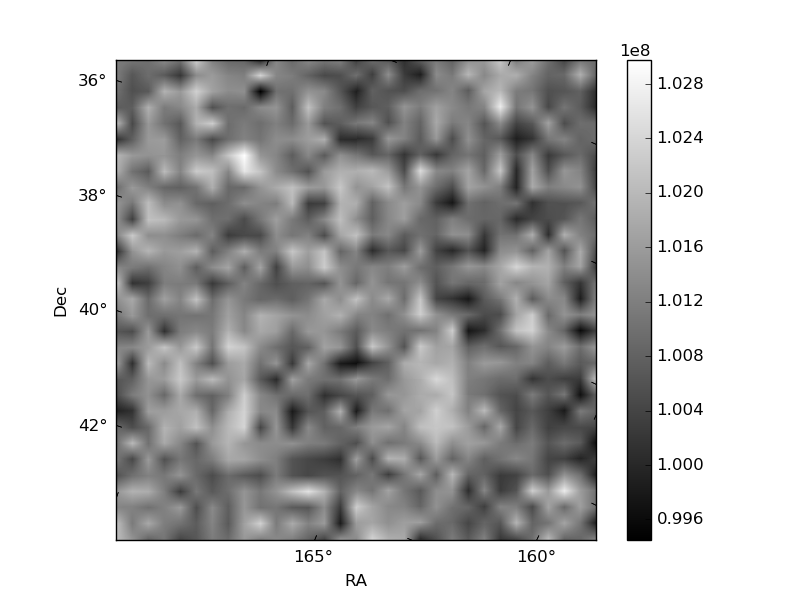
Quadrant B |
|---|---|---|---|
| Quadrant D | 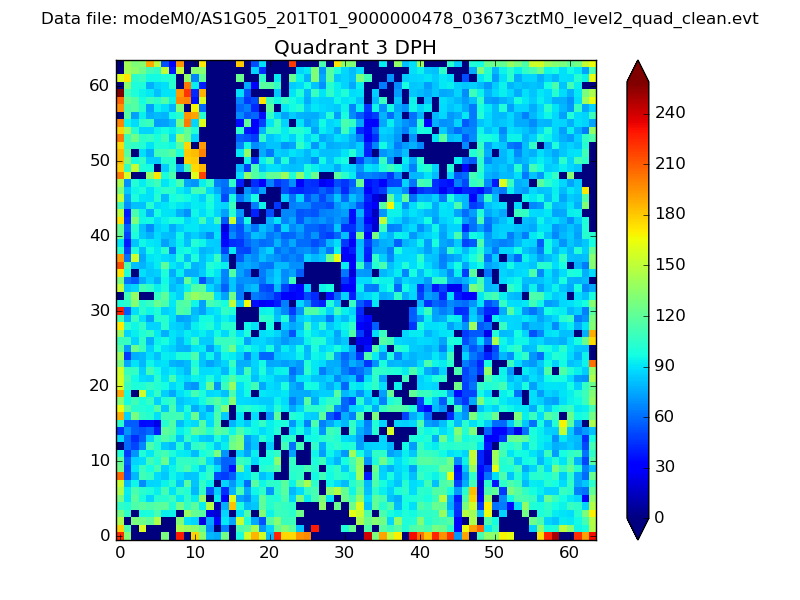 |
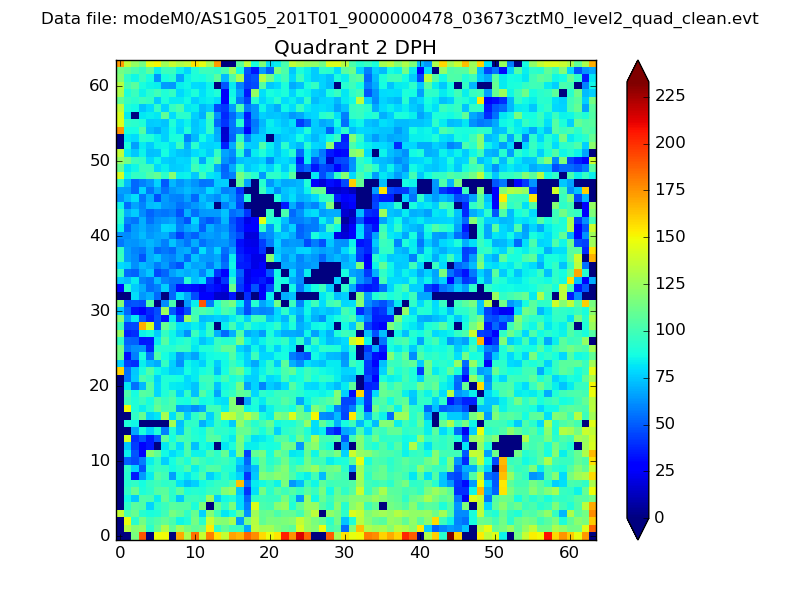 |
Quadrant C |
| Plot type | Count rate plots | Images |
|---|---|---|
| Comparison with Poisson distribution Blue bars denote a histogram of data divided into 1 sec bins. Red curve is a Poisson curve with rate = median count rate of data. |
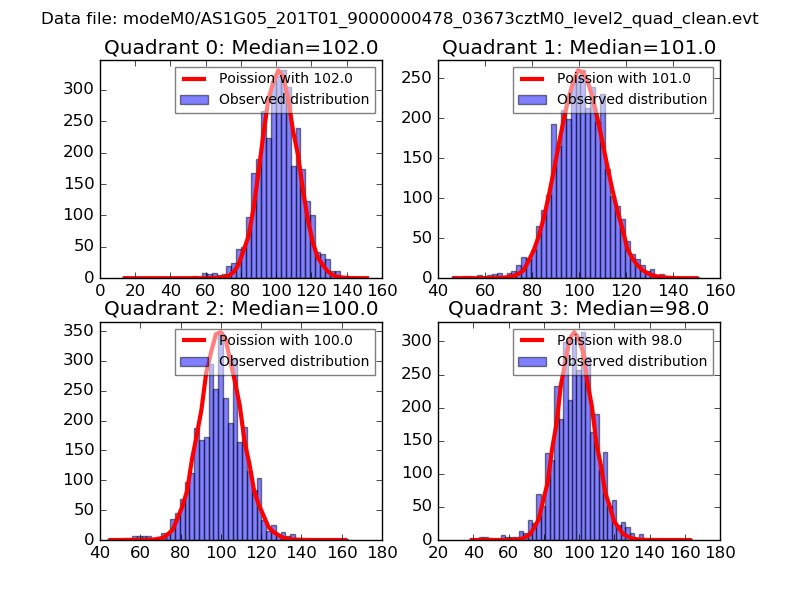 |
 |
| Quadrant-wise count rates Data is divided into 100 sec bins |
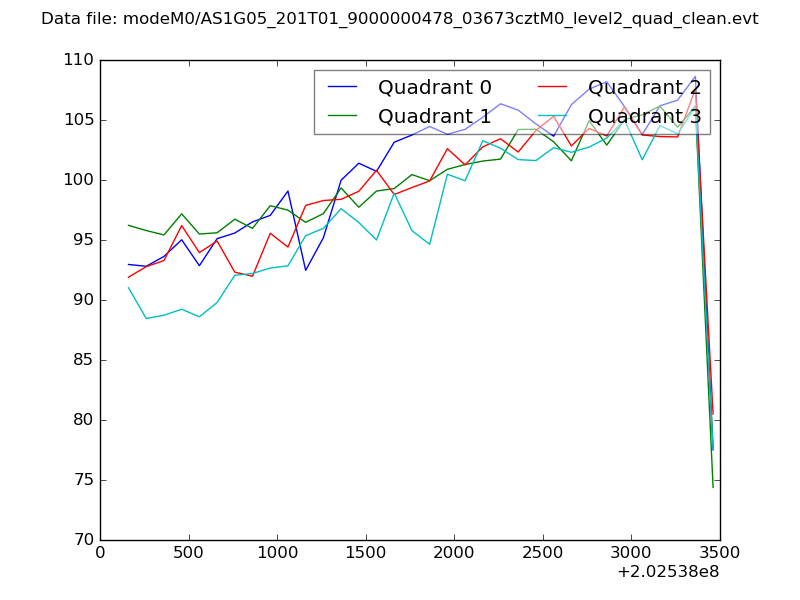 |
|
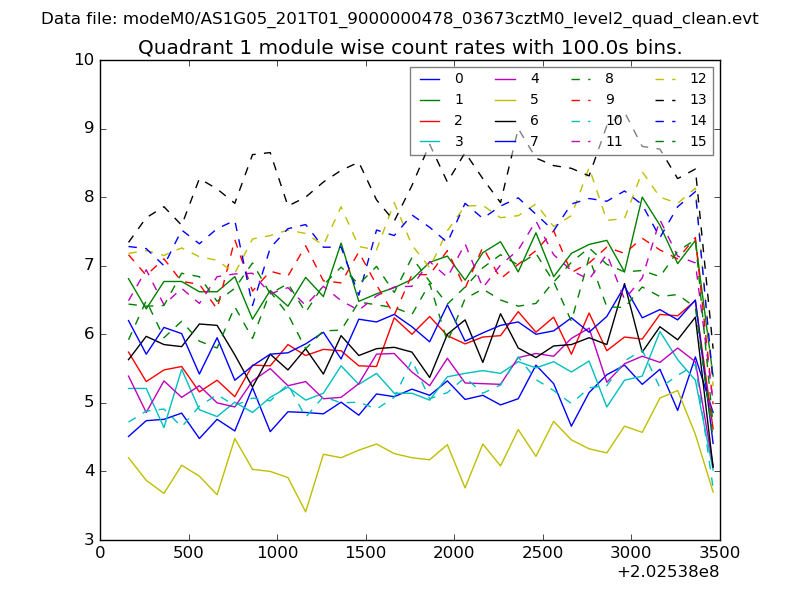
| Module-wise count rates for Quadrant A Data is divided into 100 sec bins |
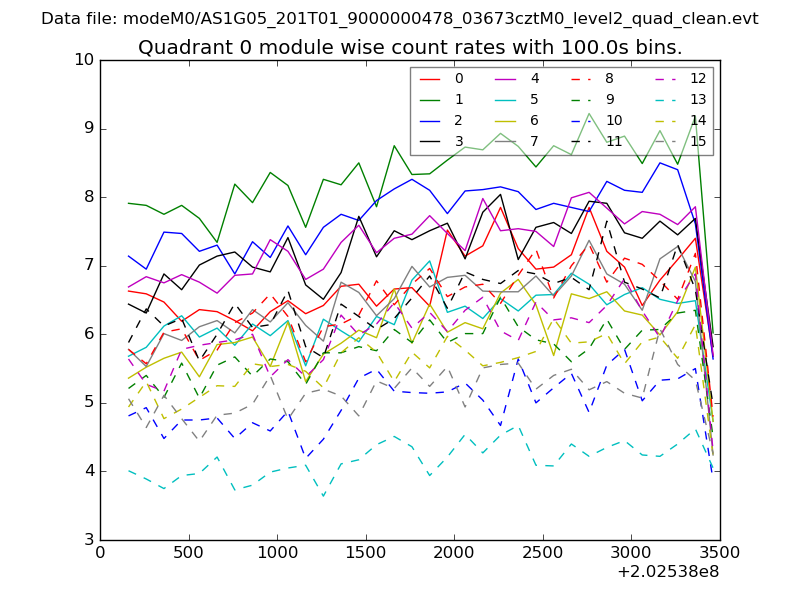 |
 |
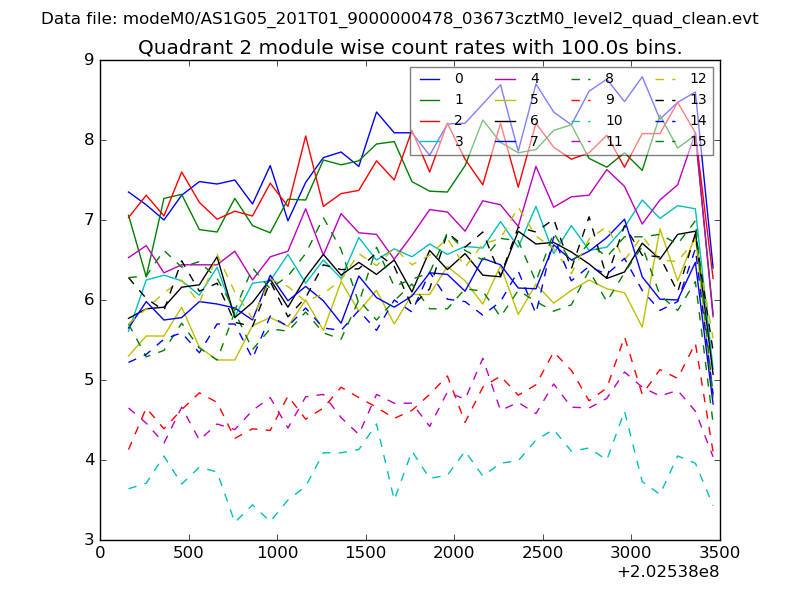
| Module-wise count rates for Quadrant B Data is divided into 100 sec bins |
 |
 |
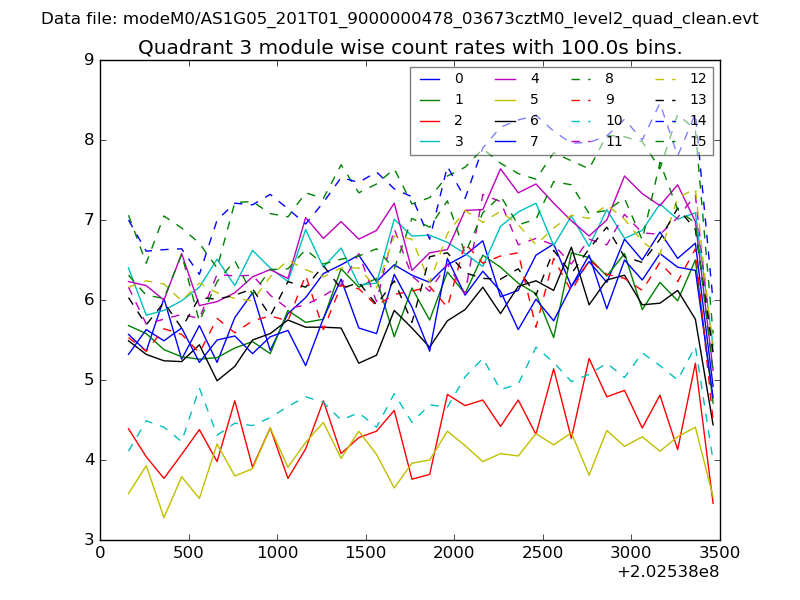
| Module-wise count rates for Quadrant C Data is divided into 100 sec bins |
 |
 |
| Module-wise count rates for Quadrant D Data is divided into 100 sec bins |
 |
 |
| Parameter | Plot |
|---|---|
| CZT HV Monitor | 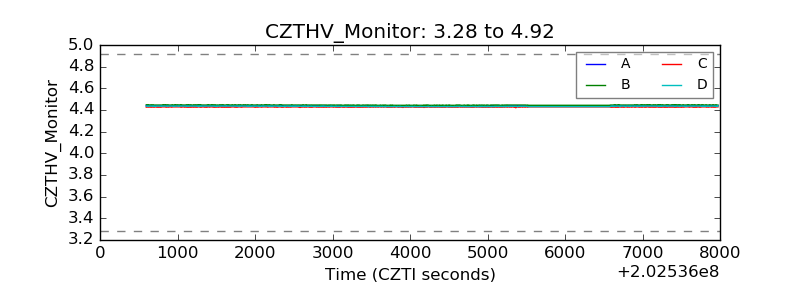 |
| D_VDD | 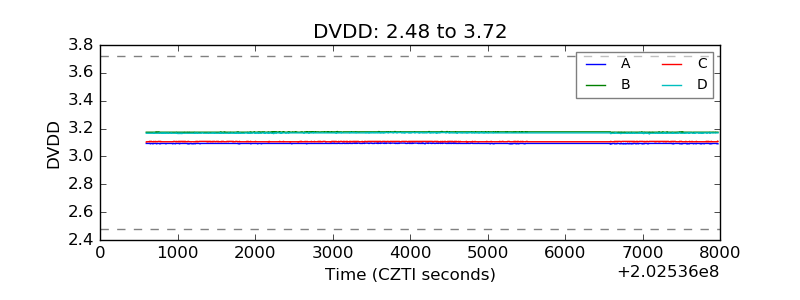 |
| Temperature 1 | 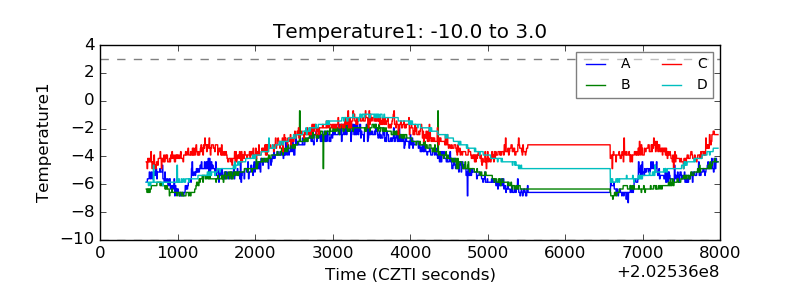 |
| Veto HV Monitor | 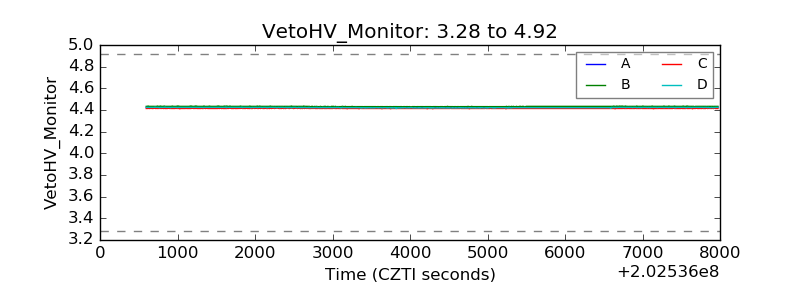 |
| Veto LLD | 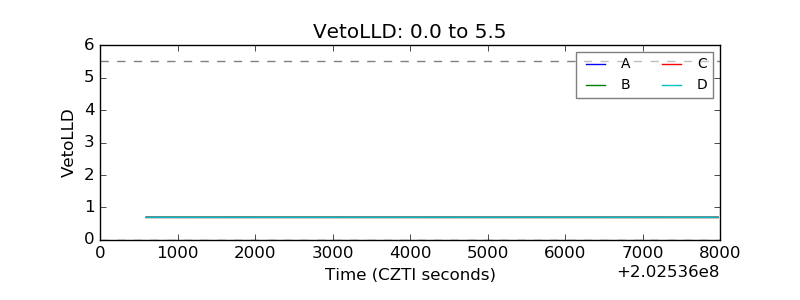 |
| Alpha Counter | 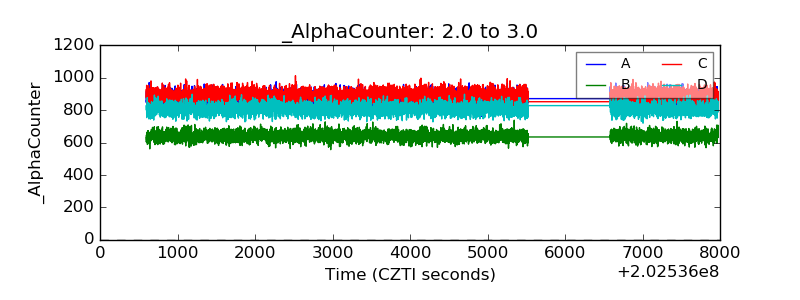 |
| _CPM_Rate | 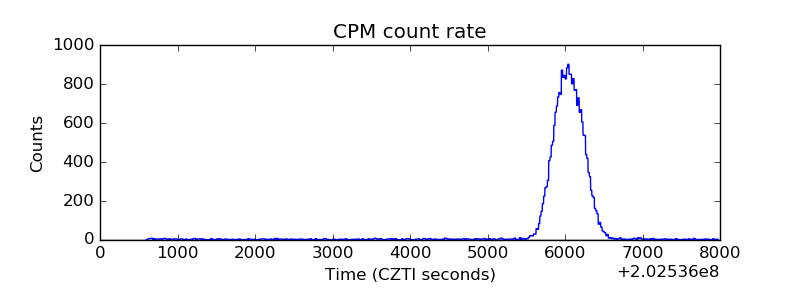 |
| CZT Counter | 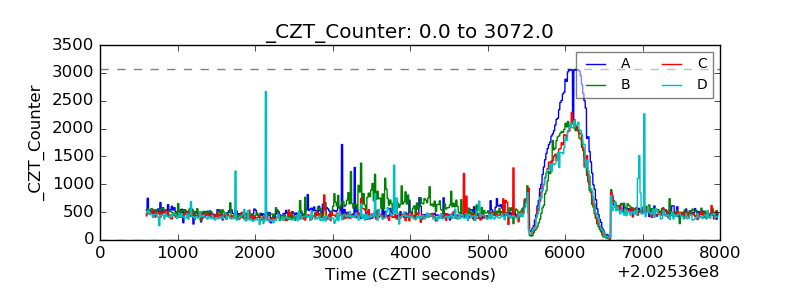 |
| +2.5 Volts monitor |  |
| +5 Volts monitor |  |
| _ROLL_ROT | 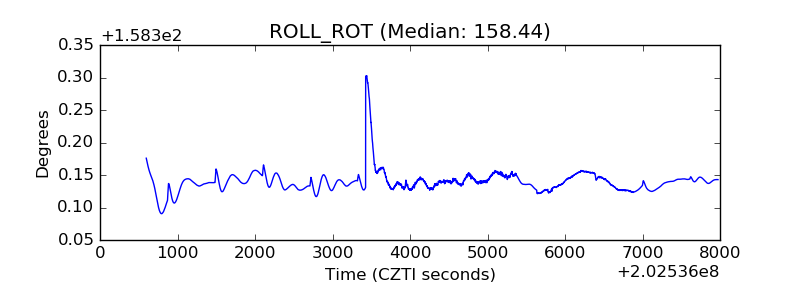 |
| _Roll_DEC | 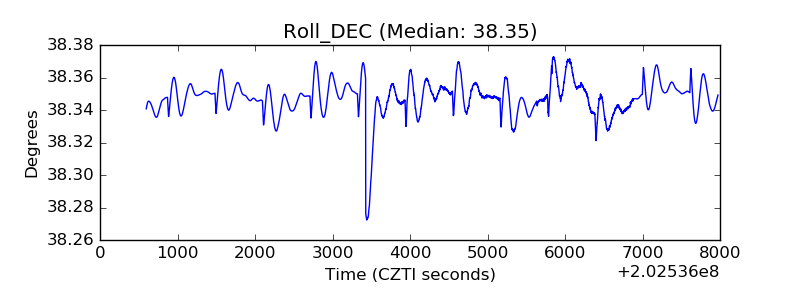 |
| _Roll_RA | 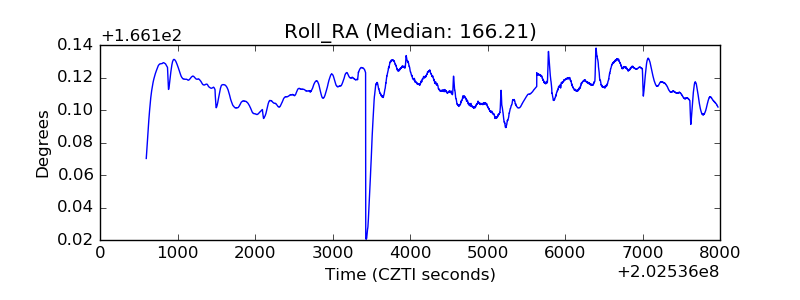 |
| Veto Counter | 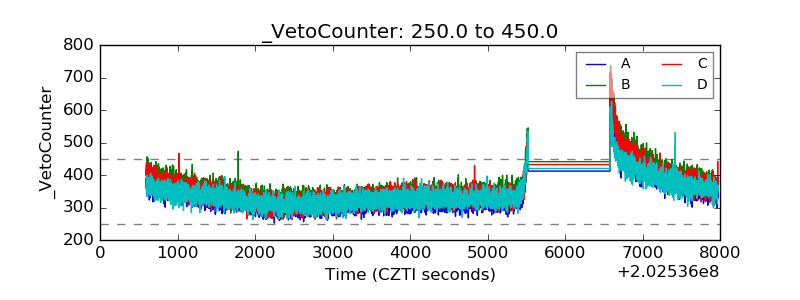 |