| Param | Original file | Final file |
|---|---|---|
| Filename | modeM0/AS1G05_201T01_9000000478_03674cztM0_level2.evt | modeM0/AS1G05_201T01_9000000478_03674cztM0_level2_quad_clean.evt |
| Size (bytes) | 438,615,360 | 69,379,200 |
| Size | 418.3 MB | 66.2 MB |
| Events in quadrant A | 3,091,347 | 420,598 |
| Events in quadrant B | 3,650,516 | 415,927 |
| Events in quadrant C | 3,039,270 | 413,507 |
| Events in quadrant D | 3,065,721 | 402,554 |
| Mode M9 | |||
|---|---|---|---|
| Quadrant | BADHDUFLAG | Total packets | Discarded packets |
| A | 0 | 15 | 0 |
| B | 0 | 15 | 0 |
| C | 0 | 15 | 0 |
| D | 0 | 16 | 0 |
| Mode M0 | |||
|---|---|---|---|
| Quadrant | BADHDUFLAG | Total packets | Discarded packets |
| A | 0 | 13372 | 0 |
| B | 0 | 14775 | 0 |
| C | 0 | 13348 | 0 |
| D | 0 | 13630 | 0 |
| Mode SS | |||
|---|---|---|---|
| Quadrant | BADHDUFLAG | Total packets | Discarded packets |
| A | 0 | 130 | 0 |
| B | 0 | 130 | 0 |
| C | 0 | 130 | 0 |
| D | 0 | 130 | 0 |
| Quadrant | Total seconds | Saturated seconds | Saturation percentage |
|---|---|---|---|
| A | 6423 | 72 | 1.120972% |
| B | 6423 | 142 | 2.210805% |
| C | 6423 | 44 | 0.685038% |
| D | 6423 | 79 | 1.229955% |
Noise dominated data is calculated using 1-second bins in cleaned event files. If a bin has >2000 counts, and if more than 50% of those come from <1% of pixels, then it is considered to be noise-dominated and hence unusable.
| Quadrant | # 1 sec bins | Bins with >0 counts | Bins with >2000 counts | High rate bins dominated by noise | Noise dominated (total time) | Noise dominated (detector-on time) | Marked lightcurve |
|---|---|---|---|---|---|---|---|
| A | 7578 | 6424 | 0 | 0 | 0.00% | 0.00% |  |
| B | 7578 | 6424 | 41 | 41 | 0.54% | 0.64% |  |
| C | 7578 | 6424 | 3 | 3 | 0.04% | 0.05% |  |
| D | 7578 | 6424 | 32 | 32 | 0.42% | 0.50% |  |
Top three noisy pixels from each quadrant. If the there are fewer than three noisy pixels in the level2.evt file, extra rows are filled as -1
| Pixel properties | Quadrant properties | ||||||
|---|---|---|---|---|---|---|---|
| Quadrant | DetID | PixID | Counts | Sigma | Mean | Median | Sigma |
| A | 13 | 164 | 25425 | 153.36 | 787 | 771 | 160.8 |
| A | 0 | 50 | 11018 | 63.74 | 787 | 771 | 160.8 |
| A | 13 | 251 | 10858 | 62.75 | 787 | 771 | 160.8 |
| B | 14 | 167 | 200058 | 1299.26 | 792 | 774 | 153.4 |
| B | 15 | 204 | 183491 | 1191.25 | 792 | 774 | 153.4 |
| B | 4 | 81 | 76208 | 491.8 | 792 | 774 | 153.4 |
| C | 9 | 247 | 65253 | 365.25 | 755 | 759 | 176.6 |
| C | 12 | 4 | 15848 | 85.45 | 755 | 759 | 176.6 |
| C | 8 | 208 | 6347 | 31.65 | 755 | 759 | 176.6 |
| D | 13 | 223 | 118202 | 654.77 | 753 | 734 | 179.4 |
| D | 10 | 34 | 24896 | 134.68 | 753 | 734 | 179.4 |
| D | 10 | 187 | 24826 | 134.29 | 753 | 734 | 179.4 |
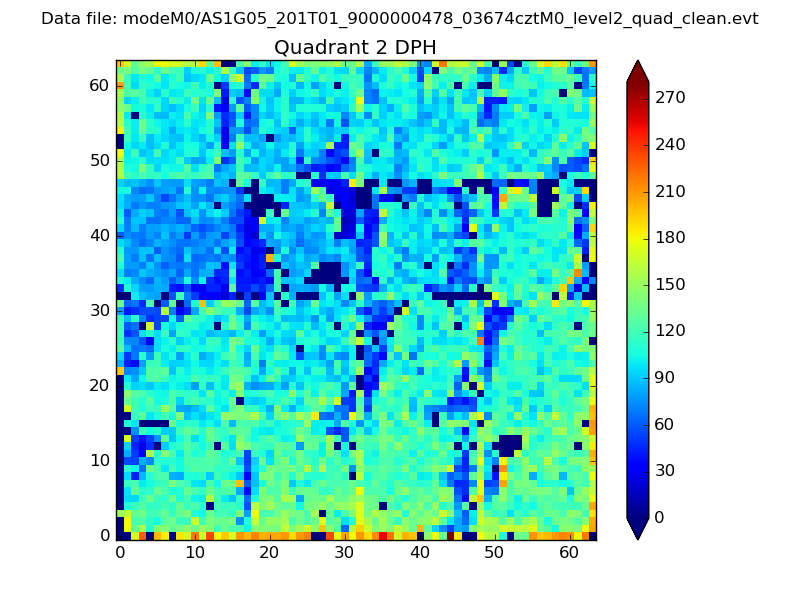
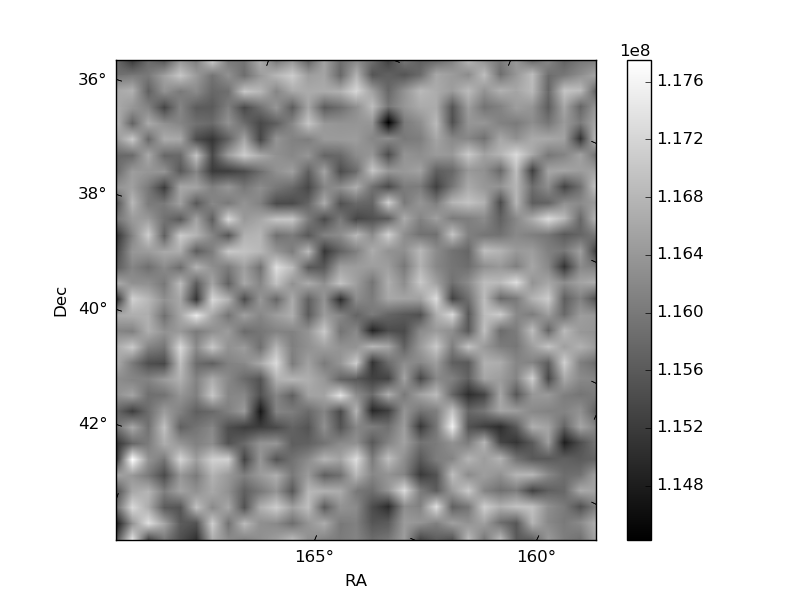
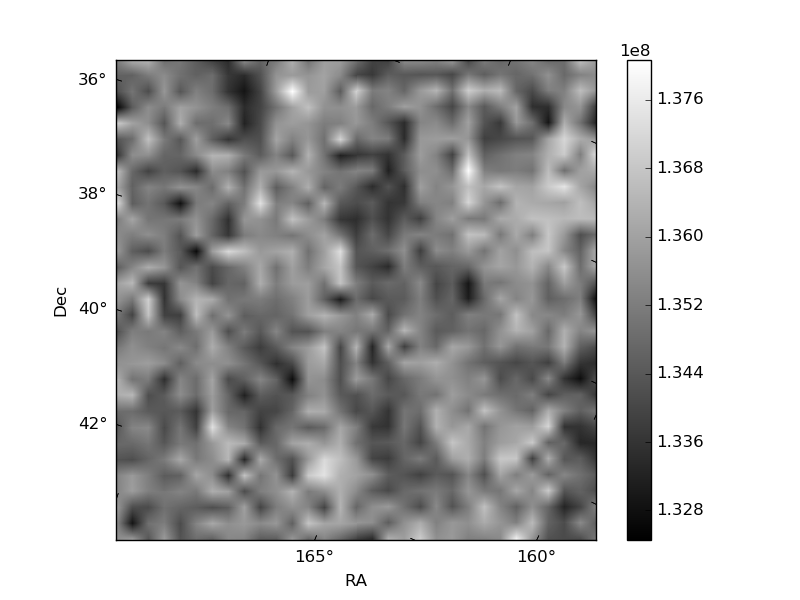
Histogram calculated using DETX and DETY for each event in the final _common_clean file
| Quadrant A | 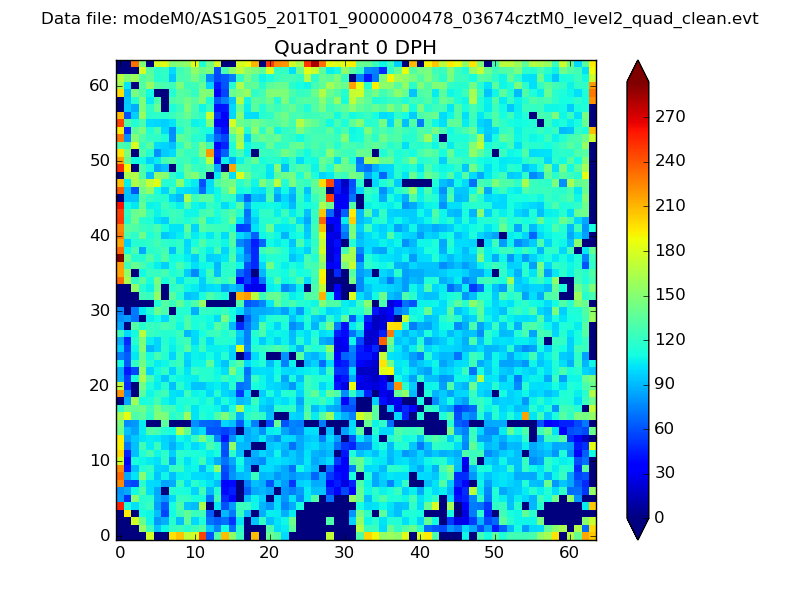 |
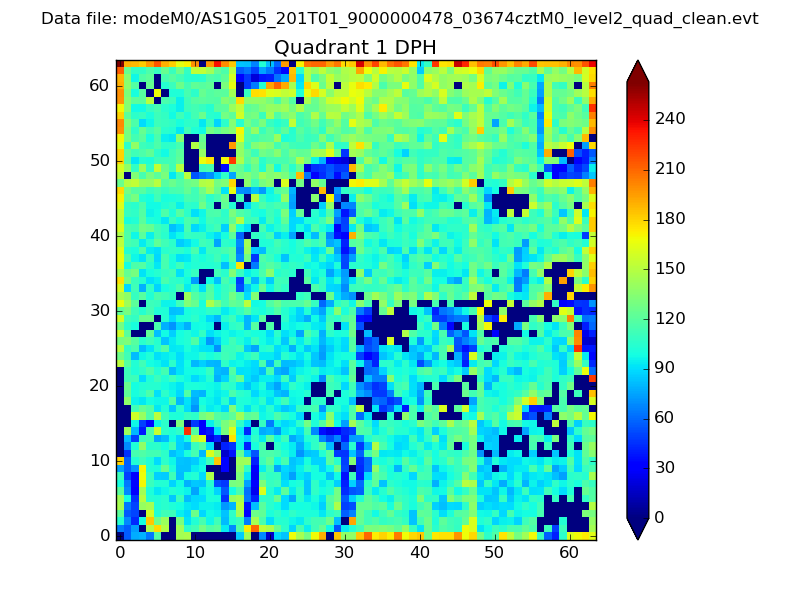 |
Quadrant B |
|---|---|---|---|
| Quadrant D | 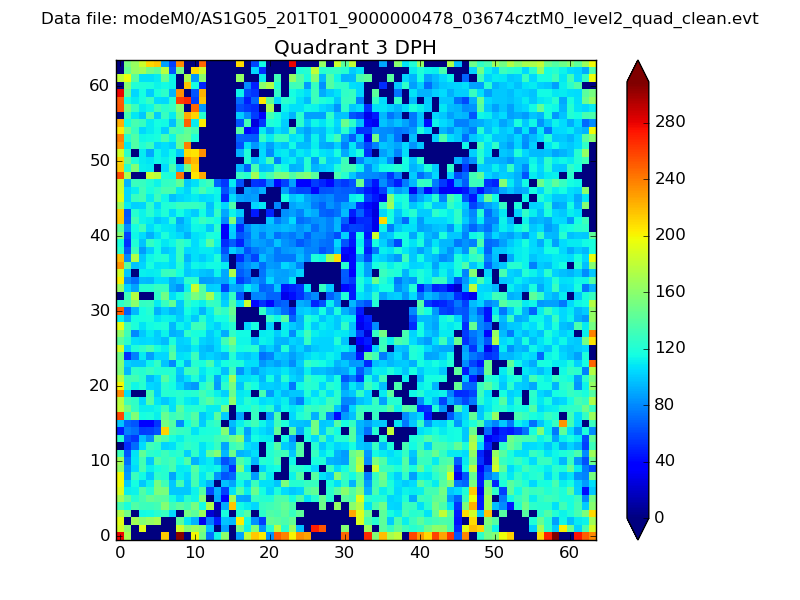 |
 |
Quadrant C |
| Plot type | Count rate plots | Images |
|---|---|---|
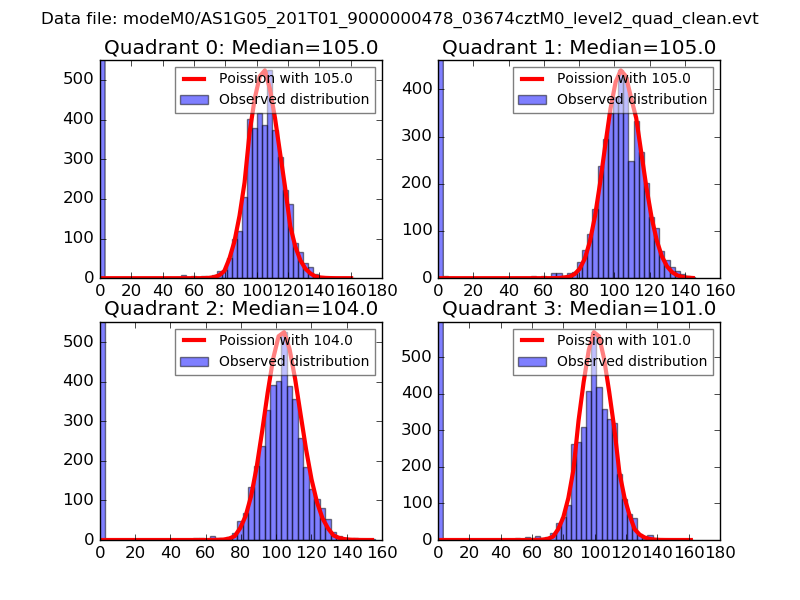
| Comparison with Poisson distribution Blue bars denote a histogram of data divided into 1 sec bins. Red curve is a Poisson curve with rate = median count rate of data. |
 |
 |
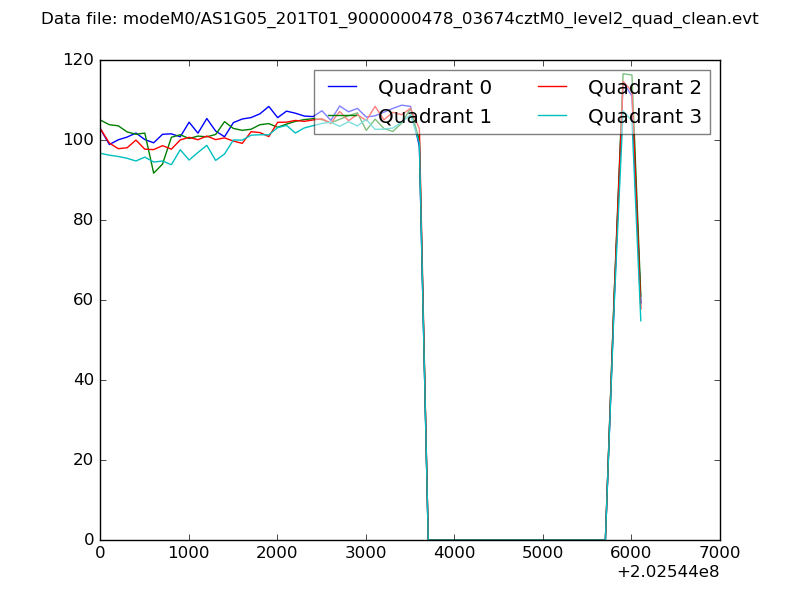
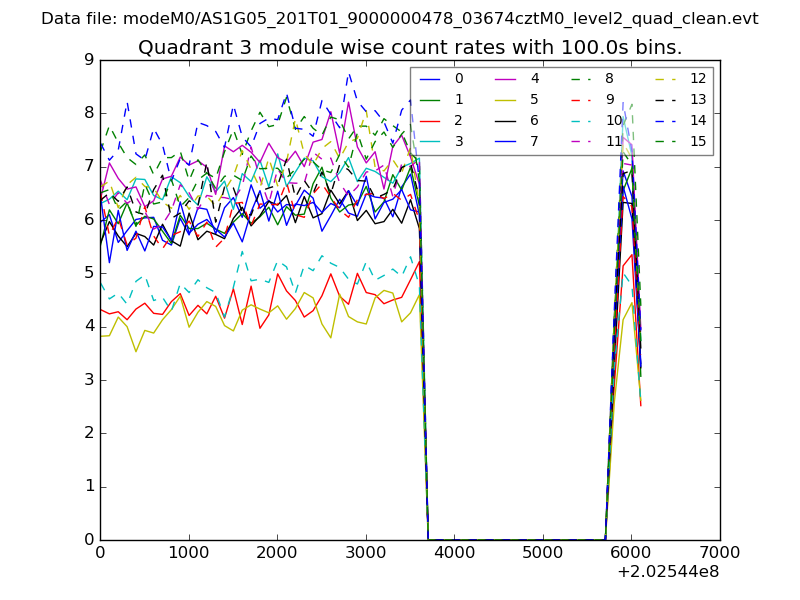
| Quadrant-wise count rates Data is divided into 100 sec bins |
 |
|
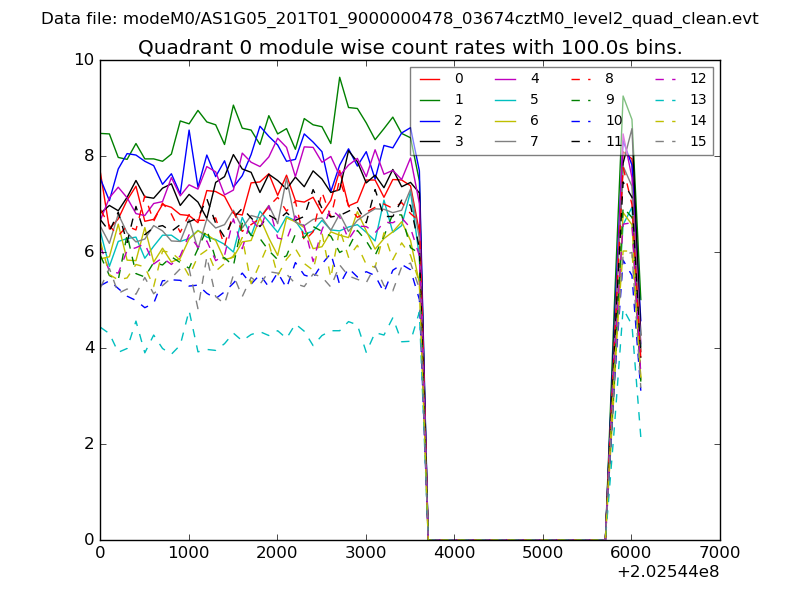
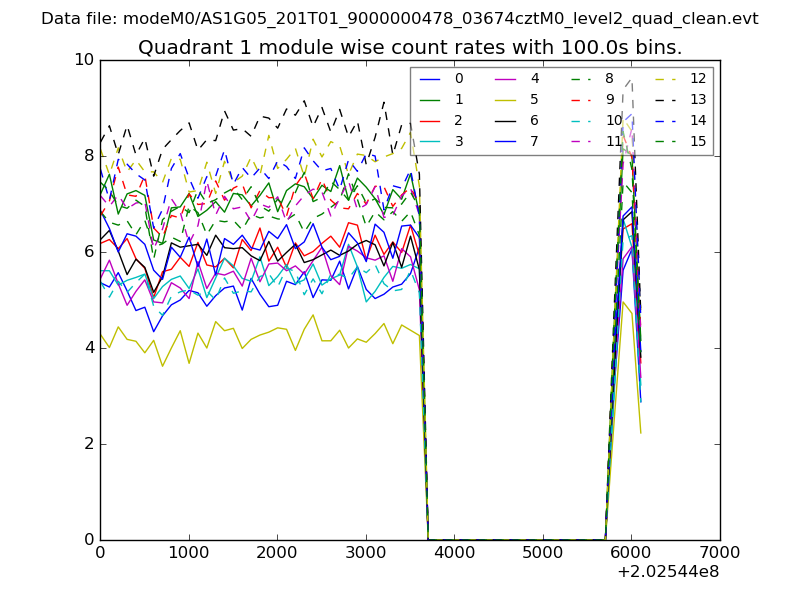
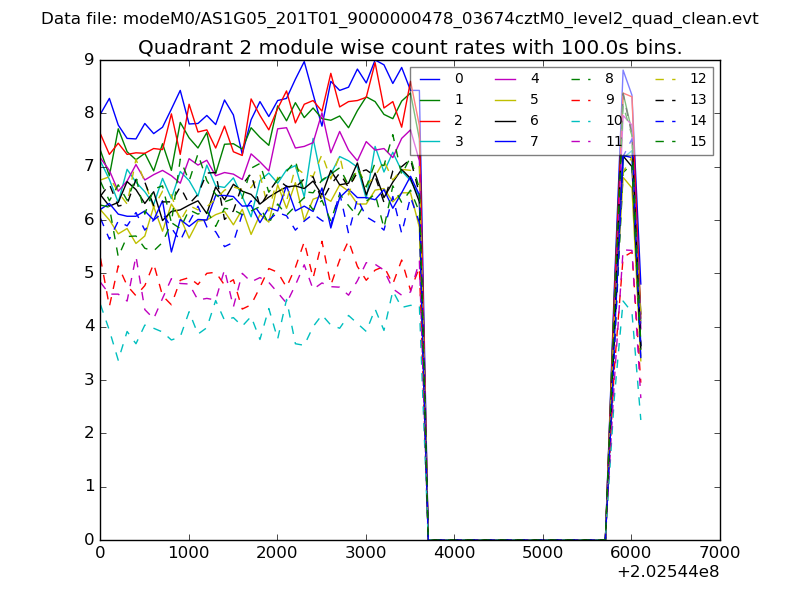
| Module-wise count rates for Quadrant A Data is divided into 100 sec bins |
 |
 |
| Module-wise count rates for Quadrant B Data is divided into 100 sec bins |
 |
 |
| Module-wise count rates for Quadrant C Data is divided into 100 sec bins |
 |
 |
| Module-wise count rates for Quadrant D Data is divided into 100 sec bins |
 |
 |
| Parameter | Plot |
|---|---|
| CZT HV Monitor | 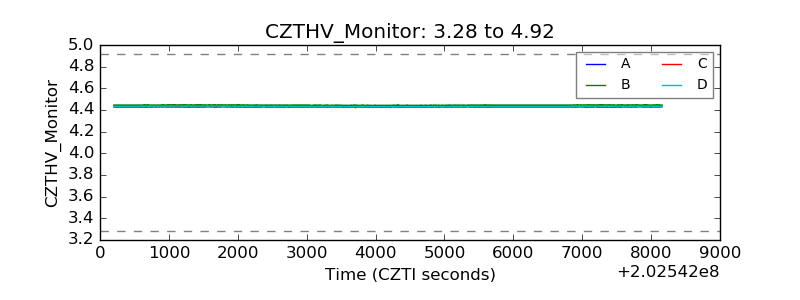 |
| D_VDD | 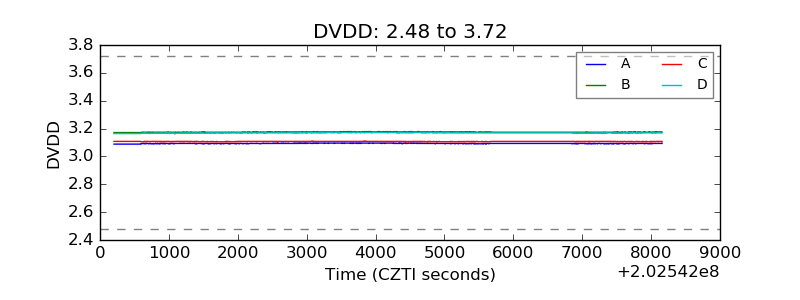 |
| Temperature 1 | 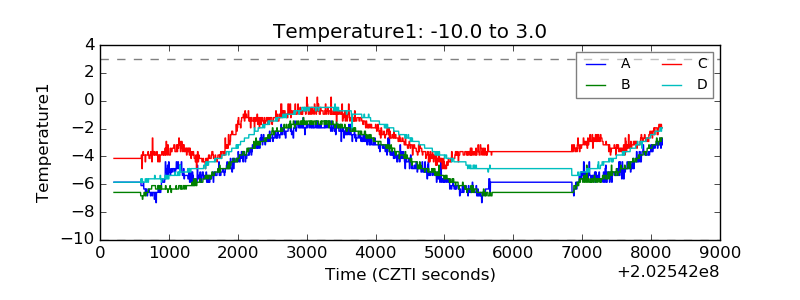 |
| Veto HV Monitor | 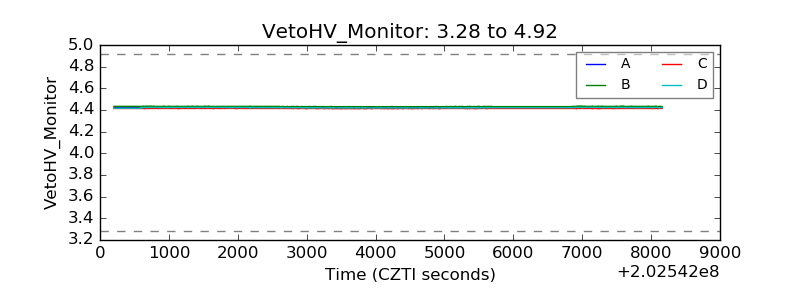 |
| Veto LLD | 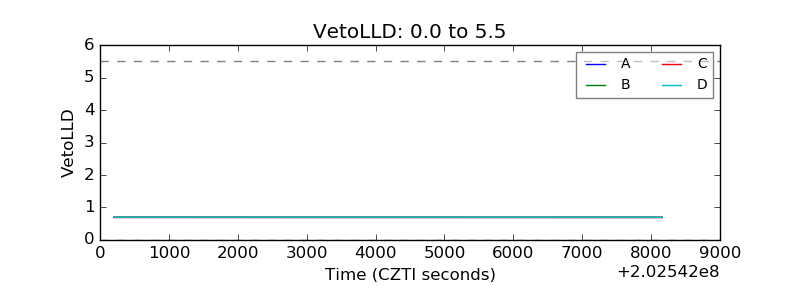 |
| Alpha Counter | 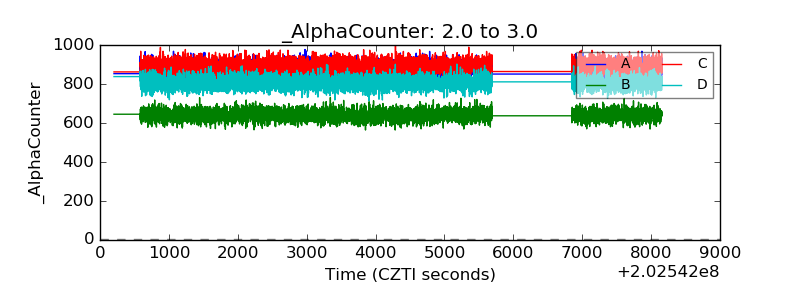 |
| _CPM_Rate | 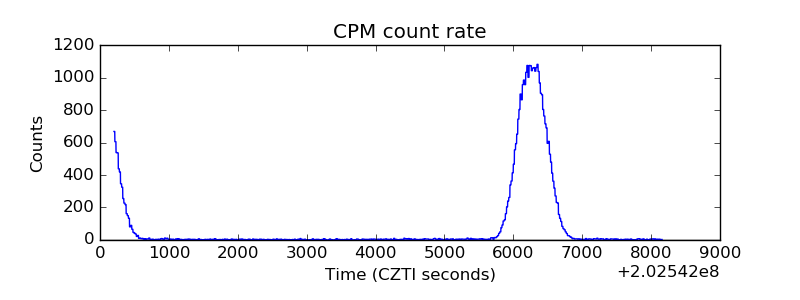 |
| CZT Counter | 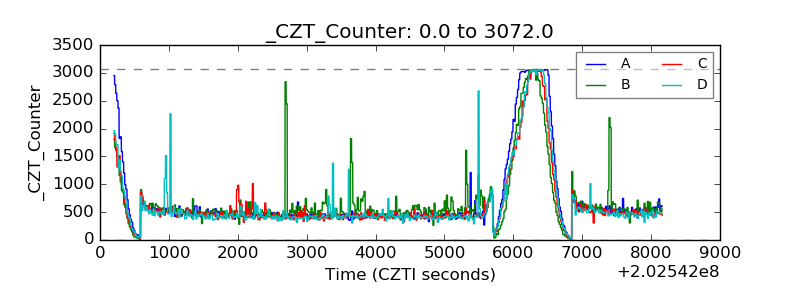 |
| +2.5 Volts monitor | 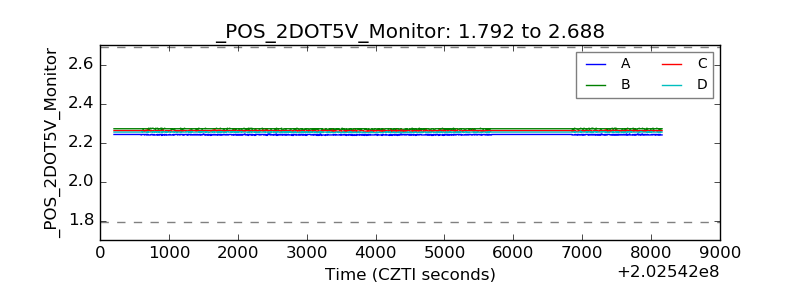 |
| +5 Volts monitor | 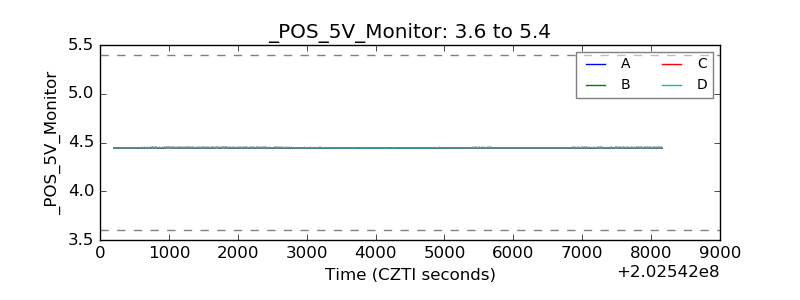 |
| Veto Counter | 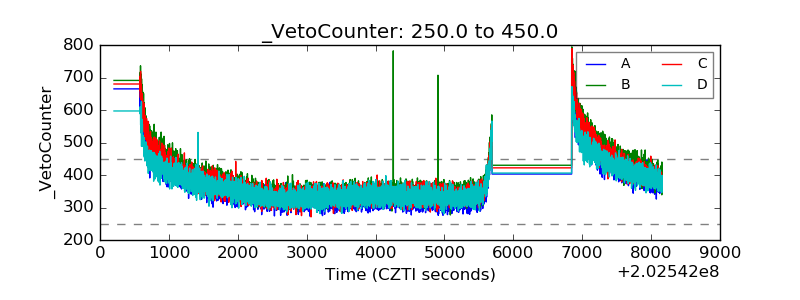 |