| Param | Original file | Final file |
|---|---|---|
| Filename | modeM0/AS1G05_201T01_9000000478_03675cztM0_level2.evt | modeM0/AS1G05_201T01_9000000478_03675cztM0_level2_quad_clean.evt |
| Size (bytes) | 457,574,400 | 77,705,280 |
| Size | 436.4 MB | 74.1 MB |
| Events in quadrant A | 3,351,300 | 485,950 |
| Events in quadrant B | 3,768,435 | 484,457 |
| Events in quadrant C | 3,098,624 | 474,588 |
| Events in quadrant D | 3,204,933 | 462,063 |
| Mode M9 | |||
|---|---|---|---|
| Quadrant | BADHDUFLAG | Total packets | Discarded packets |
| A | 0 | 20 | 0 |
| B | 0 | 20 | 0 |
| C | 0 | 20 | 0 |
| D | 0 | 21 | 0 |
| Mode M0 | |||
|---|---|---|---|
| Quadrant | BADHDUFLAG | Total packets | Discarded packets |
| A | 0 | 14053 | 3 |
| B | 0 | 15174 | 2 |
| C | 0 | 13379 | 2 |
| D | 0 | 13857 | 2 |
| Mode SS | |||
|---|---|---|---|
| Quadrant | BADHDUFLAG | Total packets | Discarded packets |
| A | 0 | 132 | 0 |
| B | 0 | 132 | 0 |
| C | 0 | 132 | 0 |
| D | 0 | 132 | 0 |
| Quadrant | Total seconds | Saturated seconds | Saturation percentage |
|---|---|---|---|
| A | 6383 | 142 | 2.224659% |
| B | 6383 | 186 | 2.913990% |
| C | 6383 | 89 | 1.394329% |
| D | 6383 | 137 | 2.146326% |
Noise dominated data is calculated using 1-second bins in cleaned event files. If a bin has >2000 counts, and if more than 50% of those come from <1% of pixels, then it is considered to be noise-dominated and hence unusable.
| Quadrant | # 1 sec bins | Bins with >0 counts | Bins with >2000 counts | High rate bins dominated by noise | Noise dominated (total time) | Noise dominated (detector-on time) | Marked lightcurve |
|---|---|---|---|---|---|---|---|
| A | 7568 | 6383 | 8 | 8 | 0.11% | 0.13% | 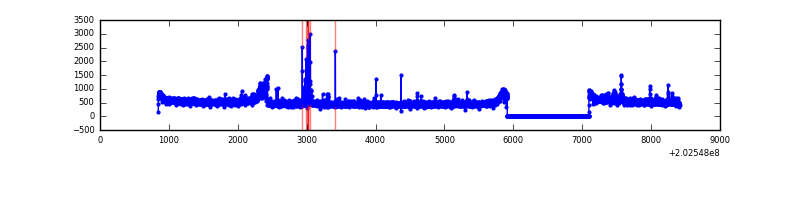 |
| B | 7568 | 6383 | 53 | 53 | 0.70% | 0.83% | 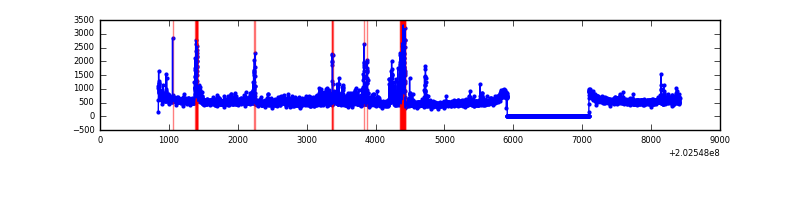 |
| C | 7568 | 6383 | 5 | 5 | 0.07% | 0.08% | 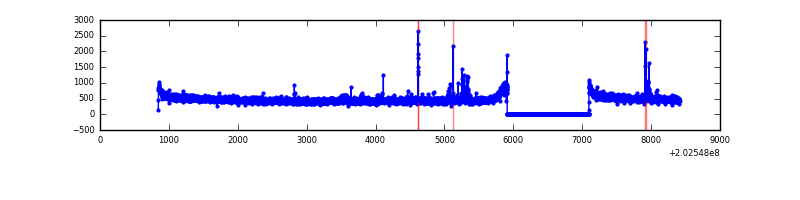 |
| D | 7568 | 6383 | 35 | 35 | 0.46% | 0.55% | 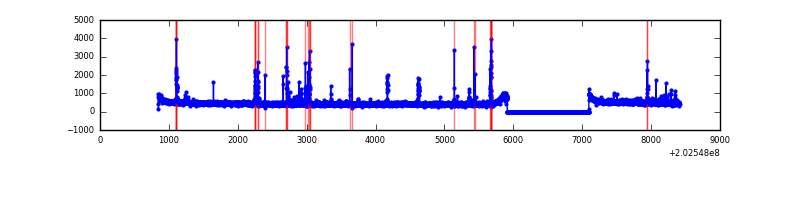 |
Top three noisy pixels from each quadrant. If the there are fewer than three noisy pixels in the level2.evt file, extra rows are filled as -1
| Pixel properties | Quadrant properties | ||||||
|---|---|---|---|---|---|---|---|
| Quadrant | DetID | PixID | Counts | Sigma | Mean | Median | Sigma |
| A | 13 | 164 | 109306 | 663.92 | 807 | 790 | 163.4 |
| A | 0 | 50 | 51673 | 311.31 | 807 | 790 | 163.4 |
| A | 13 | 251 | 51090 | 307.74 | 807 | 790 | 163.4 |
| B | 14 | 167 | 238989 | 1537.14 | 807 | 788 | 155.0 |
| B | 15 | 204 | 199744 | 1283.89 | 807 | 788 | 155.0 |
| B | 4 | 81 | 72229 | 461.02 | 807 | 788 | 155.0 |
| C | 1 | 16 | 36136 | 197.64 | 769 | 773 | 178.9 |
| C | 12 | 4 | 19131 | 102.6 | 769 | 773 | 178.9 |
| C | 9 | 247 | 17172 | 91.65 | 769 | 773 | 178.9 |
| D | 13 | 223 | 115102 | 612.46 | 777 | 755 | 186.7 |
| D | 14 | 34 | 31007 | 162.04 | 777 | 755 | 186.7 |
| D | 10 | 34 | 26306 | 136.86 | 777 | 755 | 186.7 |
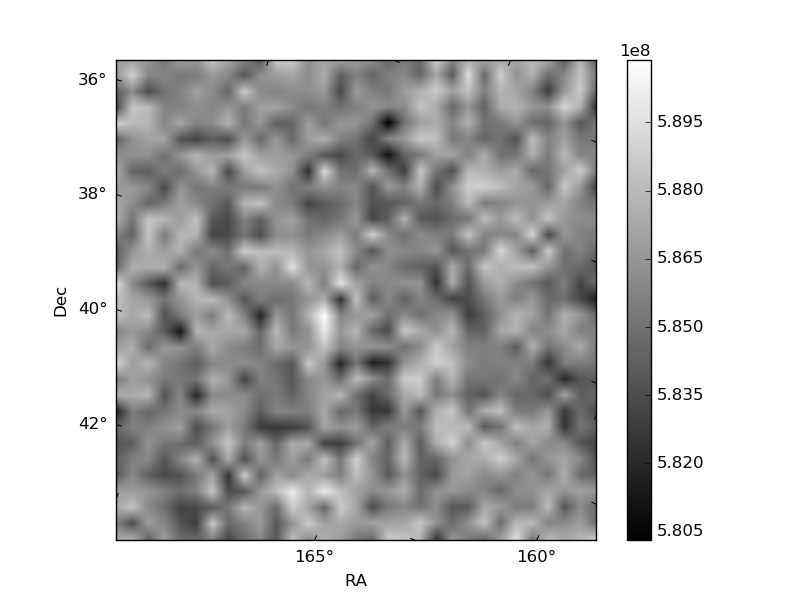
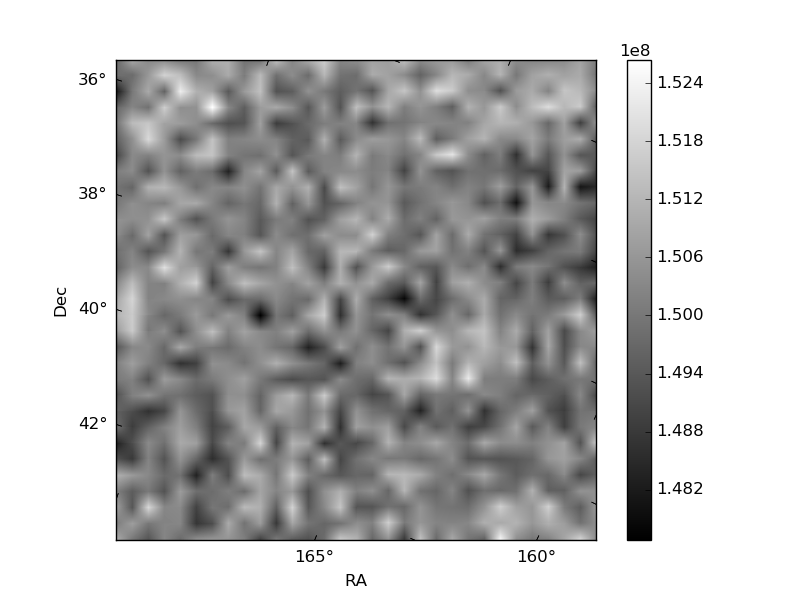
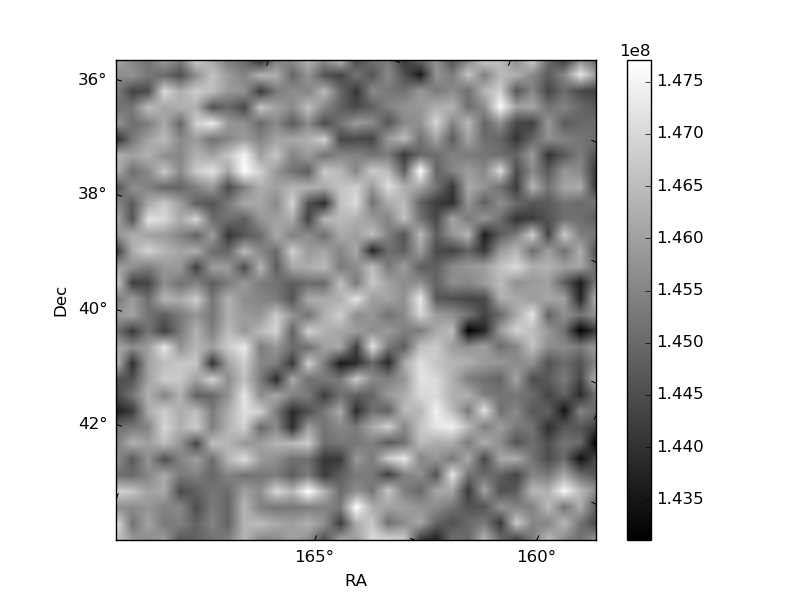
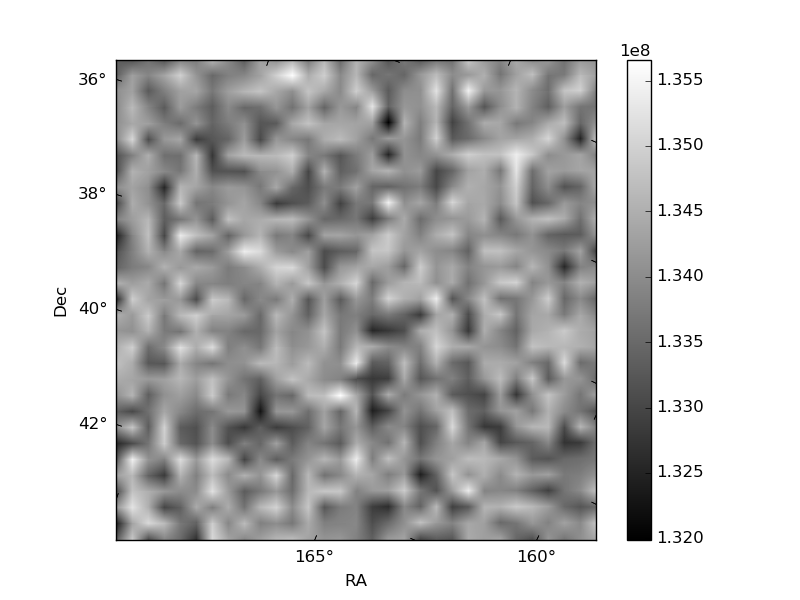
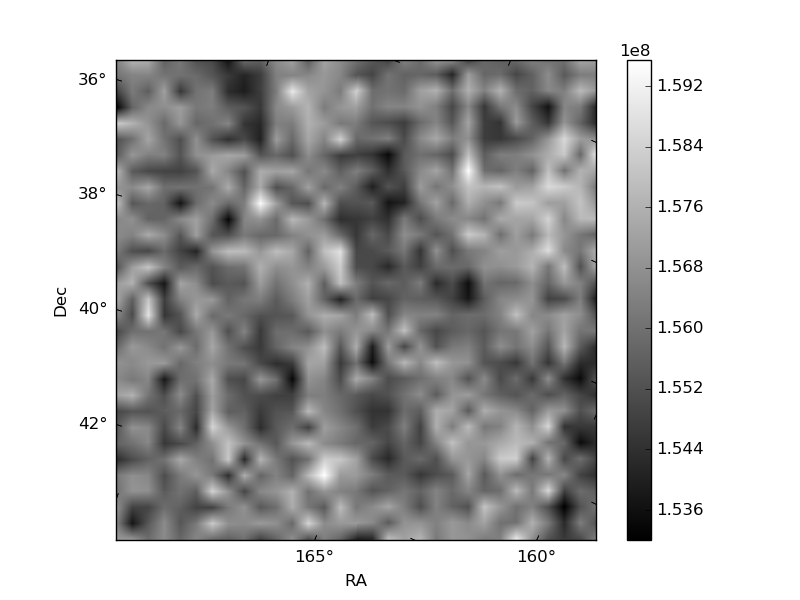
Histogram calculated using DETX and DETY for each event in the final _common_clean file
| Quadrant A | 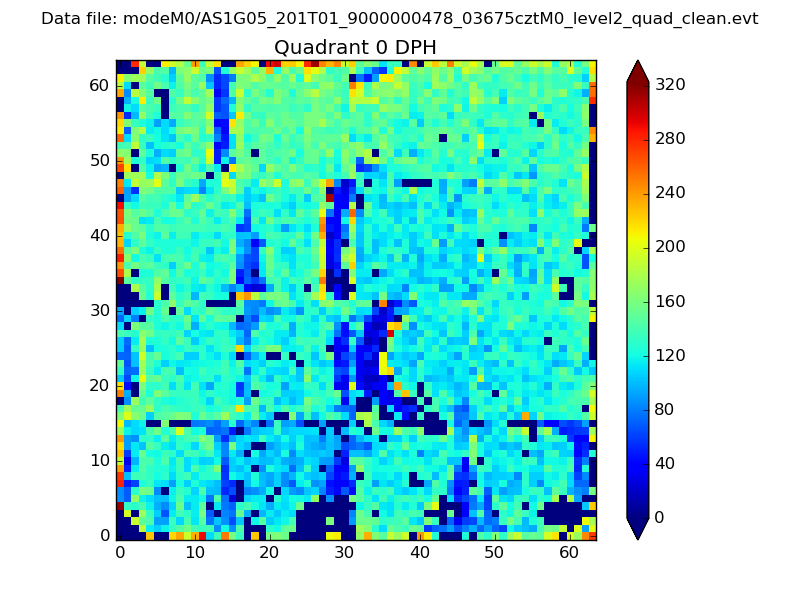 |
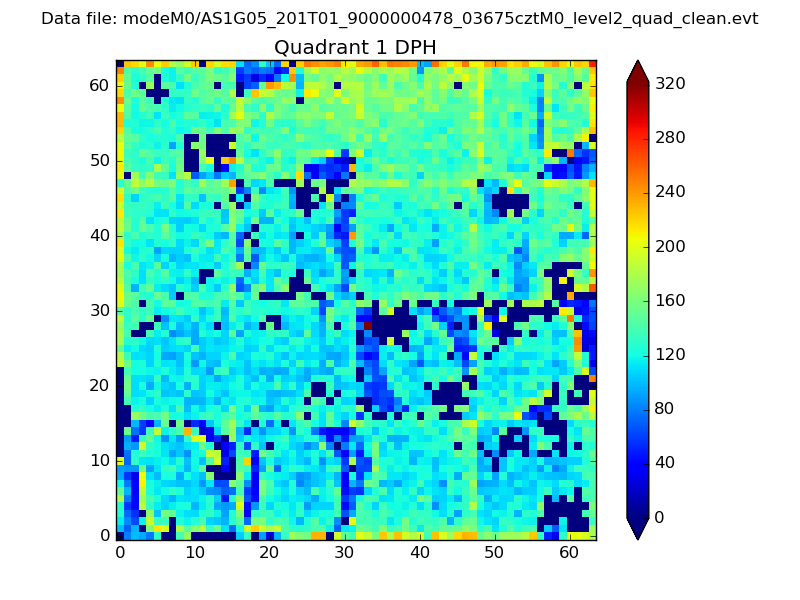 |
Quadrant B |
|---|---|---|---|
| Quadrant D | 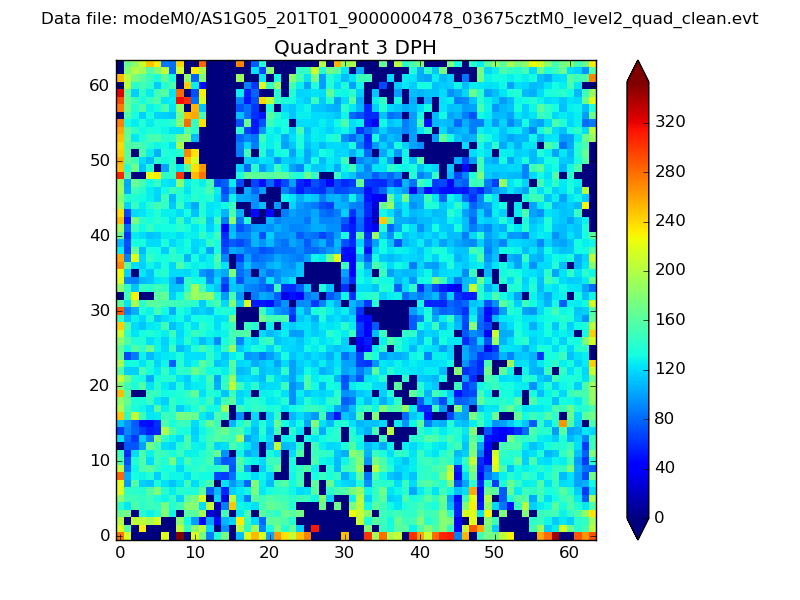 |
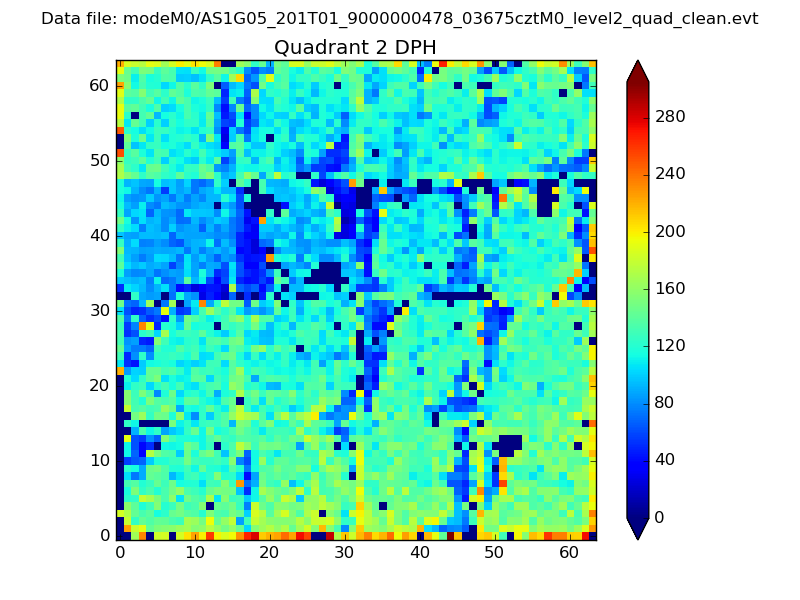 |
Quadrant C |
| Plot type | Count rate plots | Images |
|---|---|---|
| Comparison with Poisson distribution Blue bars denote a histogram of data divided into 1 sec bins. Red curve is a Poisson curve with rate = median count rate of data. |
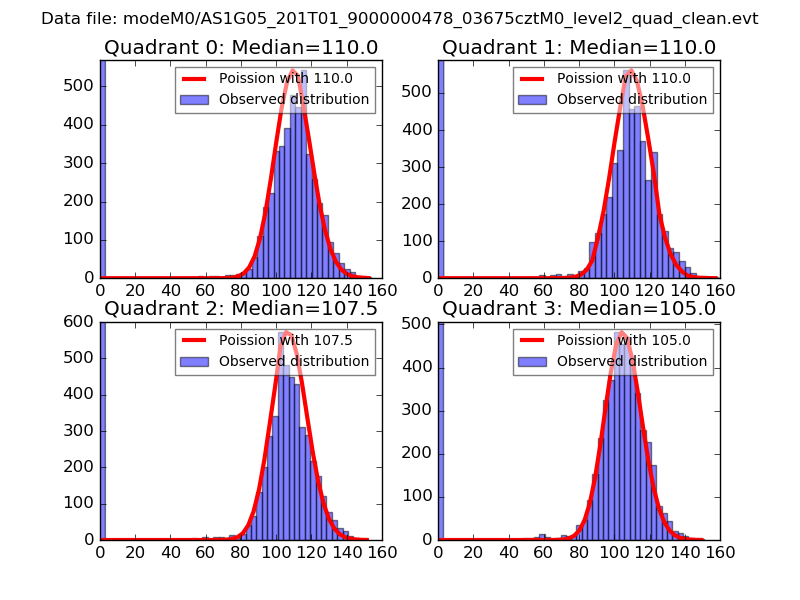 |
 |
| Quadrant-wise count rates Data is divided into 100 sec bins |
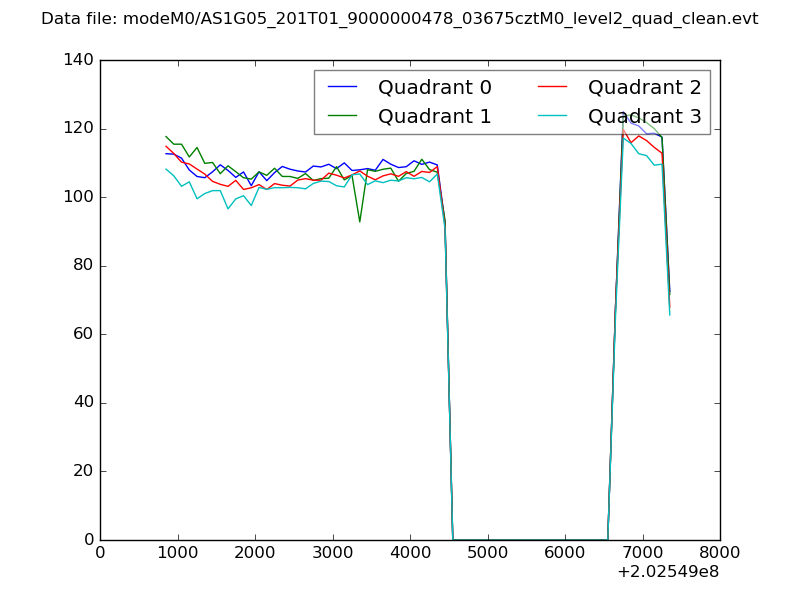 |
|
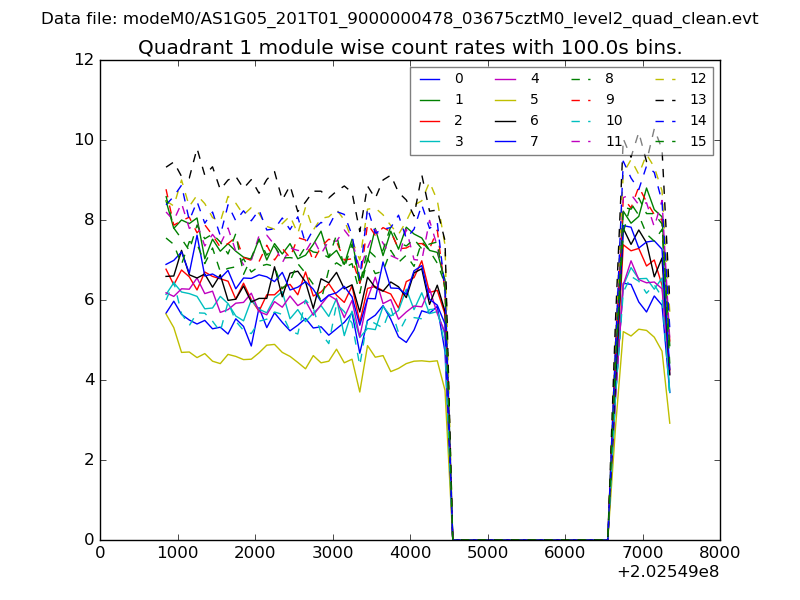
| Module-wise count rates for Quadrant A Data is divided into 100 sec bins |
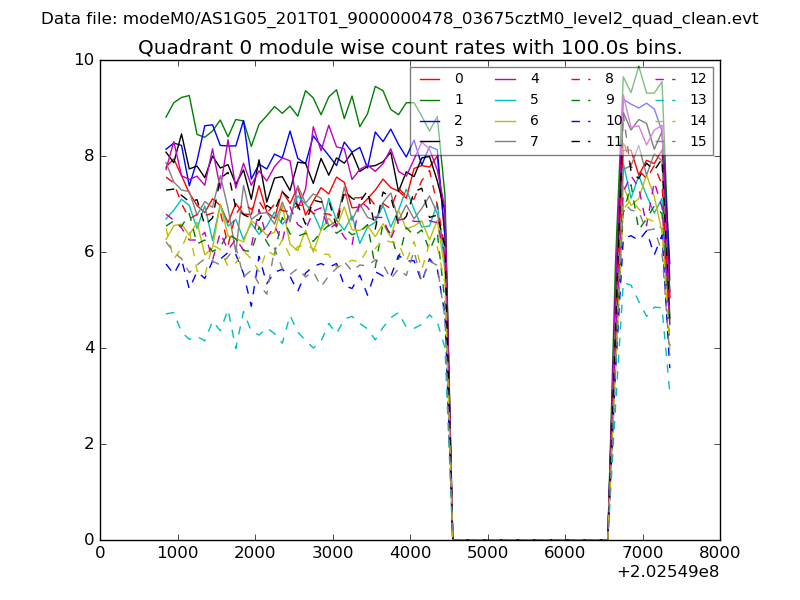 |
 |
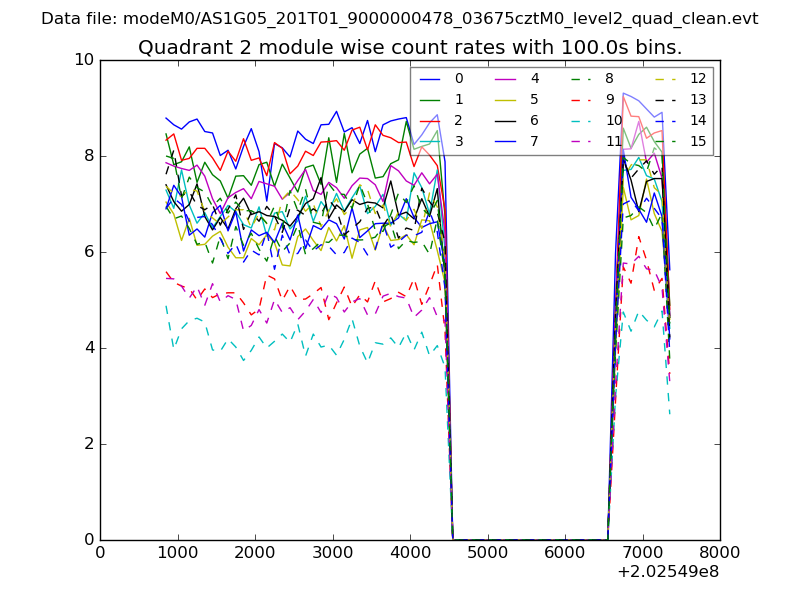
| Module-wise count rates for Quadrant B Data is divided into 100 sec bins |
 |
 |
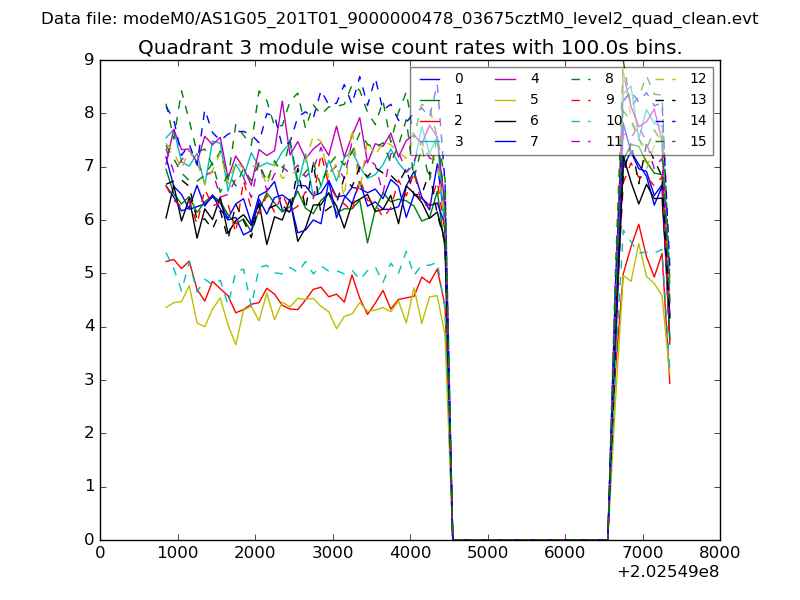
| Module-wise count rates for Quadrant C Data is divided into 100 sec bins |
 |
 |
| Module-wise count rates for Quadrant D Data is divided into 100 sec bins |
 |
 |
| Parameter | Plot |
|---|---|
| CZT HV Monitor | 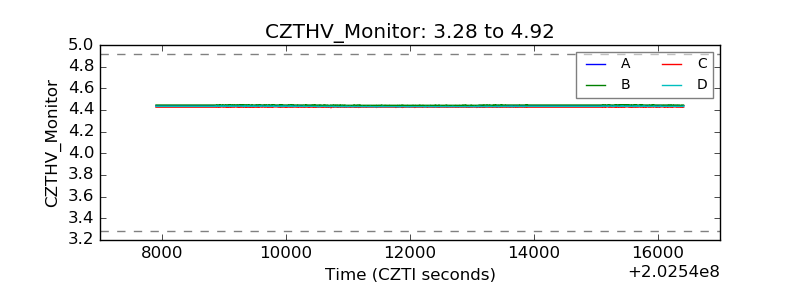 |
| D_VDD | 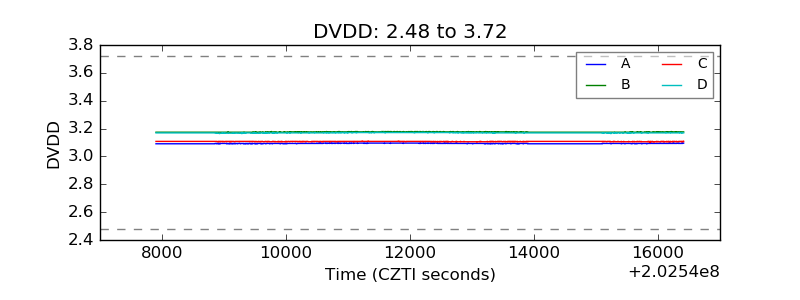 |
| Temperature 1 | 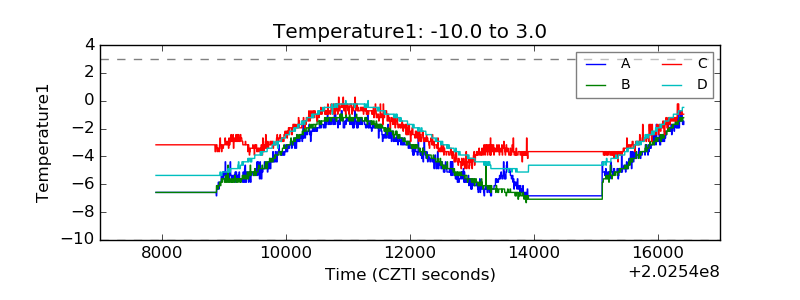 |
| Veto HV Monitor | 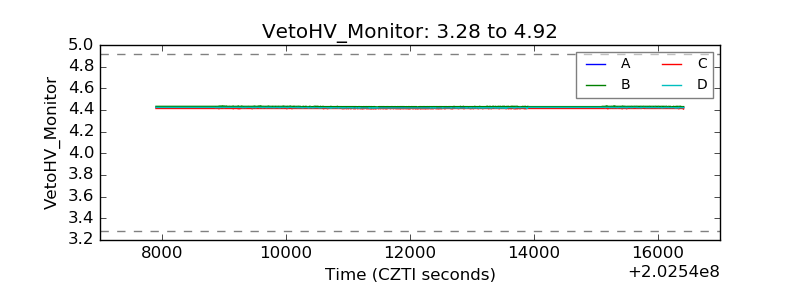 |
| Veto LLD | 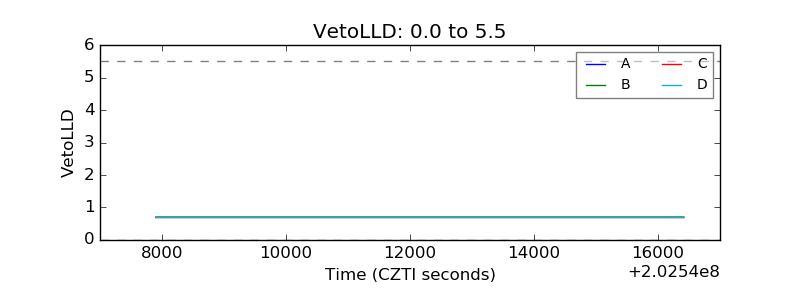 |
| Alpha Counter | 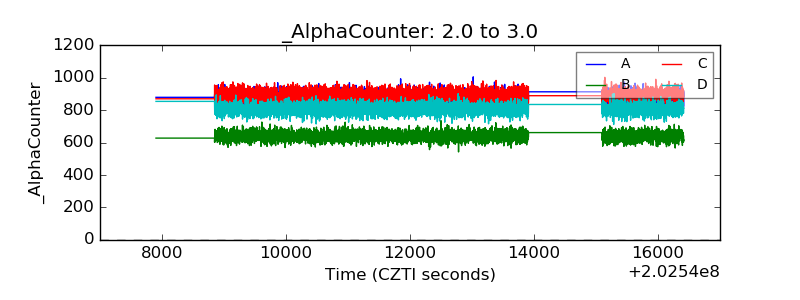 |
| _CPM_Rate | 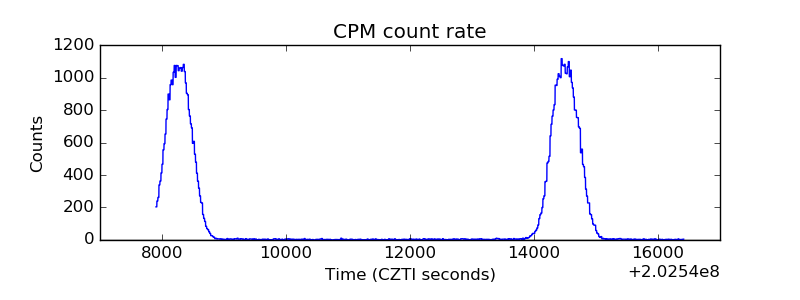 |
| CZT Counter | 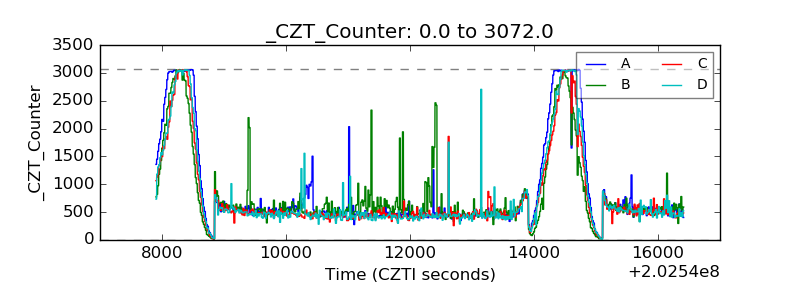 |
| +2.5 Volts monitor |  |
| +5 Volts monitor |  |
| Veto Counter | 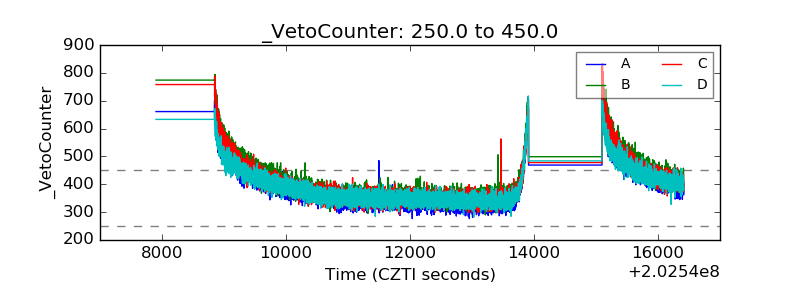 |