| Param | Original file | Final file |
|---|---|---|
| Filename | modeM0/AS1G05_201T01_9000000478_03677cztM0_level2.evt | modeM0/AS1G05_201T01_9000000478_03677cztM0_level2_quad_clean.evt |
| Size (bytes) | 438,684,480 | 82,388,160 |
| Size | 418.4 MB | 78.6 MB |
| Events in quadrant A | 3,620,976 | 522,054 |
| Events in quadrant B | 3,575,894 | 526,129 |
| Events in quadrant C | 2,788,365 | 520,807 |
| Events in quadrant D | 2,896,969 | 511,249 |
| Mode M9 | |||
|---|---|---|---|
| Quadrant | BADHDUFLAG | Total packets | Discarded packets |
| A | 0 | 12 | 0 |
| B | 0 | 12 | 0 |
| C | 0 | 12 | 0 |
| D | 0 | 12 | 0 |
| Mode M0 | |||
|---|---|---|---|
| Quadrant | BADHDUFLAG | Total packets | Discarded packets |
| A | 0 | 14699 | 2 |
| B | 0 | 14589 | 1 |
| C | 0 | 12327 | 1 |
| D | 0 | 12599 | 1 |
| Mode SS | |||
|---|---|---|---|
| Quadrant | BADHDUFLAG | Total packets | Discarded packets |
| A | 0 | 120 | 0 |
| B | 0 | 120 | 0 |
| C | 0 | 120 | 0 |
| D | 0 | 120 | 0 |
| Quadrant | Total seconds | Saturated seconds | Saturation percentage |
|---|---|---|---|
| A | 5936 | 264 | 4.447439% |
| B | 5936 | 134 | 2.257412% |
| C | 5936 | 82 | 1.381402% |
| D | 5936 | 97 | 1.634097% |
Noise dominated data is calculated using 1-second bins in cleaned event files. If a bin has >2000 counts, and if more than 50% of those come from <1% of pixels, then it is considered to be noise-dominated and hence unusable.
| Quadrant | # 1 sec bins | Bins with >0 counts | Bins with >2000 counts | High rate bins dominated by noise | Noise dominated (total time) | Noise dominated (detector-on time) | Marked lightcurve |
|---|---|---|---|---|---|---|---|
| A | 7121 | 5937 | 104 | 104 | 1.46% | 1.75% | 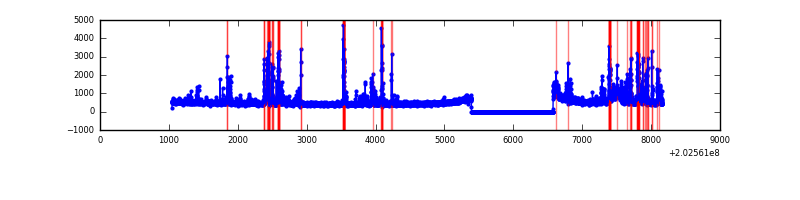 |
| B | 7121 | 5937 | 25 | 25 | 0.35% | 0.42% | 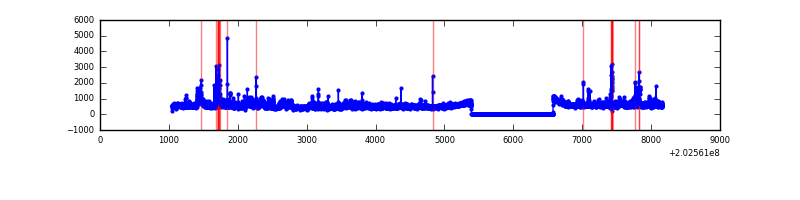 |
| C | 7121 | 5937 | 8 | 8 | 0.11% | 0.13% | 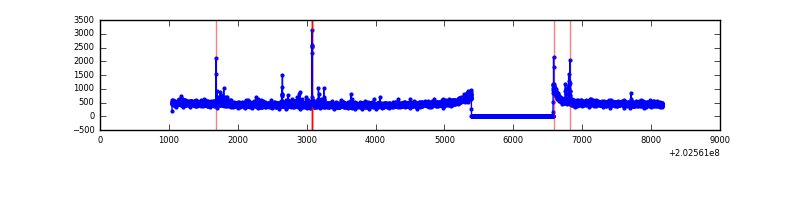 |
| D | 7121 | 5937 | 12 | 12 | 0.17% | 0.20% | 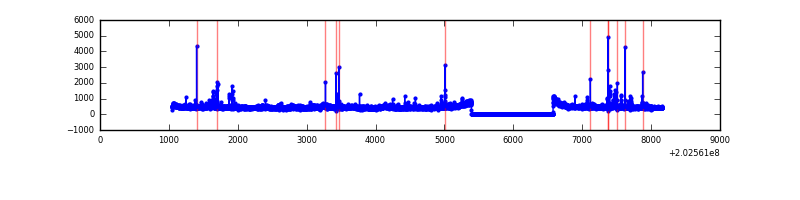 |
Top three noisy pixels from each quadrant. If the there are fewer than three noisy pixels in the level2.evt file, extra rows are filled as -1
| Pixel properties | Quadrant properties | ||||||
|---|---|---|---|---|---|---|---|
| Quadrant | DetID | PixID | Counts | Sigma | Mean | Median | Sigma |
| A | 0 | 118 | 465815 | 3196.92 | 711 | 695 | 145.5 |
| A | 13 | 251 | 207208 | 1419.43 | 711 | 695 | 145.5 |
| A | 13 | 164 | 94067 | 641.78 | 711 | 695 | 145.5 |
| B | 15 | 204 | 402645 | 2939.17 | 717 | 701 | 136.8 |
| B | 5 | 172 | 113956 | 828.16 | 717 | 701 | 136.8 |
| B | 3 | 0 | 83328 | 604.2 | 717 | 701 | 136.8 |
| C | 1 | 16 | 52443 | 321.0 | 692 | 697 | 161.2 |
| C | 9 | 247 | 16722 | 99.41 | 692 | 697 | 161.2 |
| C | 8 | 208 | 7212 | 40.41 | 692 | 697 | 161.2 |
| D | 8 | 195 | 79033 | 461.81 | 699 | 682 | 169.7 |
| D | 14 | 34 | 61852 | 360.54 | 699 | 682 | 169.7 |
| D | 2 | 37 | 50356 | 292.79 | 699 | 682 | 169.7 |
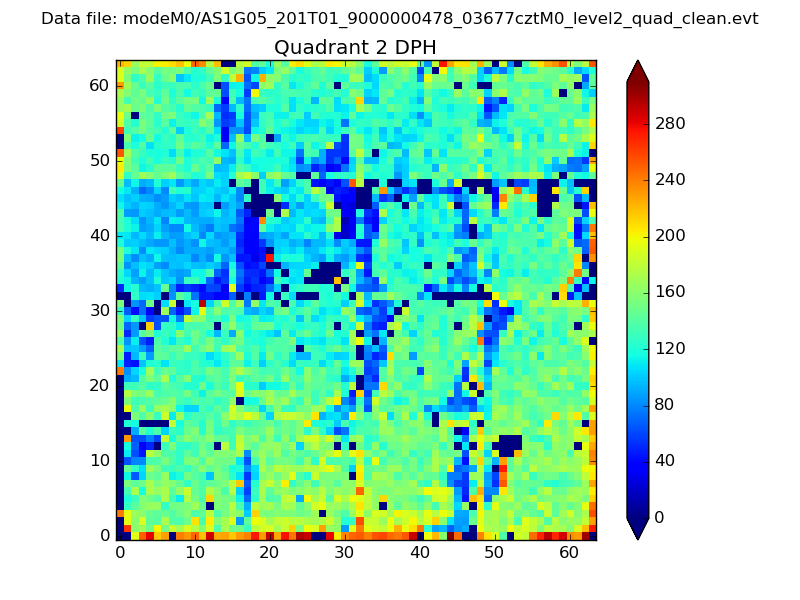
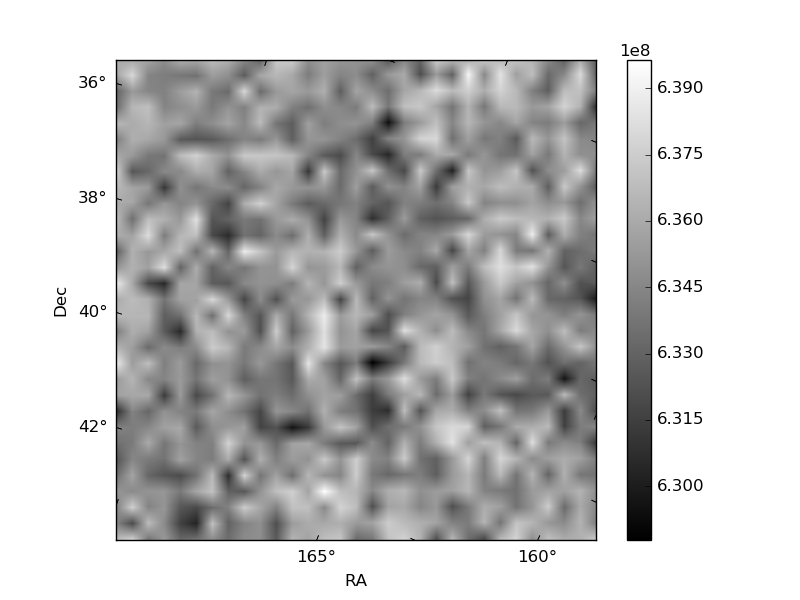
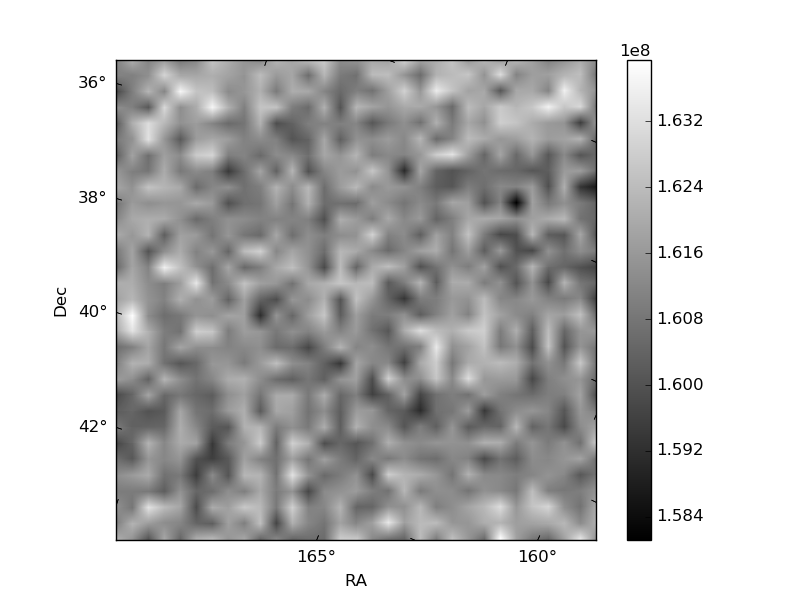
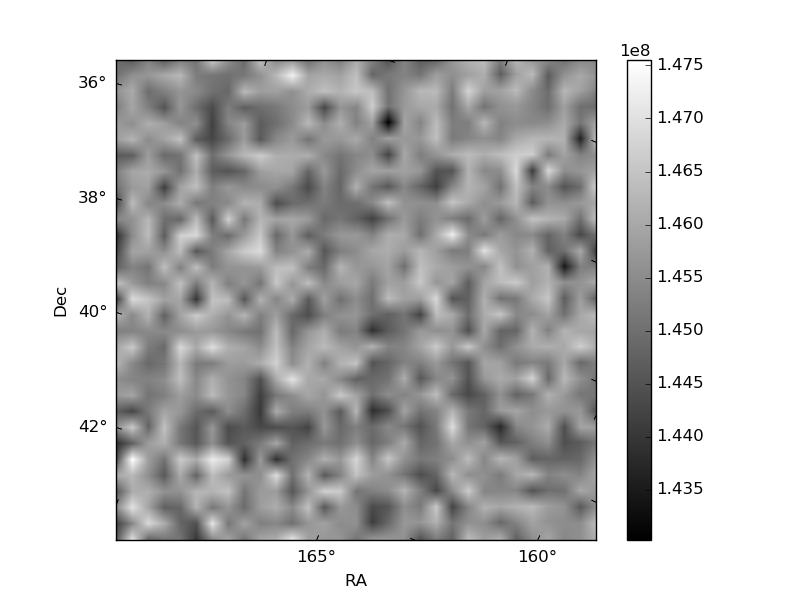
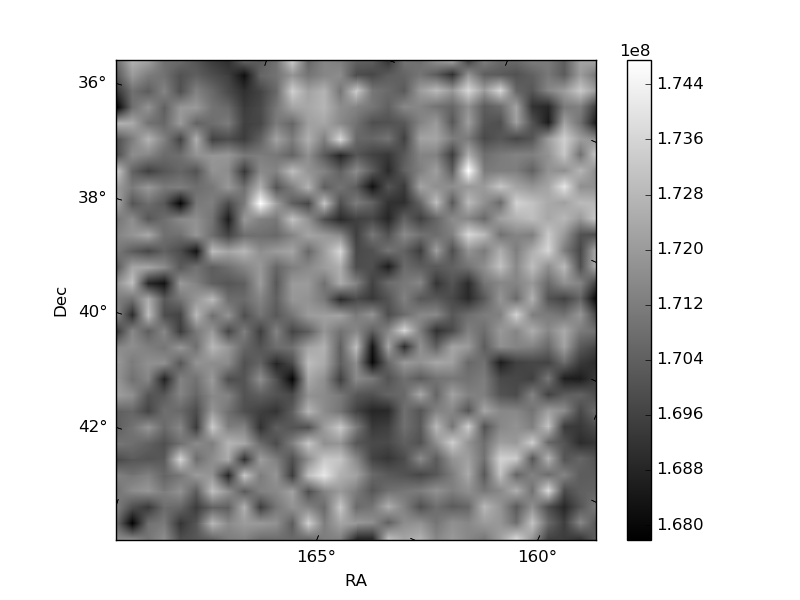
Histogram calculated using DETX and DETY for each event in the final _common_clean file
| Quadrant A | 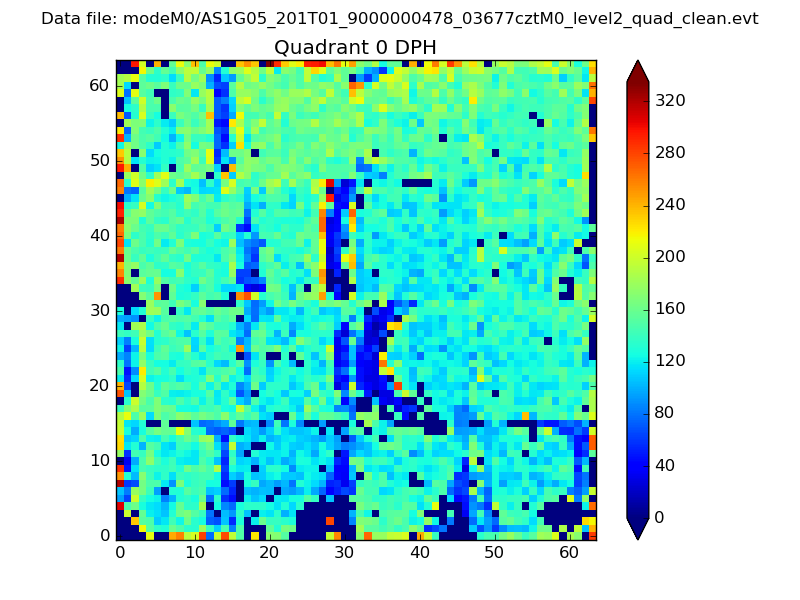 |
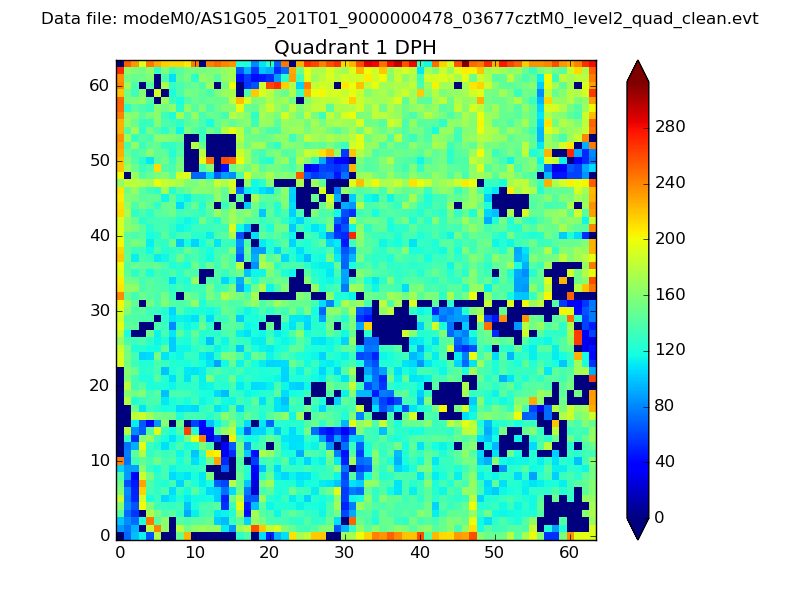 |
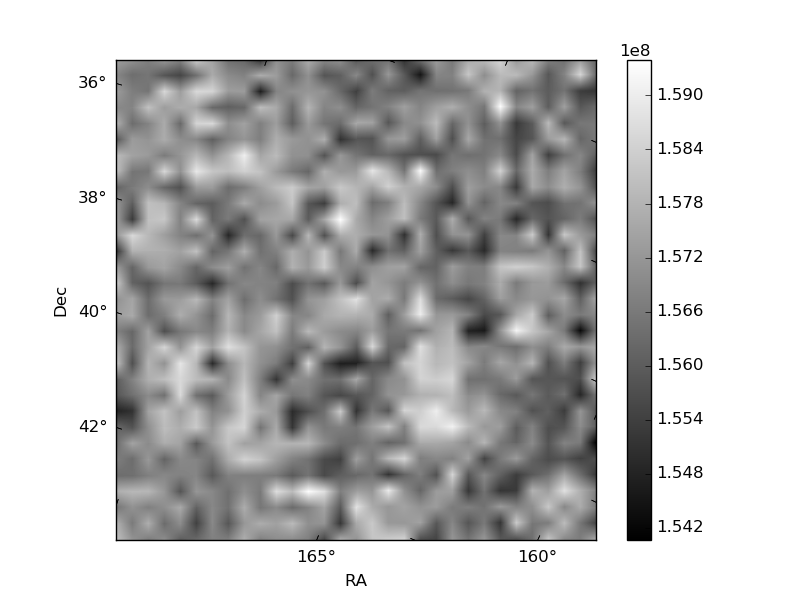
Quadrant B |
|---|---|---|---|
| Quadrant D | 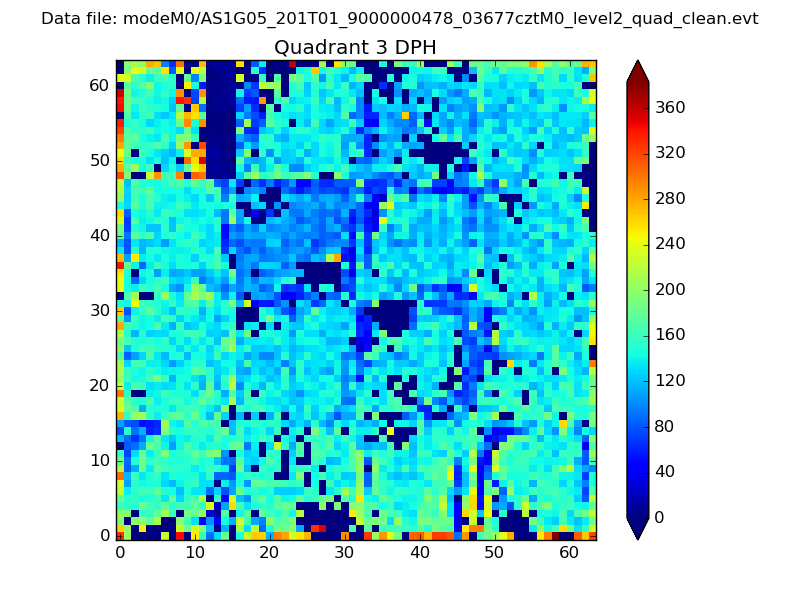 |
 |
Quadrant C |
| Plot type | Count rate plots | Images |
|---|---|---|
| Comparison with Poisson distribution Blue bars denote a histogram of data divided into 1 sec bins. Red curve is a Poisson curve with rate = median count rate of data. |
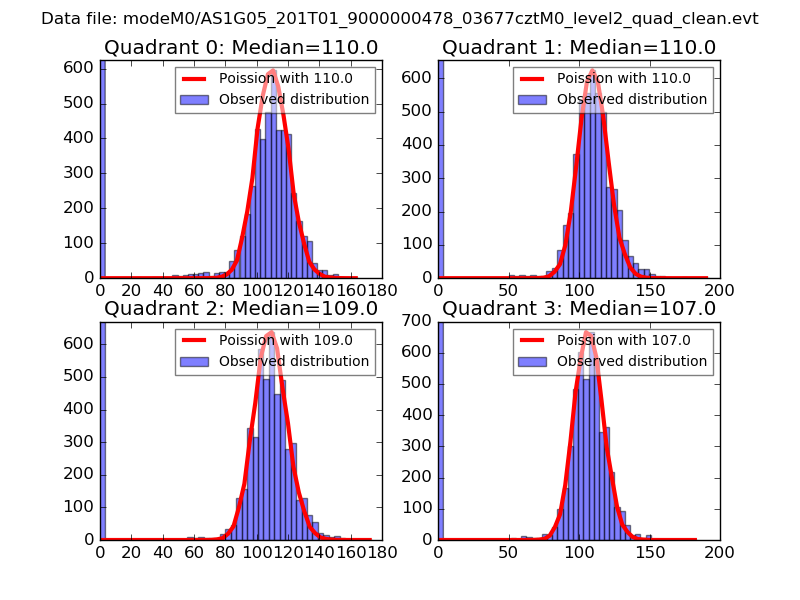 |
 |
| Quadrant-wise count rates Data is divided into 100 sec bins |
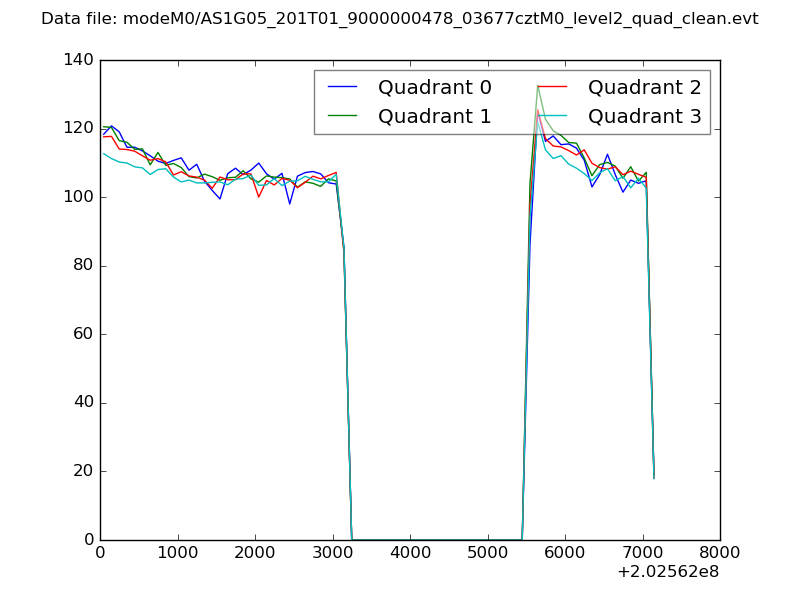 |
|
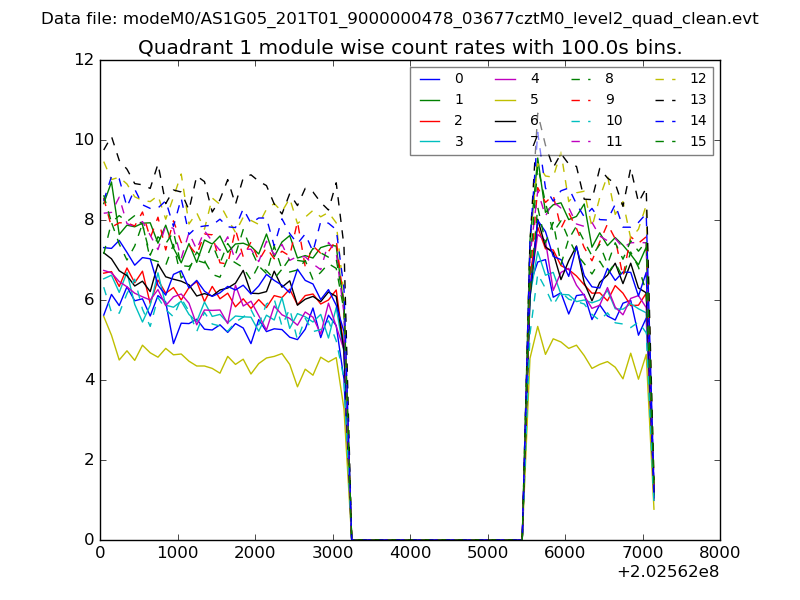
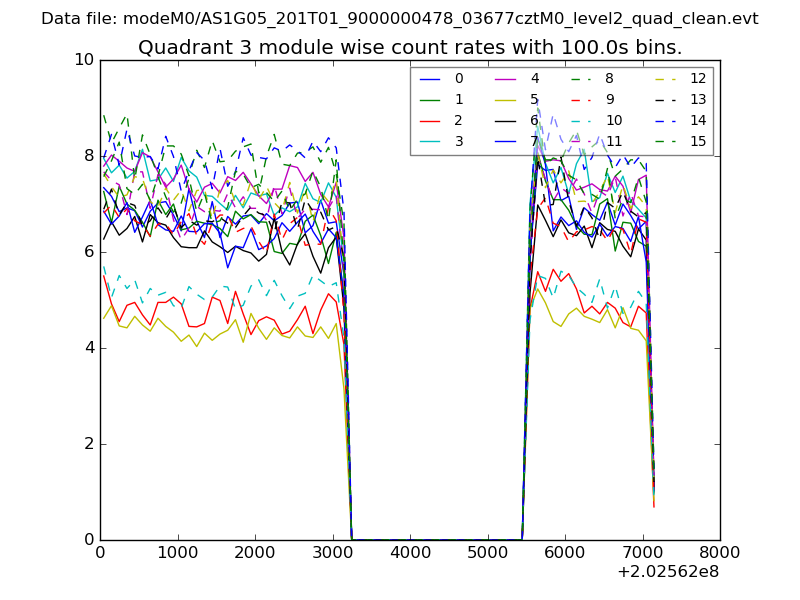
| Module-wise count rates for Quadrant A Data is divided into 100 sec bins |
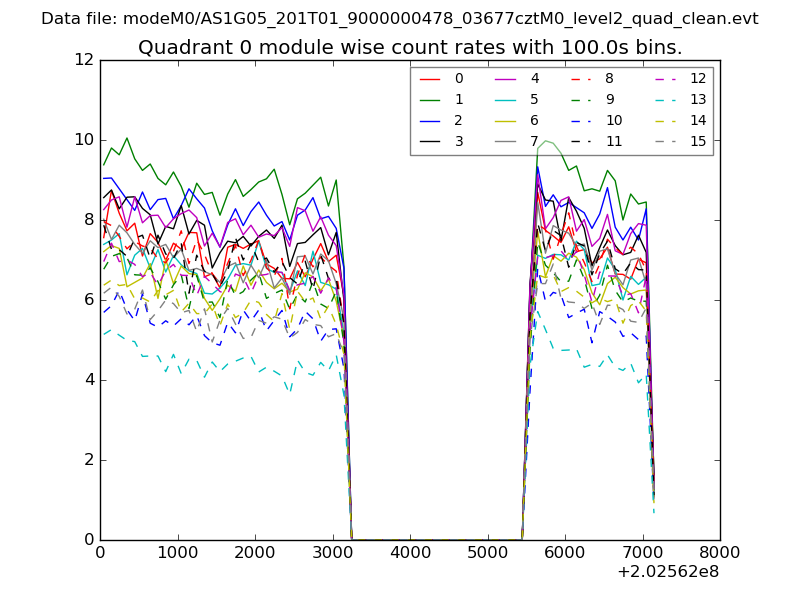 |
 |
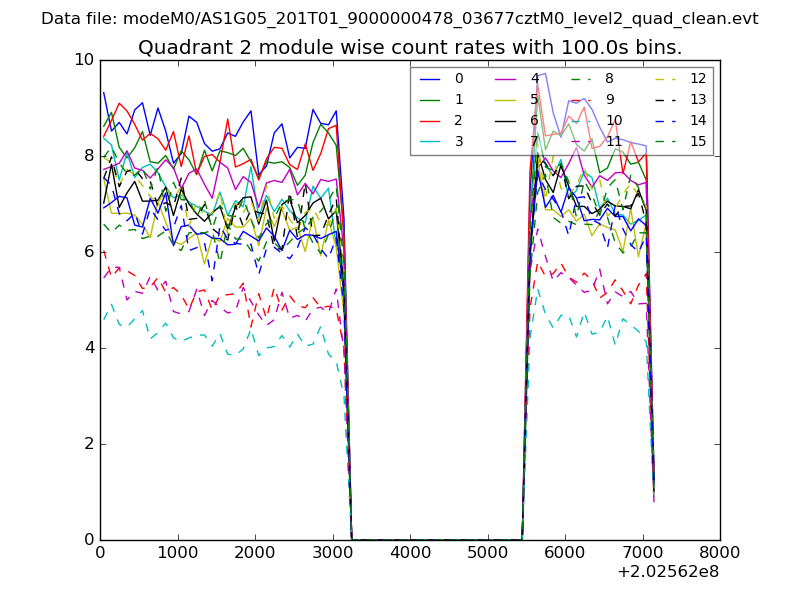
| Module-wise count rates for Quadrant B Data is divided into 100 sec bins |
 |
 |
| Module-wise count rates for Quadrant C Data is divided into 100 sec bins |
 |
 |
| Module-wise count rates for Quadrant D Data is divided into 100 sec bins |
 |
 |
| Parameter | Plot |
|---|---|
| CZT HV Monitor | 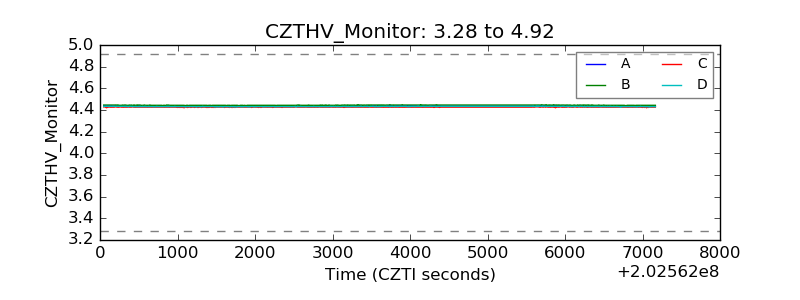 |
| D_VDD | 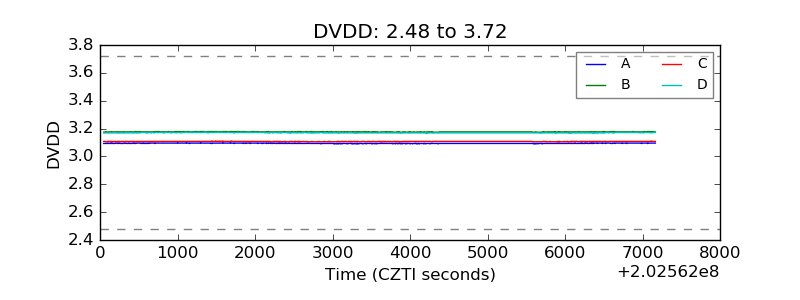 |
| Temperature 1 | 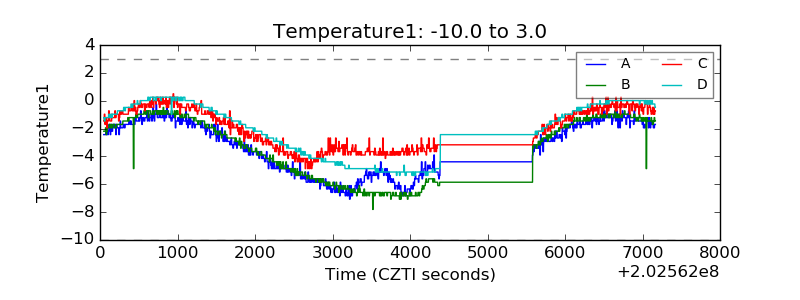 |
| Veto HV Monitor | 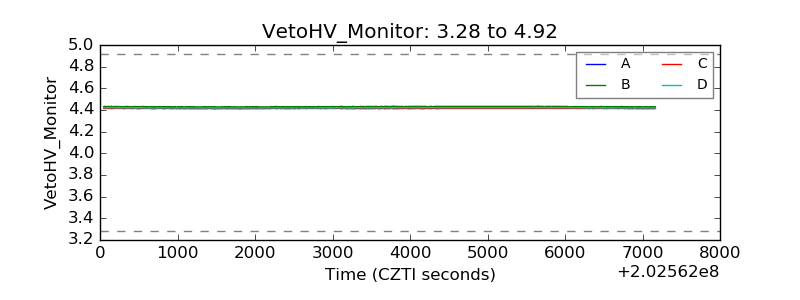 |
| Veto LLD | 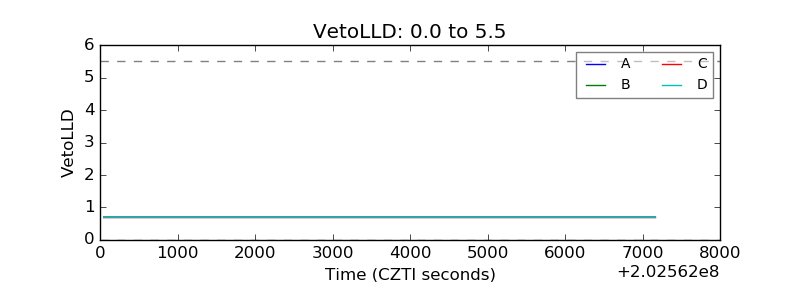 |
| Alpha Counter | 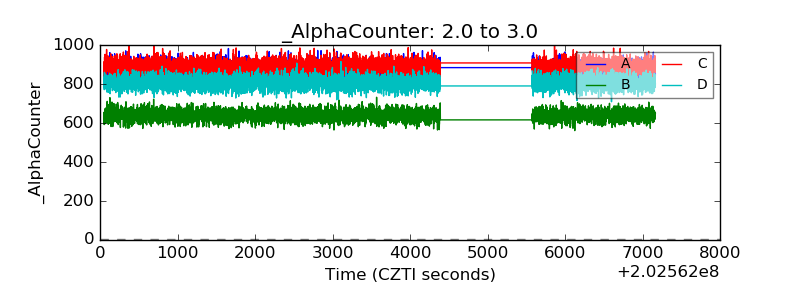 |
| _CPM_Rate | 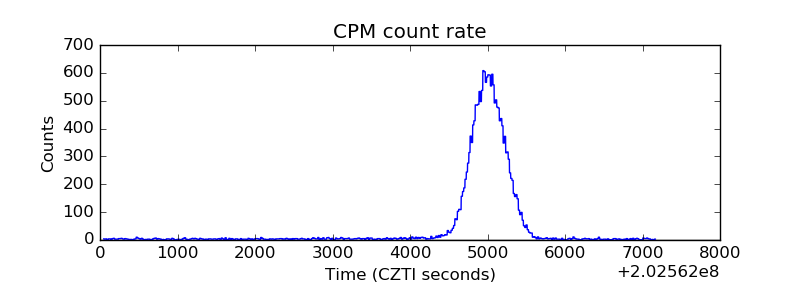 |
| CZT Counter | 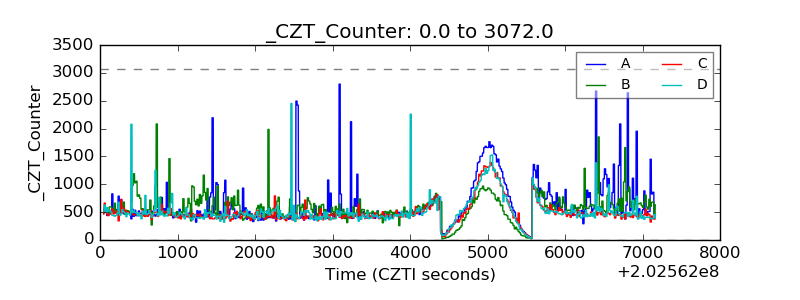 |
| +2.5 Volts monitor |  |
| +5 Volts monitor |  |
| Veto Counter | 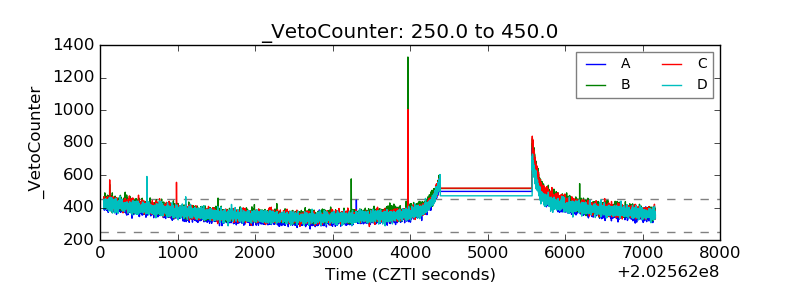 |