| Param | Original file | Final file |
|---|---|---|
| Filename | modeM0/AS1G05_201T01_9000000478_03678cztM0_level2.evt | modeM0/AS1G05_201T01_9000000478_03678cztM0_level2_quad_clean.evt |
| Size (bytes) | 456,995,520 | 77,201,280 |
| Size | 435.8 MB | 73.6 MB |
| Events in quadrant A | 3,581,372 | 478,468 |
| Events in quadrant B | 4,048,171 | 476,439 |
| Events in quadrant C | 2,837,827 | 476,264 |
| Events in quadrant D | 2,943,996 | 466,148 |
| Mode M9 | |||
|---|---|---|---|
| Quadrant | BADHDUFLAG | Total packets | Discarded packets |
| A | 0 | 10 | 0 |
| B | 0 | 10 | 0 |
| C | 0 | 10 | 0 |
| D | 0 | 10 | 0 |
| Mode M0 | |||
|---|---|---|---|
| Quadrant | BADHDUFLAG | Total packets | Discarded packets |
| A | 0 | 14894 | 2 |
| B | 0 | 16284 | 1 |
| C | 0 | 12902 | 1 |
| D | 0 | 13377 | 1 |
| Mode SS | |||
|---|---|---|---|
| Quadrant | BADHDUFLAG | Total packets | Discarded packets |
| A | 0 | 130 | 0 |
| B | 0 | 130 | 0 |
| C | 0 | 130 | 0 |
| D | 0 | 130 | 0 |
| Quadrant | Total seconds | Saturated seconds | Saturation percentage |
|---|---|---|---|
| A | 6302 | 197 | 3.125992% |
| B | 6302 | 138 | 2.189781% |
| C | 6302 | 81 | 1.285306% |
| D | 6302 | 119 | 1.888289% |
Noise dominated data is calculated using 1-second bins in cleaned event files. If a bin has >2000 counts, and if more than 50% of those come from <1% of pixels, then it is considered to be noise-dominated and hence unusable.
| Quadrant | # 1 sec bins | Bins with >0 counts | Bins with >2000 counts | High rate bins dominated by noise | Noise dominated (total time) | Noise dominated (detector-on time) | Marked lightcurve |
|---|---|---|---|---|---|---|---|
| A | 7357 | 6303 | 72 | 72 | 0.98% | 1.14% | 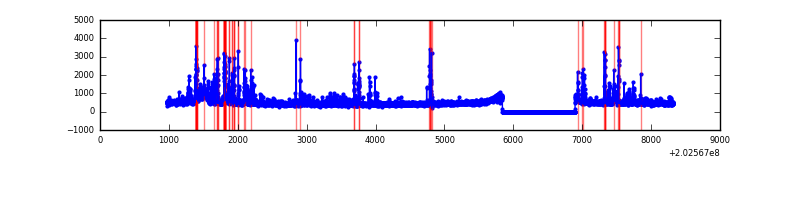 |
| B | 7357 | 6303 | 28 | 28 | 0.38% | 0.44% | 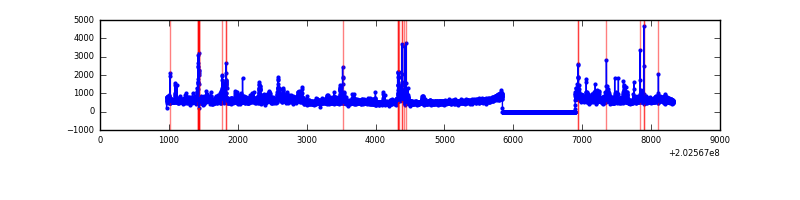 |
| C | 7357 | 6303 | 0 | 0 | 0.00% | 0.00% | 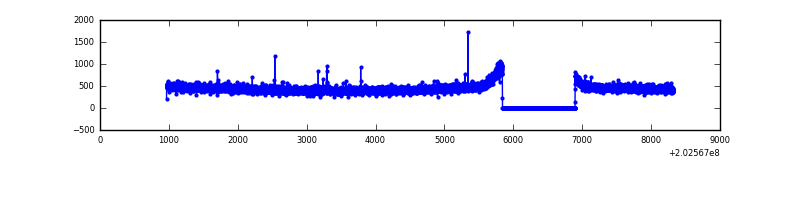 |
| D | 7357 | 6302 | 22 | 22 | 0.30% | 0.35% | 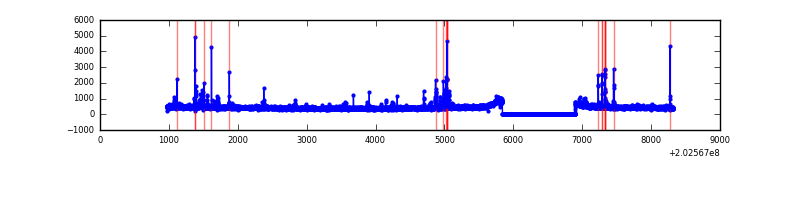 |
Top three noisy pixels from each quadrant. If the there are fewer than three noisy pixels in the level2.evt file, extra rows are filled as -1
| Pixel properties | Quadrant properties | ||||||
|---|---|---|---|---|---|---|---|
| Quadrant | DetID | PixID | Counts | Sigma | Mean | Median | Sigma |
| A | 0 | 118 | 425850 | 2801.2 | 736 | 721 | 151.8 |
| A | 13 | 251 | 165306 | 1084.46 | 736 | 721 | 151.8 |
| A | 0 | 226 | 49320 | 320.22 | 736 | 721 | 151.8 |
| B | 15 | 204 | 398558 | 2800.27 | 741 | 721 | 142.1 |
| B | 3 | 0 | 364415 | 2559.95 | 741 | 721 | 142.1 |
| B | 5 | 172 | 185474 | 1300.43 | 741 | 721 | 142.1 |
| C | 1 | 16 | 9456 | 51.51 | 720 | 723 | 169.5 |
| C | 13 | 61 | 6015 | 31.21 | 720 | 723 | 169.5 |
| C | 12 | 4 | 5281 | 26.88 | 720 | 723 | 169.5 |
| D | 13 | 223 | 89788 | 512.71 | 722 | 699 | 173.8 |
| D | 14 | 34 | 50652 | 287.48 | 722 | 699 | 173.8 |
| D | 8 | 195 | 29860 | 167.82 | 722 | 699 | 173.8 |
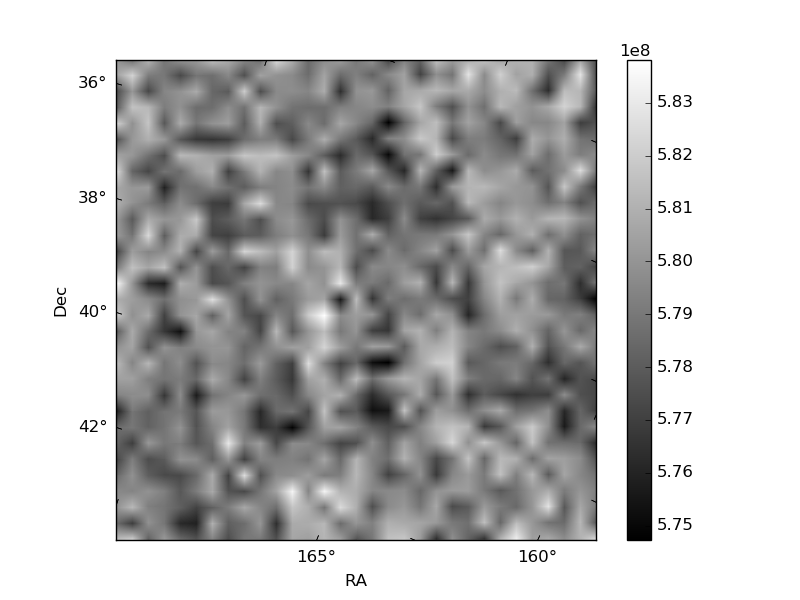
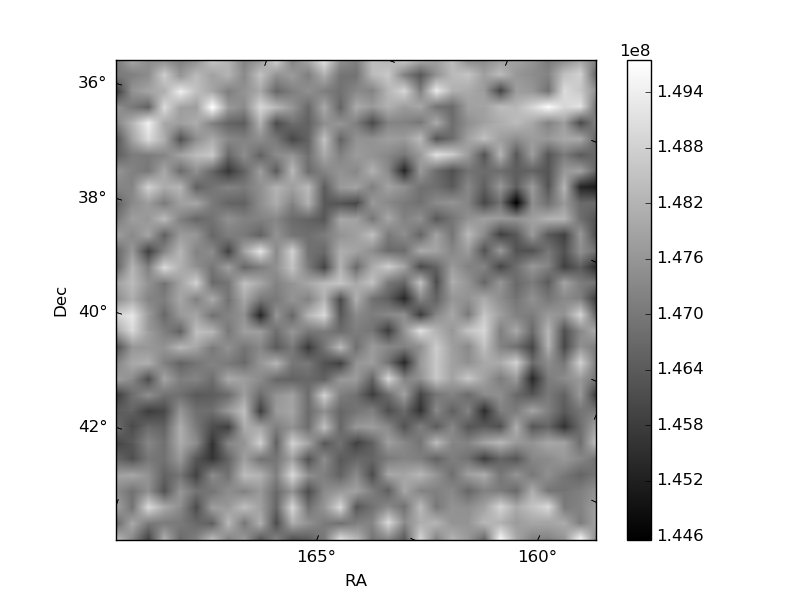
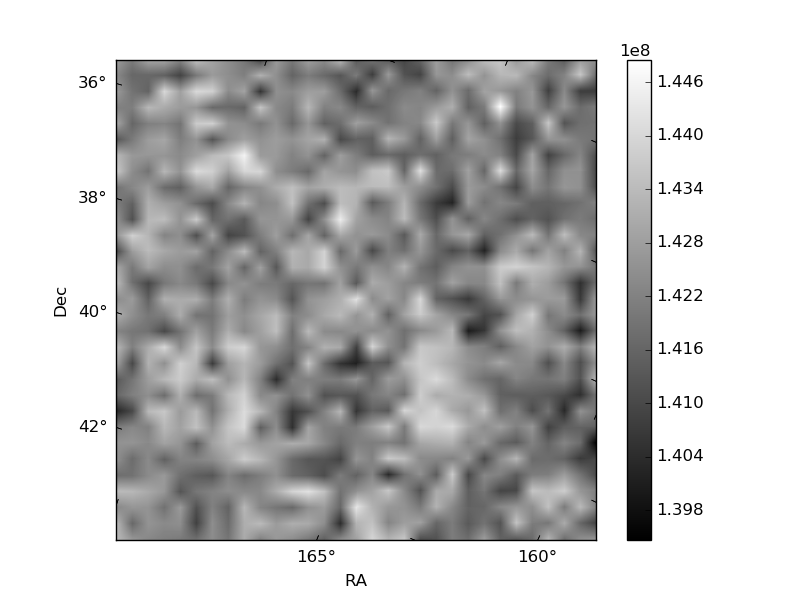
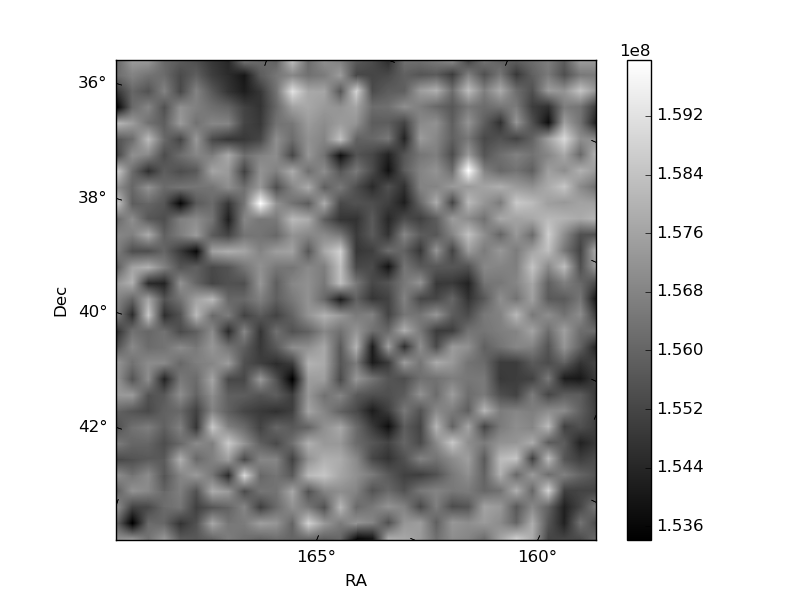
Histogram calculated using DETX and DETY for each event in the final _common_clean file
| Quadrant A | 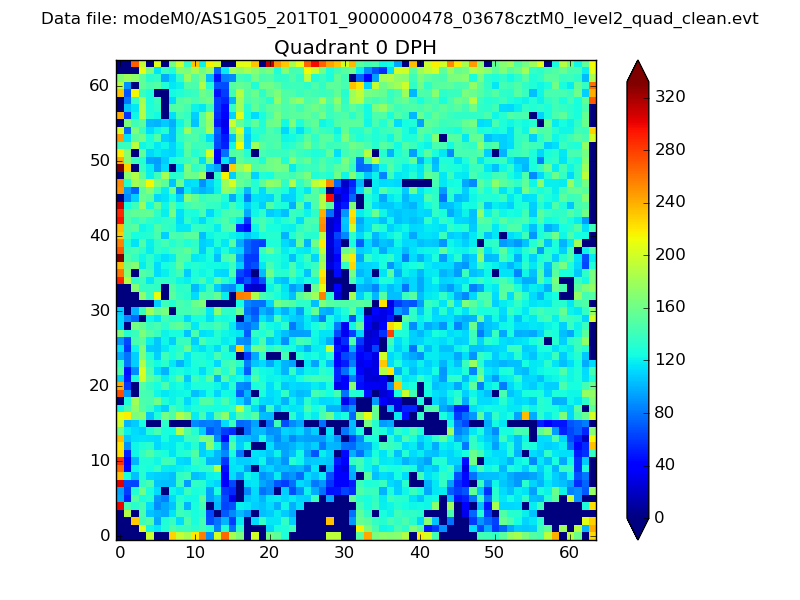 |
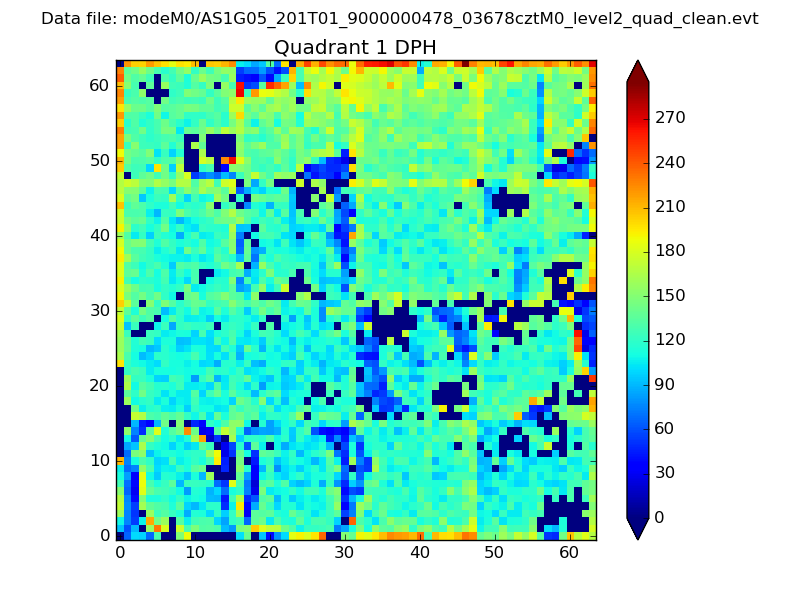 |
Quadrant B |
|---|---|---|---|
| Quadrant D | 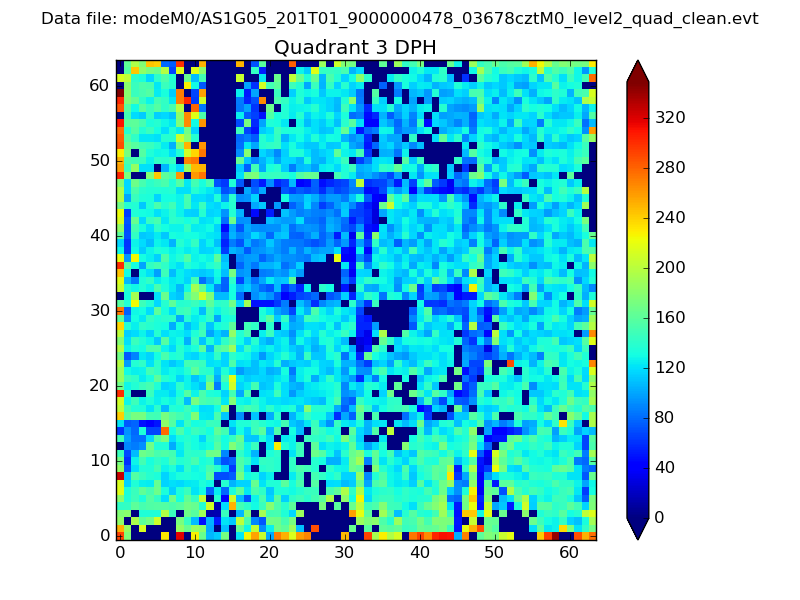 |
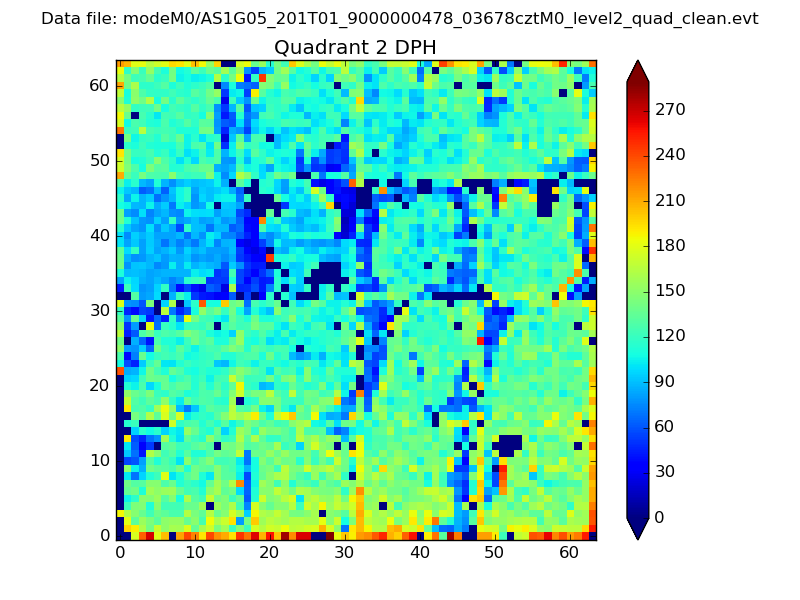 |
Quadrant C |
| Plot type | Count rate plots | Images |
|---|---|---|
| Comparison with Poisson distribution Blue bars denote a histogram of data divided into 1 sec bins. Red curve is a Poisson curve with rate = median count rate of data. |
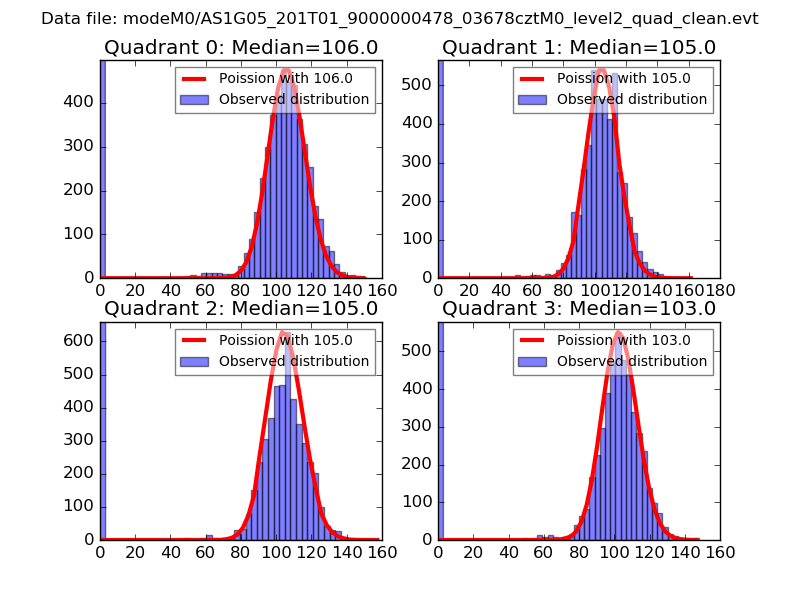 |
 |
| Quadrant-wise count rates Data is divided into 100 sec bins |
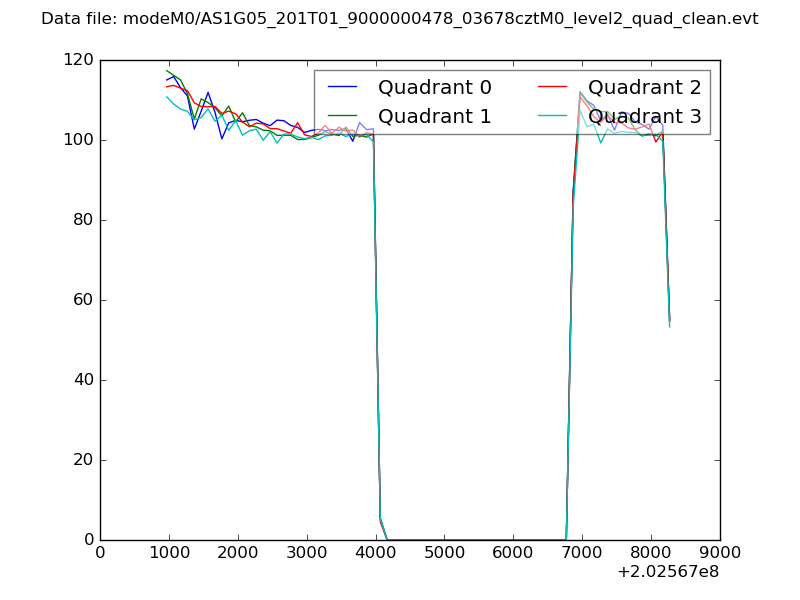 |
|
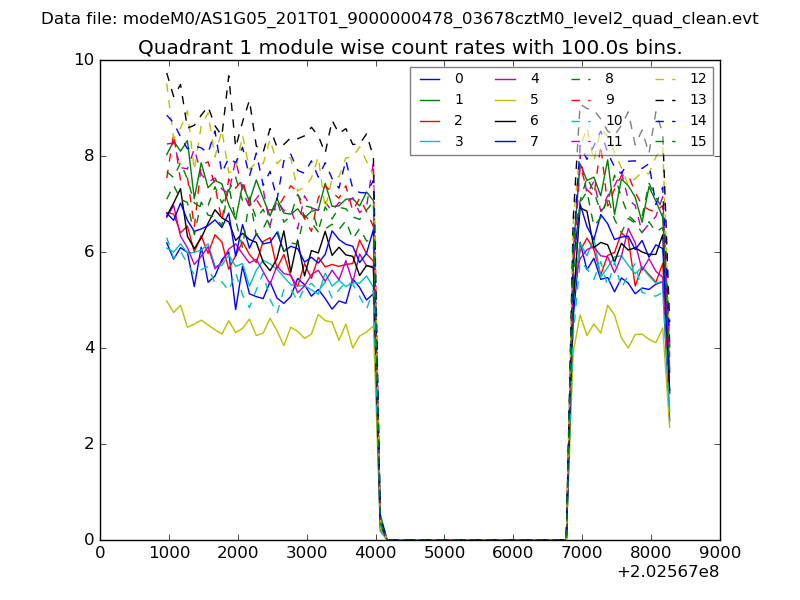
| Module-wise count rates for Quadrant A Data is divided into 100 sec bins |
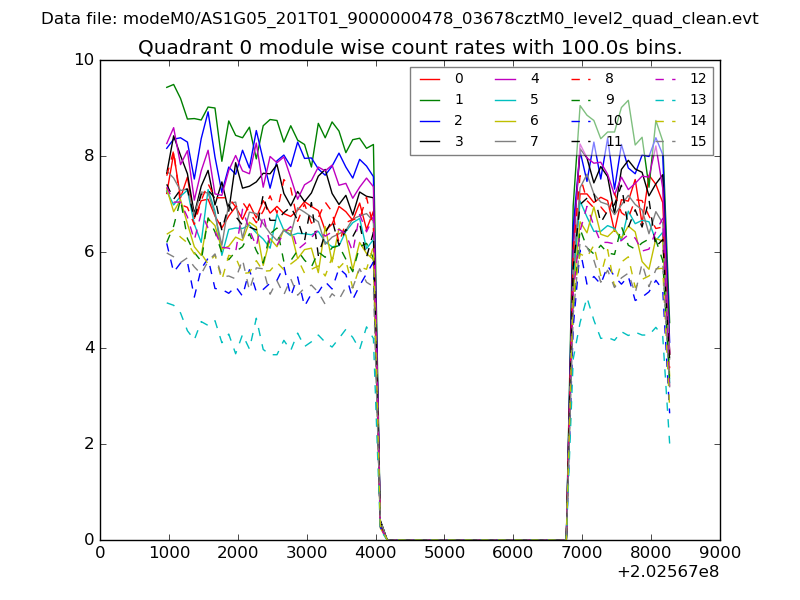 |
 |
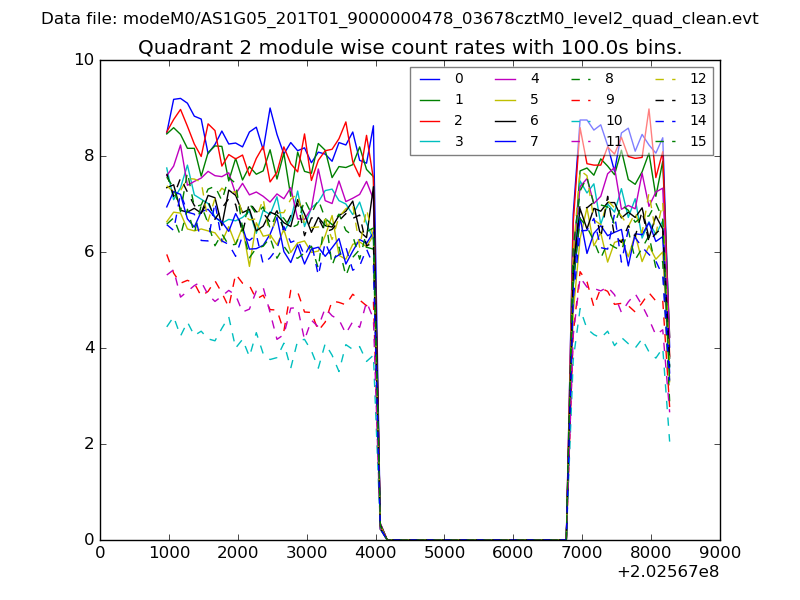
| Module-wise count rates for Quadrant B Data is divided into 100 sec bins |
 |
 |
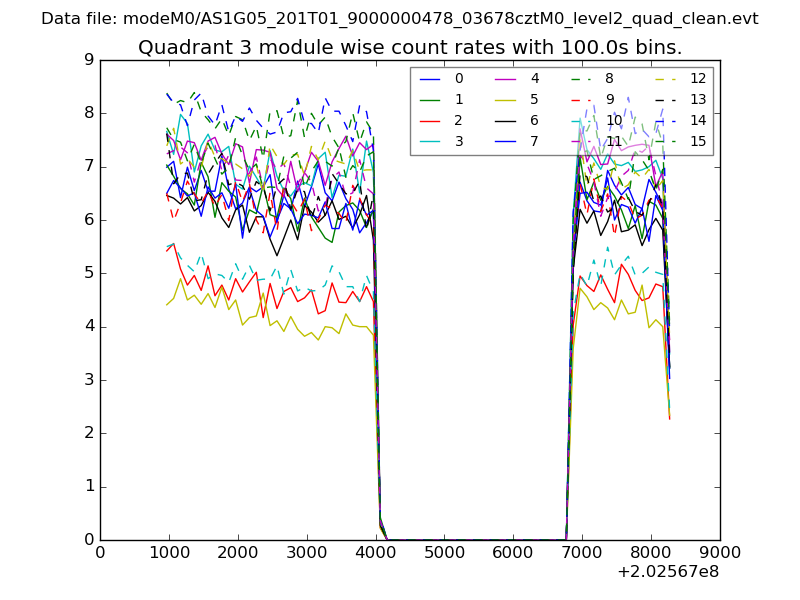
| Module-wise count rates for Quadrant C Data is divided into 100 sec bins |
 |
 |
| Module-wise count rates for Quadrant D Data is divided into 100 sec bins |
 |
 |
| Parameter | Plot |
|---|---|
| CZT HV Monitor | 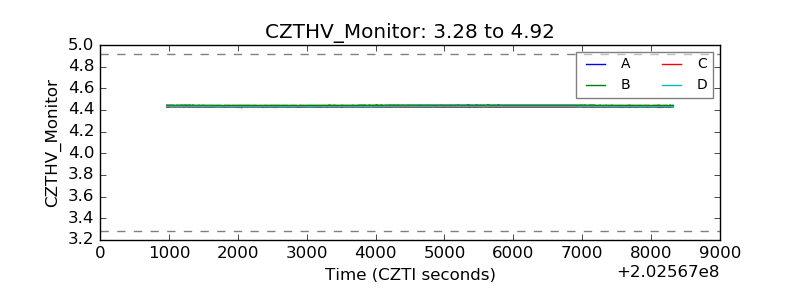 |
| D_VDD | 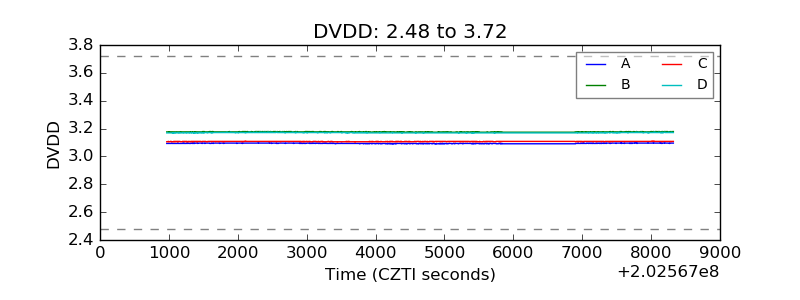 |
| Temperature 1 | 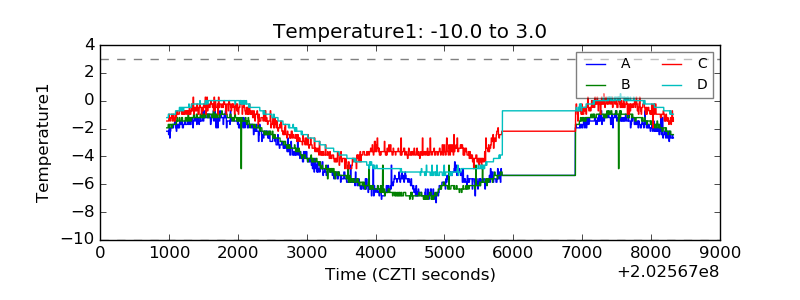 |
| Veto HV Monitor | 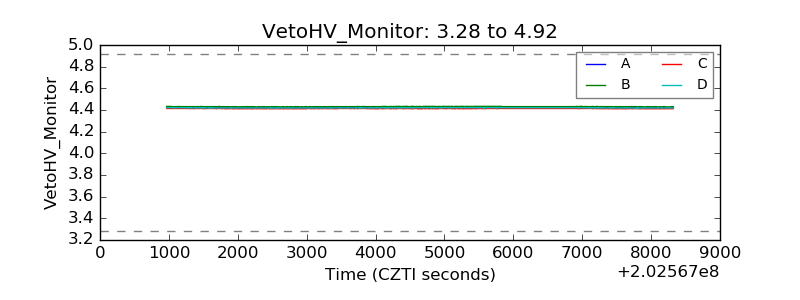 |
| Veto LLD | 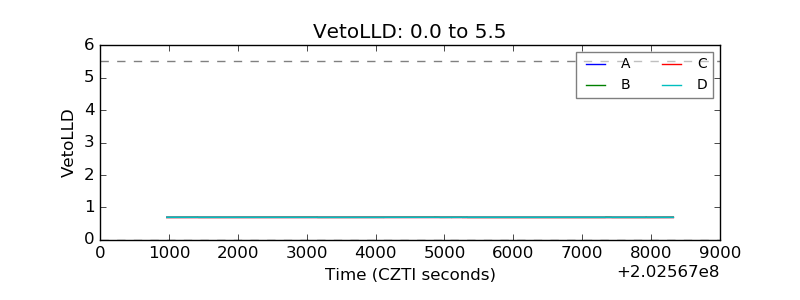 |
| Alpha Counter | 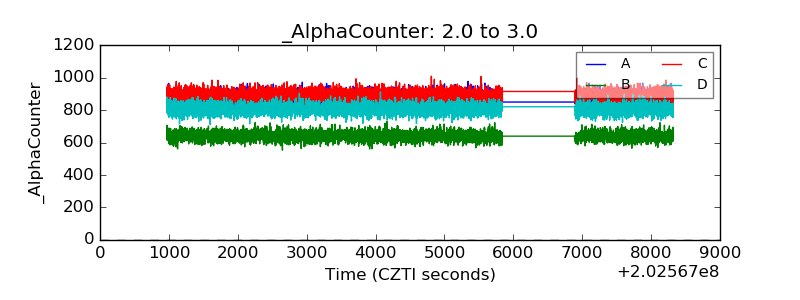 |
| _CPM_Rate | 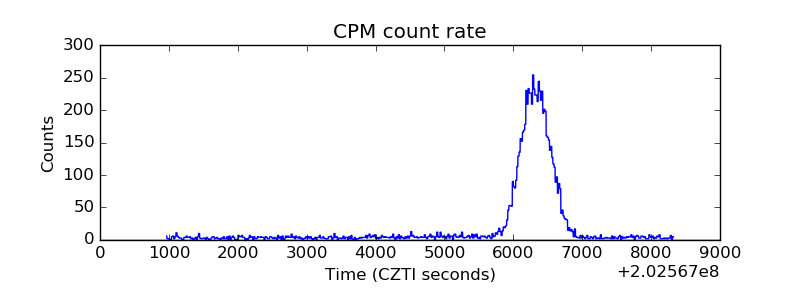 |
| CZT Counter | 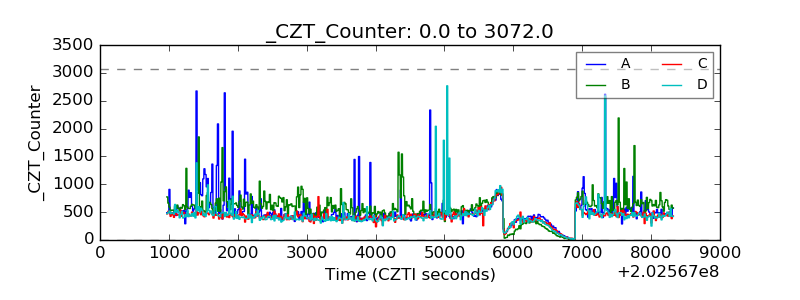 |
| +2.5 Volts monitor |  |
| +5 Volts monitor |  |
| Veto Counter | 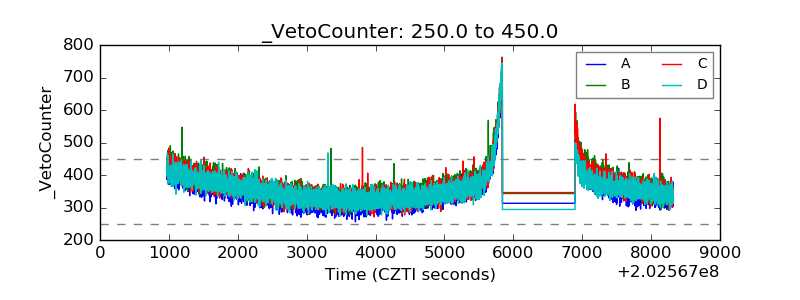 |