| Param | Original file | Final file |
|---|---|---|
| Filename | modeM0/AS1G05_201T01_9000000478_03679cztM0_level2.evt | modeM0/AS1G05_201T01_9000000478_03679cztM0_level2_quad_clean.evt |
| Size (bytes) | 434,511,360 | 67,608,000 |
| Size | 414.4 MB | 64.5 MB |
| Events in quadrant A | 3,015,603 | 411,729 |
| Events in quadrant B | 4,173,428 | 403,235 |
| Events in quadrant C | 2,720,865 | 405,974 |
| Events in quadrant D | 2,832,697 | 398,028 |
| Mode M9 | |||
|---|---|---|---|
| Quadrant | BADHDUFLAG | Total packets | Discarded packets |
| A | 0 | 7 | 0 |
| B | 0 | 7 | 0 |
| C | 0 | 7 | 0 |
| D | 0 | 7 | 0 |
| Mode M0 | |||
|---|---|---|---|
| Quadrant | BADHDUFLAG | Total packets | Discarded packets |
| A | 0 | 13228 | 2 |
| B | 0 | 16396 | 1 |
| C | 0 | 12618 | 1 |
| D | 0 | 13089 | 1 |
| Mode SS | |||
|---|---|---|---|
| Quadrant | BADHDUFLAG | Total packets | Discarded packets |
| A | 0 | 126 | 0 |
| B | 0 | 126 | 0 |
| C | 0 | 126 | 0 |
| D | 0 | 126 | 0 |
| Quadrant | Total seconds | Saturated seconds | Saturation percentage |
|---|---|---|---|
| A | 6125 | 83 | 1.355102% |
| B | 6125 | 162 | 2.644898% |
| C | 6125 | 39 | 0.636735% |
| D | 6125 | 52 | 0.848980% |
Noise dominated data is calculated using 1-second bins in cleaned event files. If a bin has >2000 counts, and if more than 50% of those come from <1% of pixels, then it is considered to be noise-dominated and hence unusable.
| Quadrant | # 1 sec bins | Bins with >0 counts | Bins with >2000 counts | High rate bins dominated by noise | Noise dominated (total time) | Noise dominated (detector-on time) | Marked lightcurve |
|---|---|---|---|---|---|---|---|
| A | 6880 | 6126 | 14 | 14 | 0.20% | 0.23% | 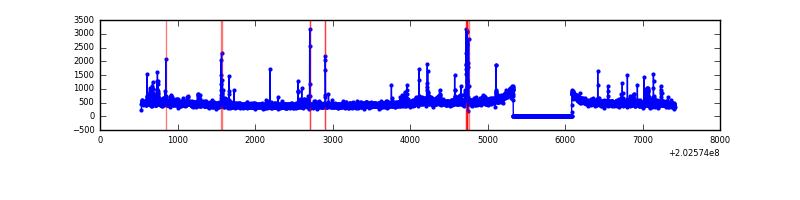 |
| B | 6880 | 6126 | 82 | 82 | 1.19% | 1.34% | 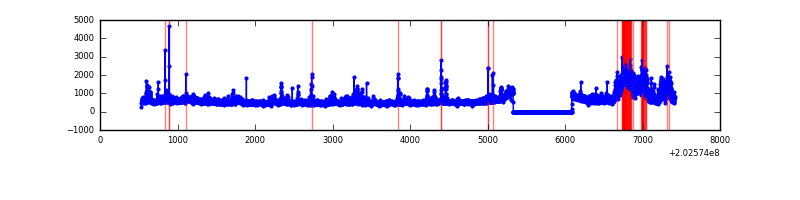 |
| C | 6880 | 6126 | 0 | 0 | 0.00% | 0.00% | 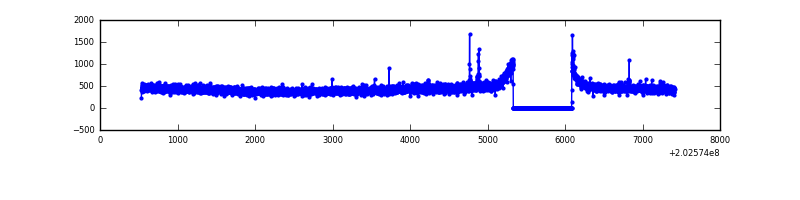 |
| D | 6880 | 6126 | 13 | 13 | 0.19% | 0.21% | 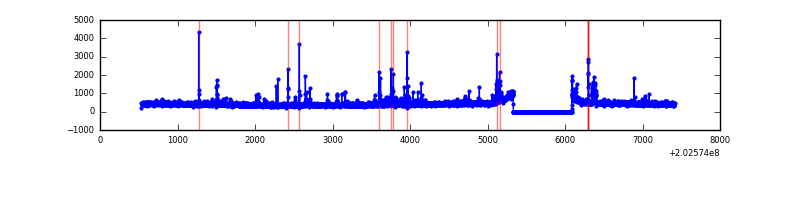 |
Top three noisy pixels from each quadrant. If the there are fewer than three noisy pixels in the level2.evt file, extra rows are filled as -1
| Pixel properties | Quadrant properties | ||||||
|---|---|---|---|---|---|---|---|
| Quadrant | DetID | PixID | Counts | Sigma | Mean | Median | Sigma |
| A | 0 | 118 | 135430 | 916.89 | 703 | 686 | 147.0 |
| A | 8 | 15 | 50527 | 339.15 | 703 | 686 | 147.0 |
| A | 13 | 164 | 40536 | 271.17 | 703 | 686 | 147.0 |
| B | 15 | 204 | 735637 | 5306.84 | 709 | 691 | 138.5 |
| B | 3 | 0 | 298176 | 2148.06 | 709 | 691 | 138.5 |
| B | 14 | 167 | 120533 | 865.35 | 709 | 691 | 138.5 |
| C | 9 | 247 | 20775 | 124.01 | 688 | 692 | 161.9 |
| C | 9 | 144 | 6179 | 33.88 | 688 | 692 | 161.9 |
| C | 13 | 61 | 5813 | 31.62 | 688 | 692 | 161.9 |
| D | 13 | 223 | 61040 | 361.38 | 688 | 667 | 167.1 |
| D | 12 | 221 | 46429 | 273.92 | 688 | 667 | 167.1 |
| D | 13 | 239 | 32022 | 187.68 | 688 | 667 | 167.1 |
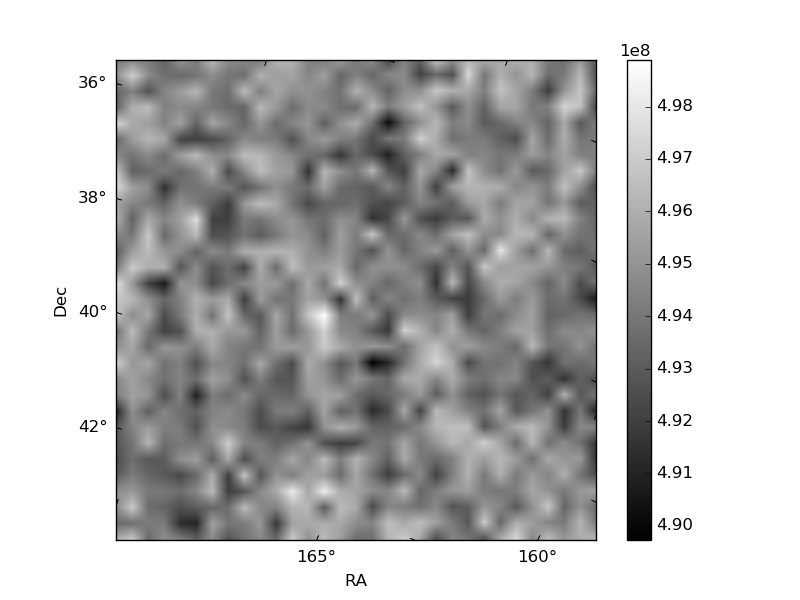
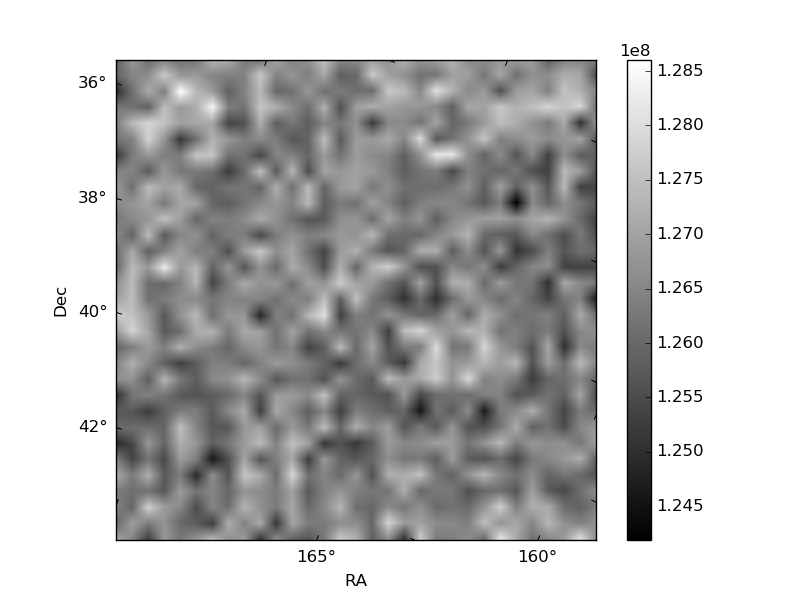
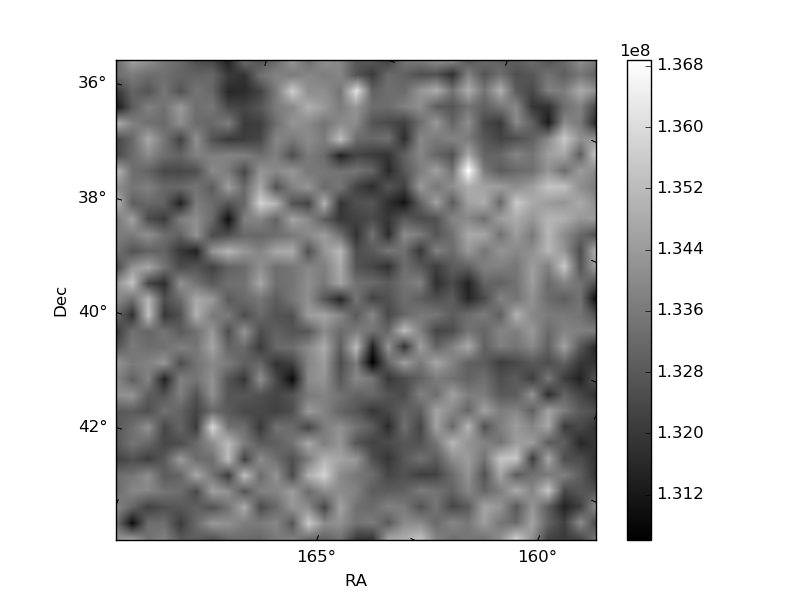
Histogram calculated using DETX and DETY for each event in the final _common_clean file
| Quadrant A | 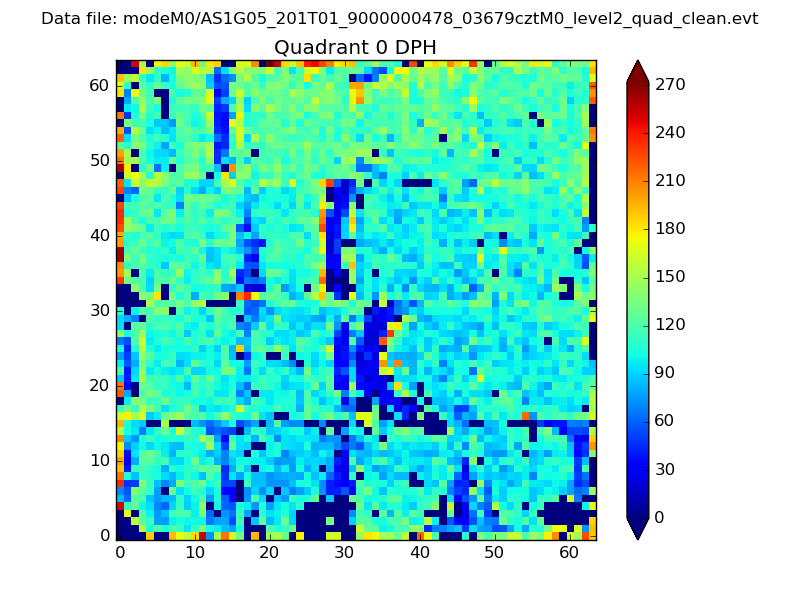 |
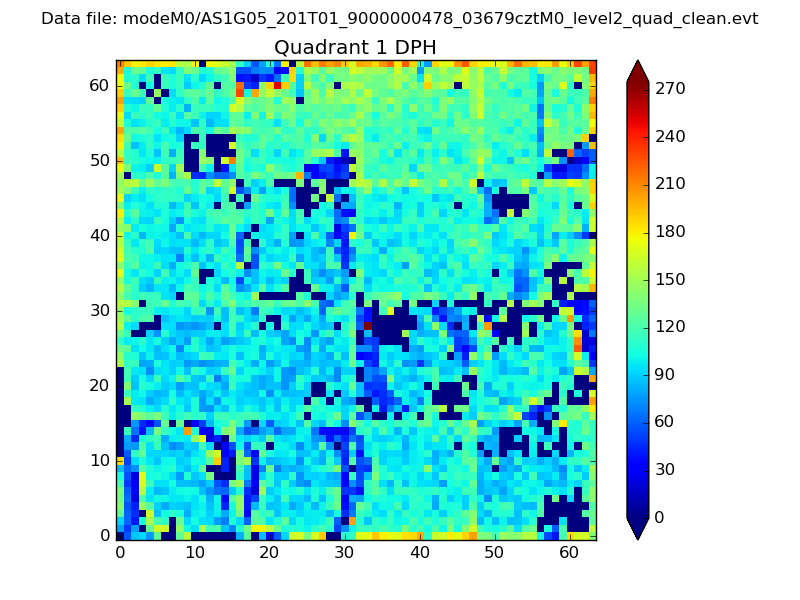 |
Quadrant B |
|---|---|---|---|
| Quadrant D | 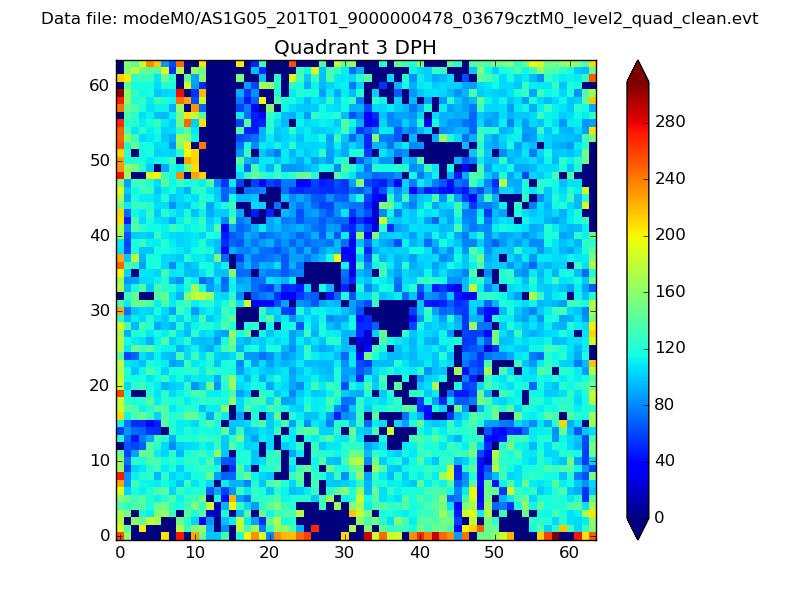 |
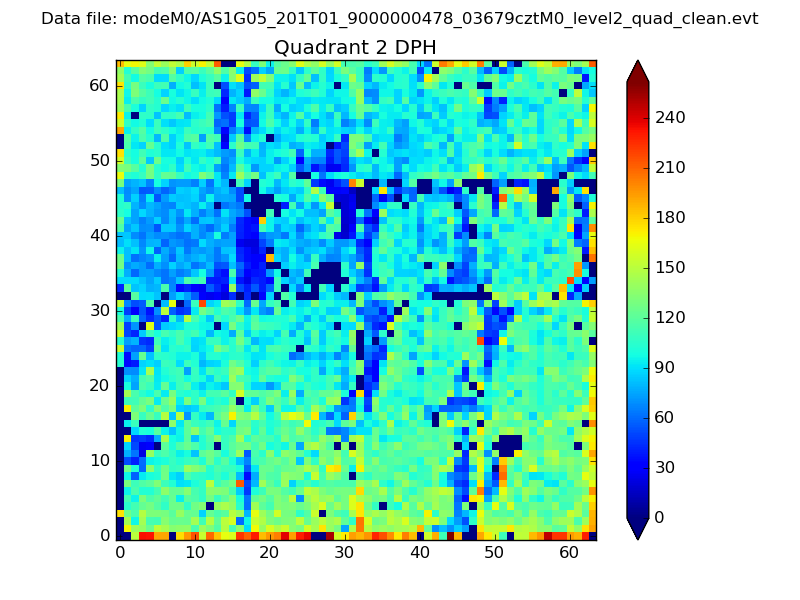 |
Quadrant C |
| Plot type | Count rate plots | Images |
|---|---|---|
| Comparison with Poisson distribution Blue bars denote a histogram of data divided into 1 sec bins. Red curve is a Poisson curve with rate = median count rate of data. |
 |
 |
| Quadrant-wise count rates Data is divided into 100 sec bins |
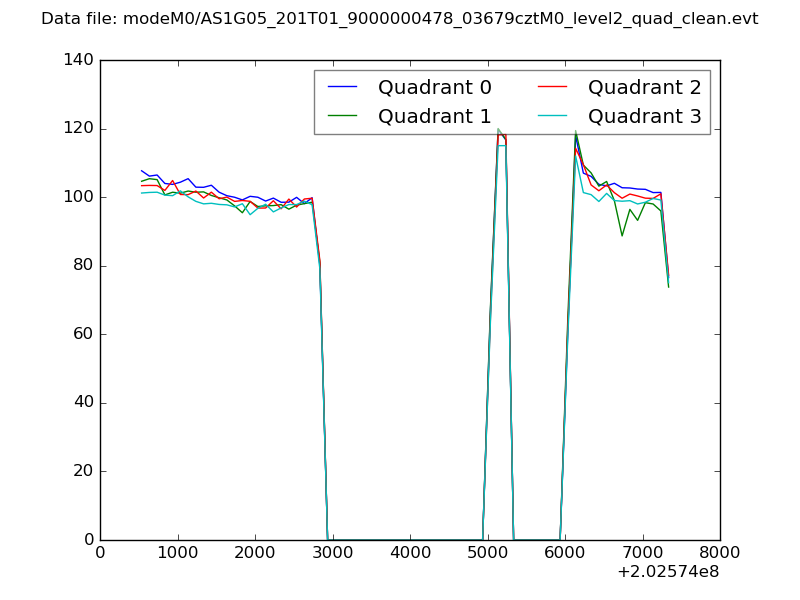 |
|
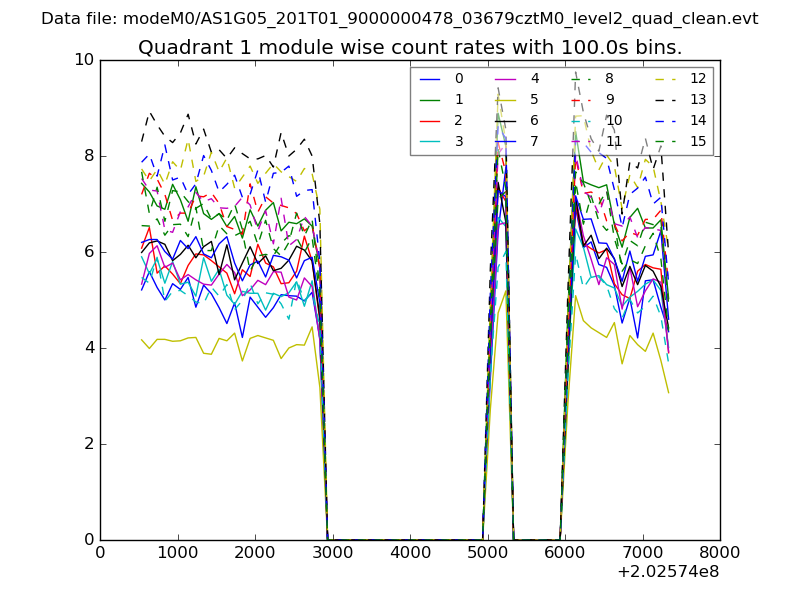
| Module-wise count rates for Quadrant A Data is divided into 100 sec bins |
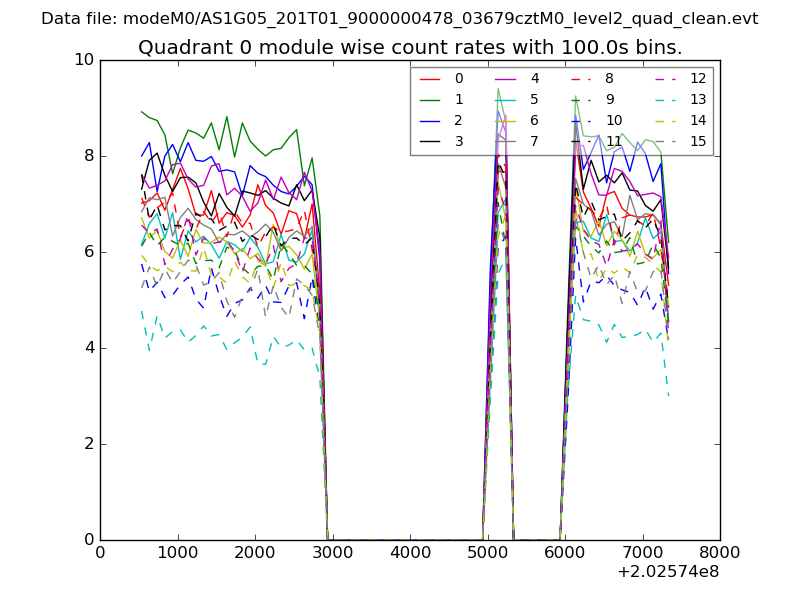 |
 |
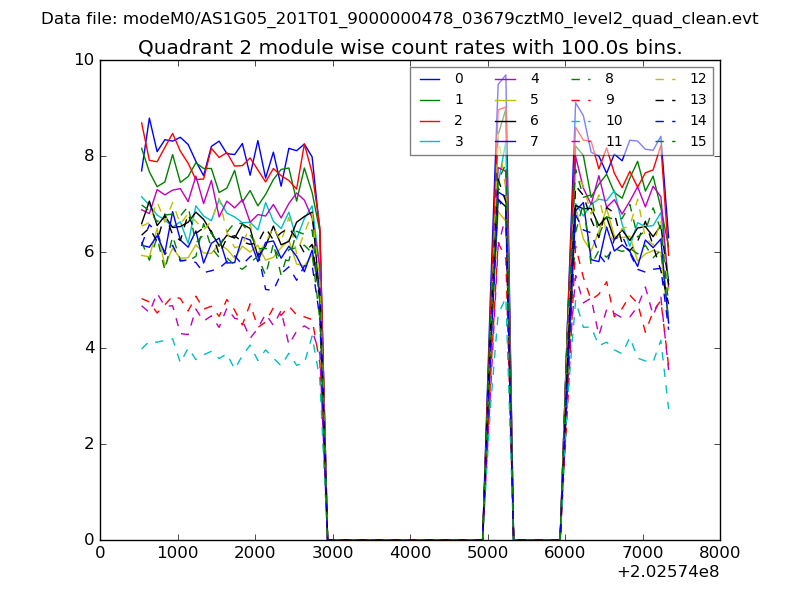
| Module-wise count rates for Quadrant B Data is divided into 100 sec bins |
 |
 |
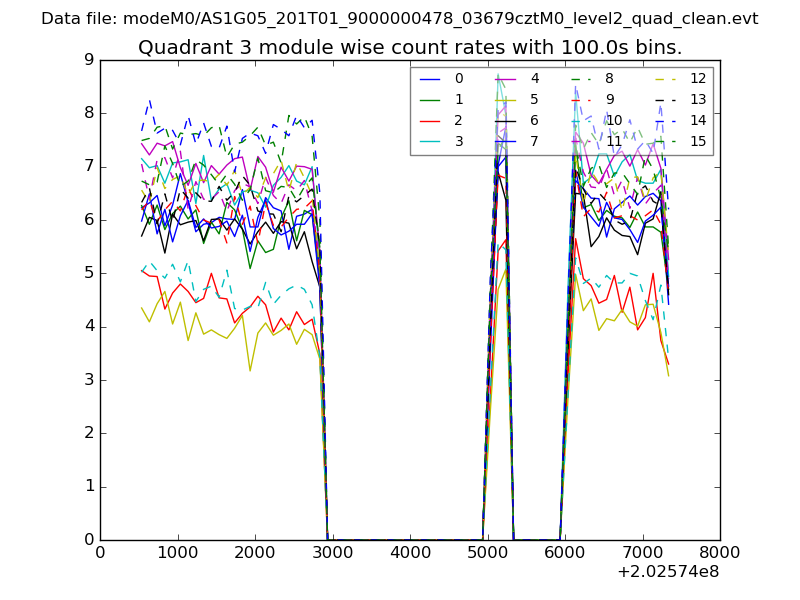
| Module-wise count rates for Quadrant C Data is divided into 100 sec bins |
 |
 |
| Module-wise count rates for Quadrant D Data is divided into 100 sec bins |
 |
 |
| Parameter | Plot |
|---|---|
| CZT HV Monitor |  |
| D_VDD | 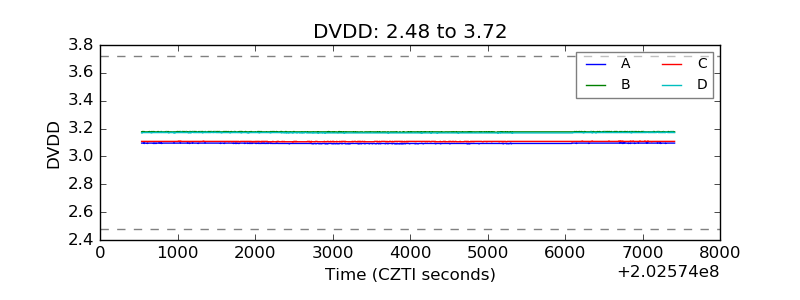 |
| Temperature 1 | 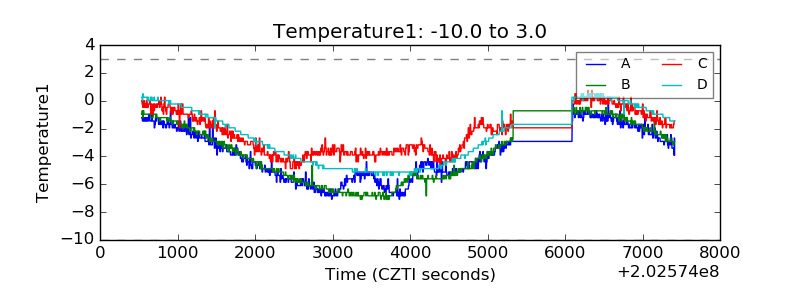 |
| Veto HV Monitor | 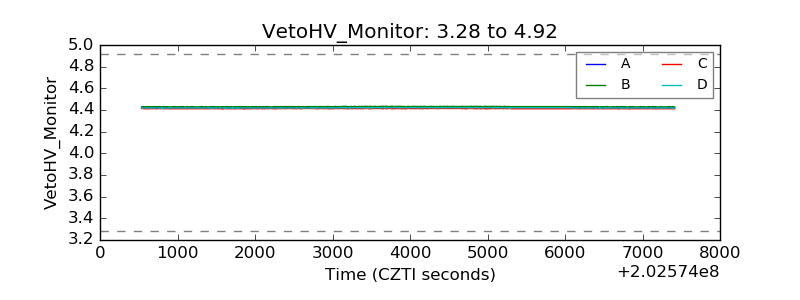 |
| Veto LLD | 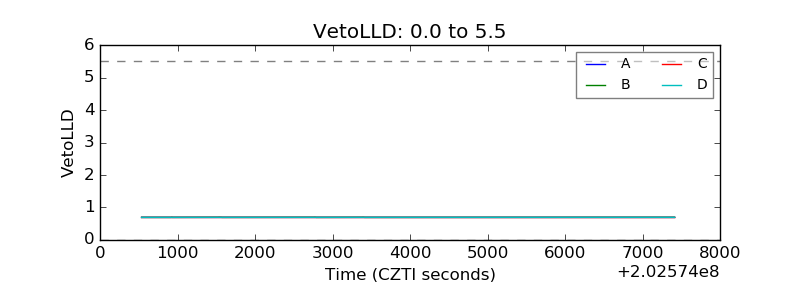 |
| Alpha Counter | 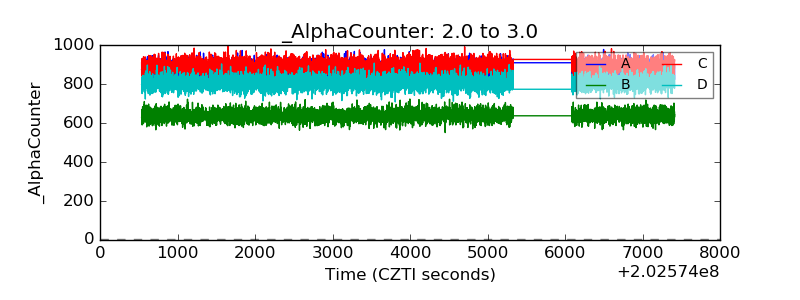 |
| _CPM_Rate | 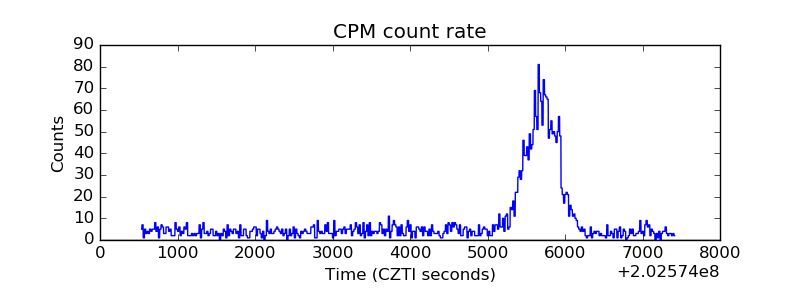 |
| CZT Counter | 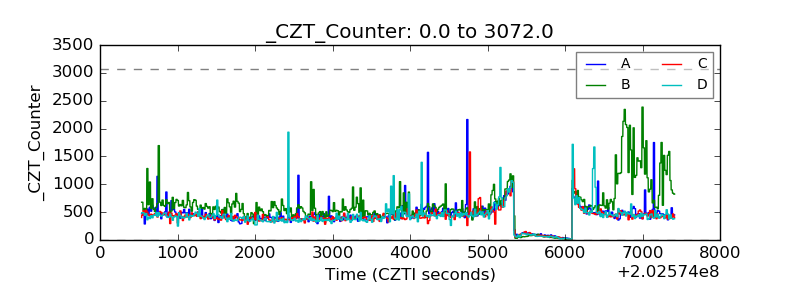 |
| +2.5 Volts monitor |  |
| +5 Volts monitor | 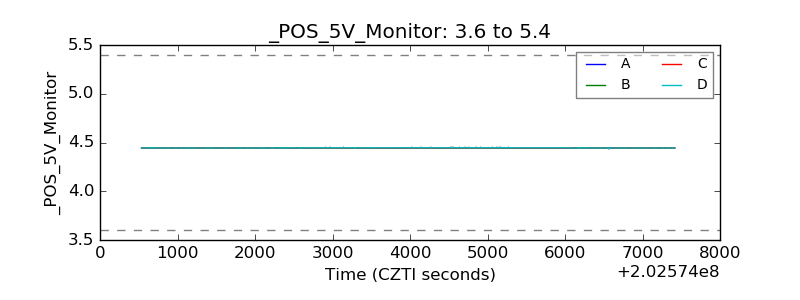 |
| Veto Counter | 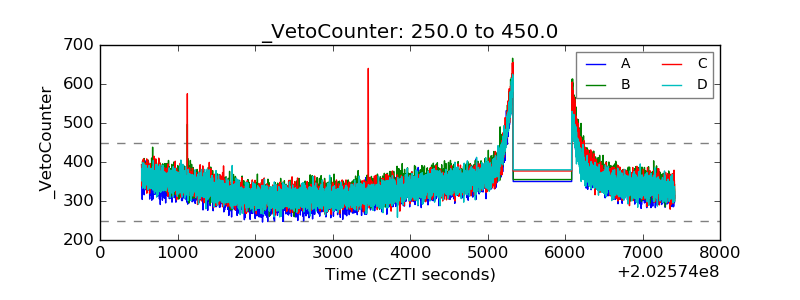 |