| Param | Original file | Final file |
|---|---|---|
| Filename | modeM0/AS1G05_201T01_9000000478_03680cztM0_level2.evt | modeM0/AS1G05_201T01_9000000478_03680cztM0_level2_quad_clean.evt |
| Size (bytes) | 487,762,560 | 80,873,280 |
| Size | 465.2 MB | 77.1 MB |
| Events in quadrant A | 3,353,995 | 498,066 |
| Events in quadrant B | 4,716,071 | 487,803 |
| Events in quadrant C | 3,107,591 | 492,938 |
| Events in quadrant D | 3,118,921 | 482,411 |
| Mode M9 | |||
|---|---|---|---|
| Quadrant | BADHDUFLAG | Total packets | Discarded packets |
| A | 0 | 4 | 0 |
| B | 0 | 4 | 0 |
| C | 0 | 4 | 0 |
| D | 0 | 4 | 0 |
| Mode M0 | |||
|---|---|---|---|
| Quadrant | BADHDUFLAG | Total packets | Discarded packets |
| A | 0 | 14923 | 2 |
| B | 0 | 18672 | 1 |
| C | 0 | 14358 | 1 |
| D | 0 | 14578 | 1 |
| Mode SS | |||
|---|---|---|---|
| Quadrant | BADHDUFLAG | Total packets | Discarded packets |
| A | 0 | 140 | 0 |
| B | 0 | 140 | 0 |
| C | 0 | 140 | 0 |
| D | 0 | 140 | 0 |
| Quadrant | Total seconds | Saturated seconds | Saturation percentage |
|---|---|---|---|
| A | 7006 | 78 | 1.113331% |
| B | 7006 | 206 | 2.940337% |
| C | 7006 | 18 | 0.256923% |
| D | 7006 | 20 | 0.285470% |
Noise dominated data is calculated using 1-second bins in cleaned event files. If a bin has >2000 counts, and if more than 50% of those come from <1% of pixels, then it is considered to be noise-dominated and hence unusable.
| Quadrant | # 1 sec bins | Bins with >0 counts | Bins with >2000 counts | High rate bins dominated by noise | Noise dominated (total time) | Noise dominated (detector-on time) | Marked lightcurve |
|---|---|---|---|---|---|---|---|
| A | 7376 | 7007 | 17 | 17 | 0.23% | 0.24% |  |
| B | 7376 | 7007 | 102 | 102 | 1.38% | 1.46% |  |
| C | 7376 | 7007 | 0 | 0 | 0.00% | 0.00% |  |
| D | 7376 | 7007 | 7 | 7 | 0.09% | 0.10% |  |
Top three noisy pixels from each quadrant. If the there are fewer than three noisy pixels in the level2.evt file, extra rows are filled as -1
| Pixel properties | Quadrant properties | ||||||
|---|---|---|---|---|---|---|---|
| Quadrant | DetID | PixID | Counts | Sigma | Mean | Median | Sigma |
| A | 0 | 118 | 87462 | 521.21 | 805 | 787 | 166.3 |
| A | 0 | 50 | 51198 | 303.14 | 805 | 787 | 166.3 |
| A | 13 | 251 | 40554 | 239.13 | 805 | 787 | 166.3 |
| B | 15 | 204 | 886496 | 5611.72 | 811 | 791 | 157.8 |
| B | 3 | 0 | 260557 | 1645.85 | 811 | 791 | 157.8 |
| B | 14 | 167 | 129198 | 813.57 | 811 | 791 | 157.8 |
| C | 9 | 247 | 12134 | 61.32 | 786 | 787 | 185.0 |
| C | 9 | 144 | 10689 | 53.51 | 786 | 787 | 185.0 |
| C | 13 | 61 | 6667 | 31.78 | 786 | 787 | 185.0 |
| D | 12 | 221 | 35849 | 182.65 | 785 | 763 | 192.1 |
| D | 13 | 223 | 25388 | 128.19 | 785 | 763 | 192.1 |
| D | 14 | 34 | 15646 | 77.48 | 785 | 763 | 192.1 |
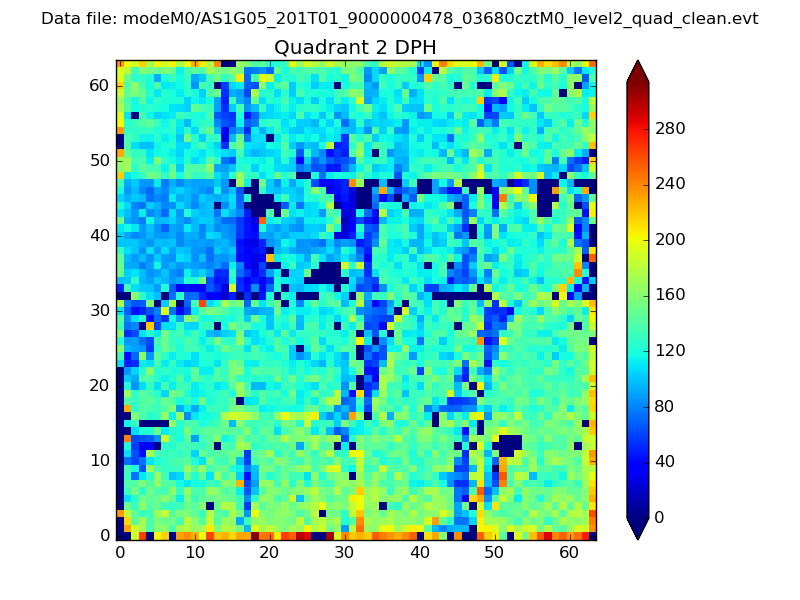
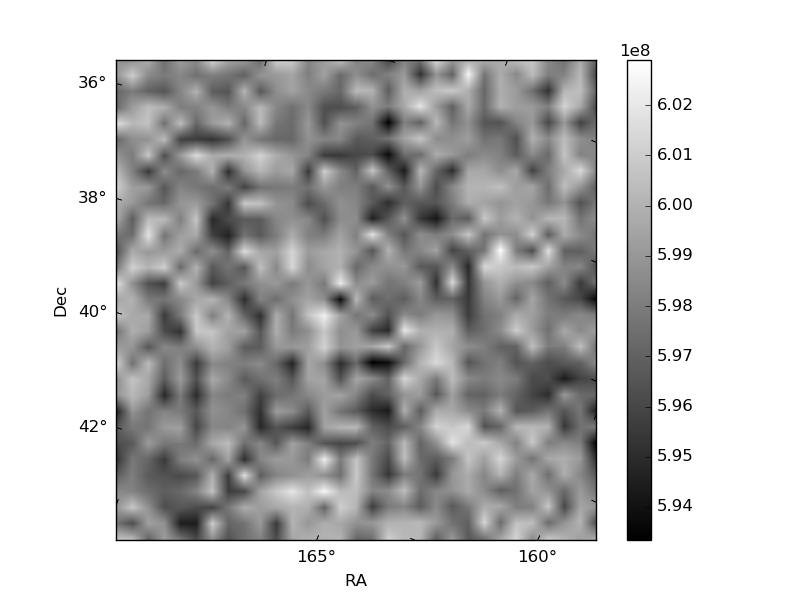
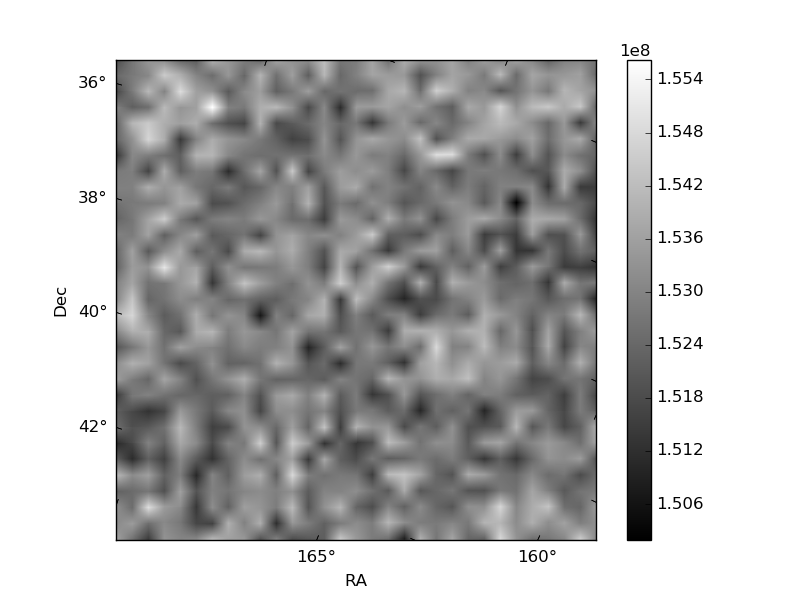
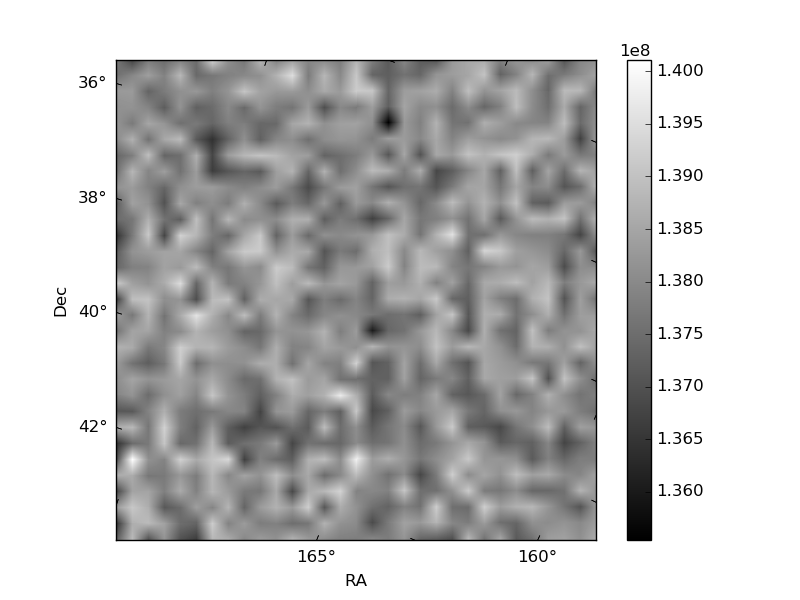
Histogram calculated using DETX and DETY for each event in the final _common_clean file
| Quadrant A | 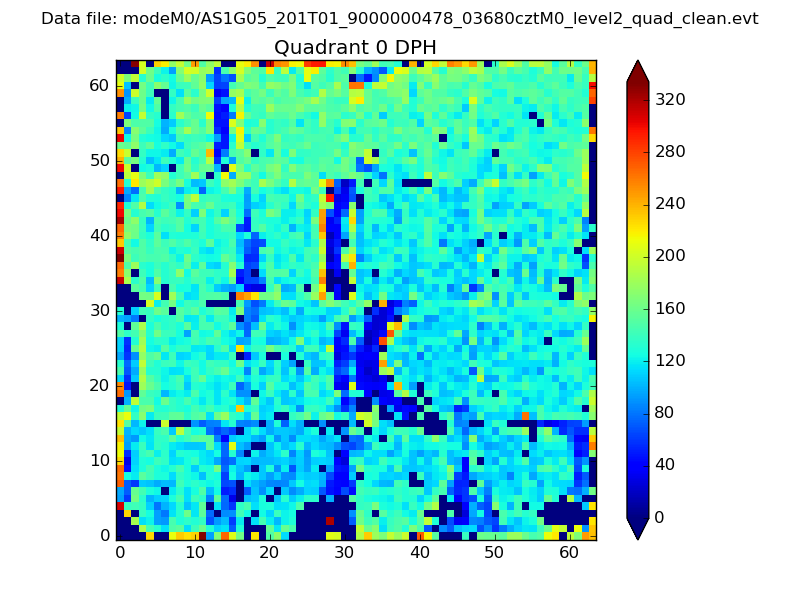 |
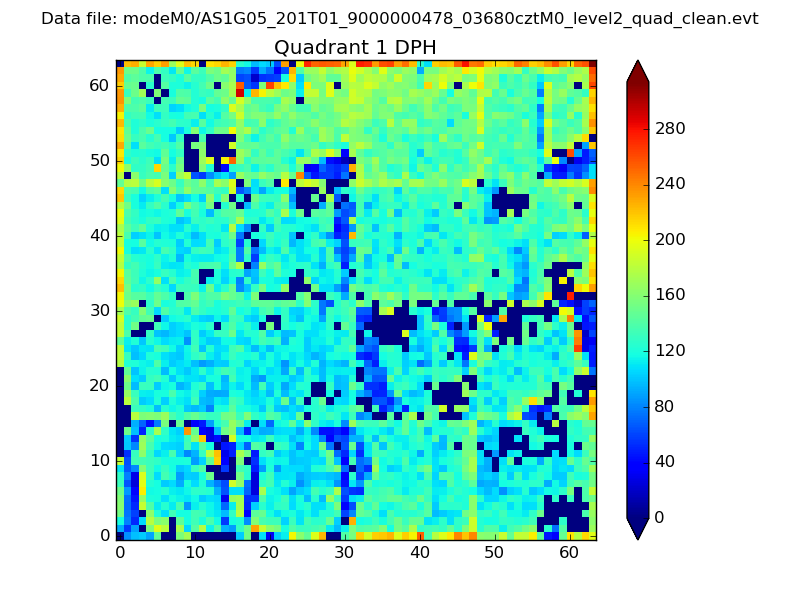 |
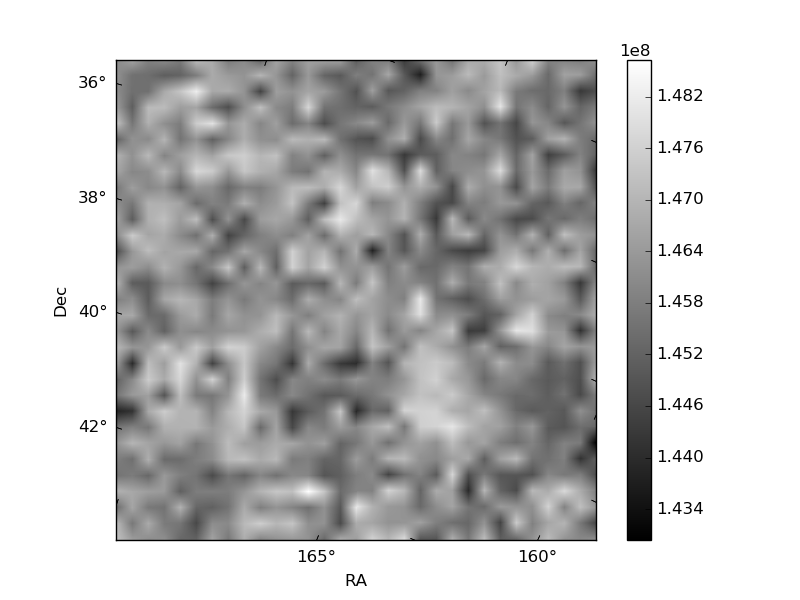
Quadrant B |
|---|---|---|---|
| Quadrant D | 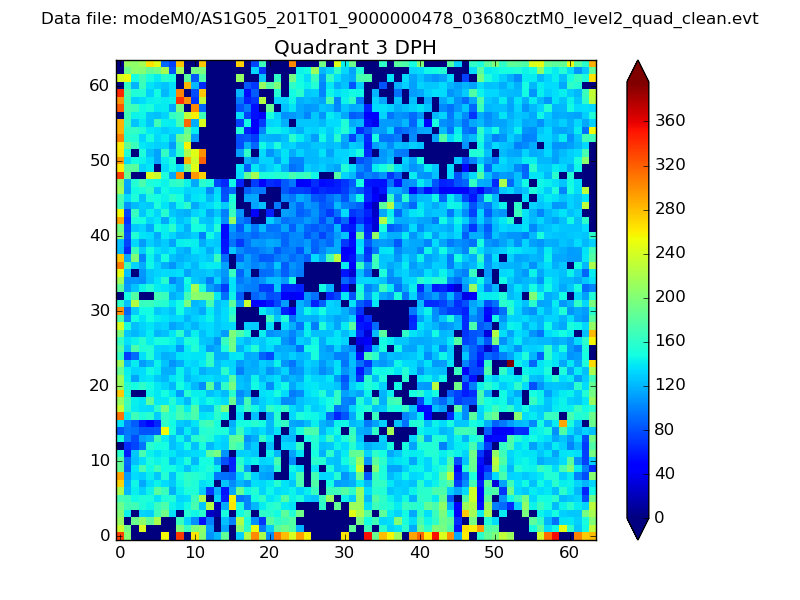 |
 |
Quadrant C |
| Plot type | Count rate plots | Images |
|---|---|---|
| Comparison with Poisson distribution Blue bars denote a histogram of data divided into 1 sec bins. Red curve is a Poisson curve with rate = median count rate of data. |
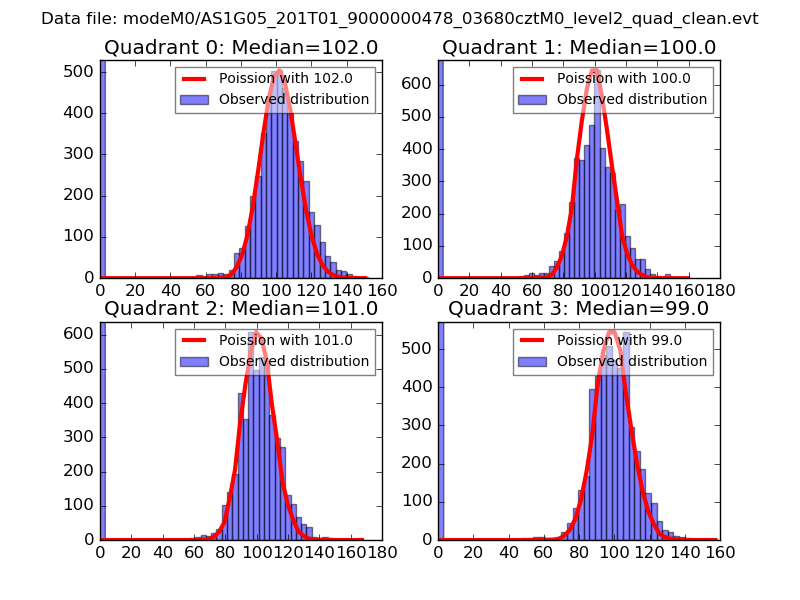 |
 |
| Quadrant-wise count rates Data is divided into 100 sec bins |
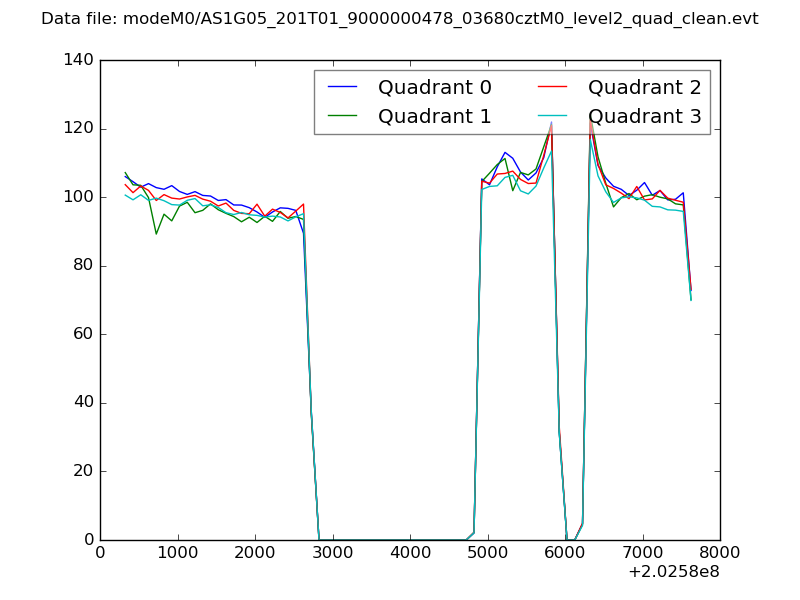 |
|
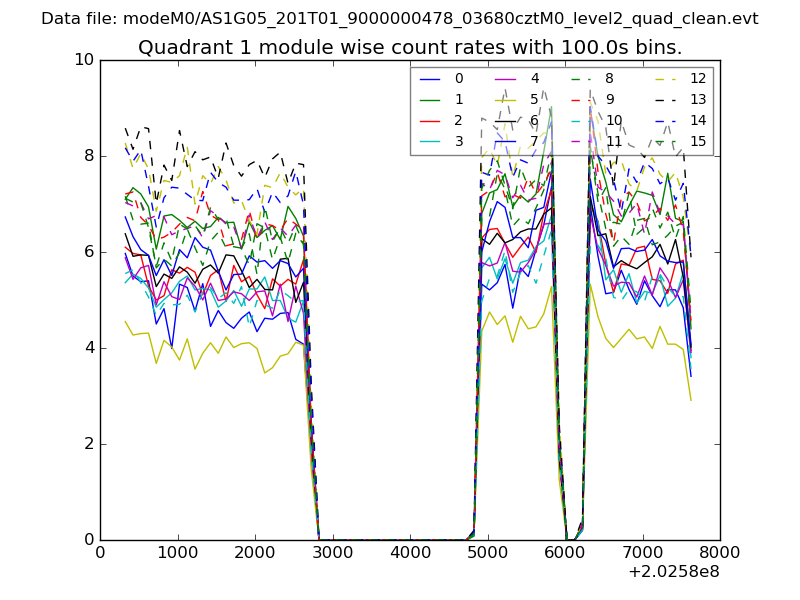
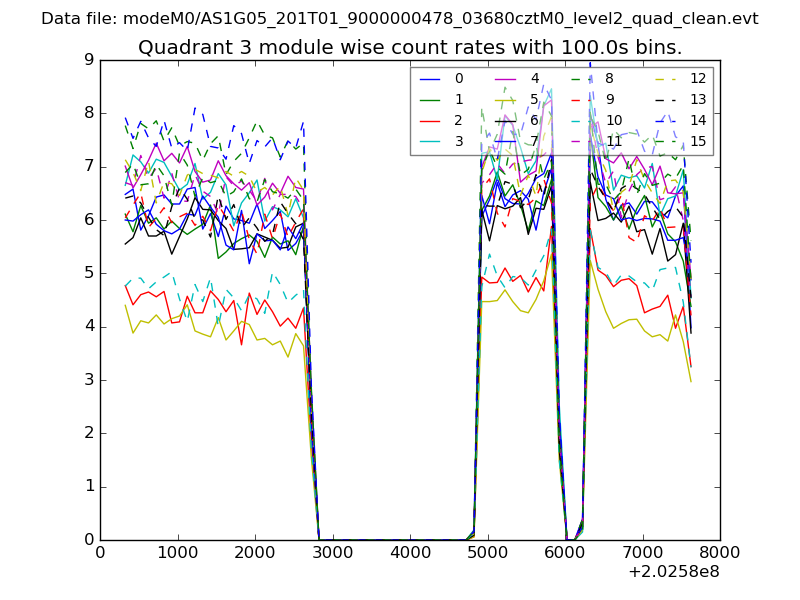
| Module-wise count rates for Quadrant A Data is divided into 100 sec bins |
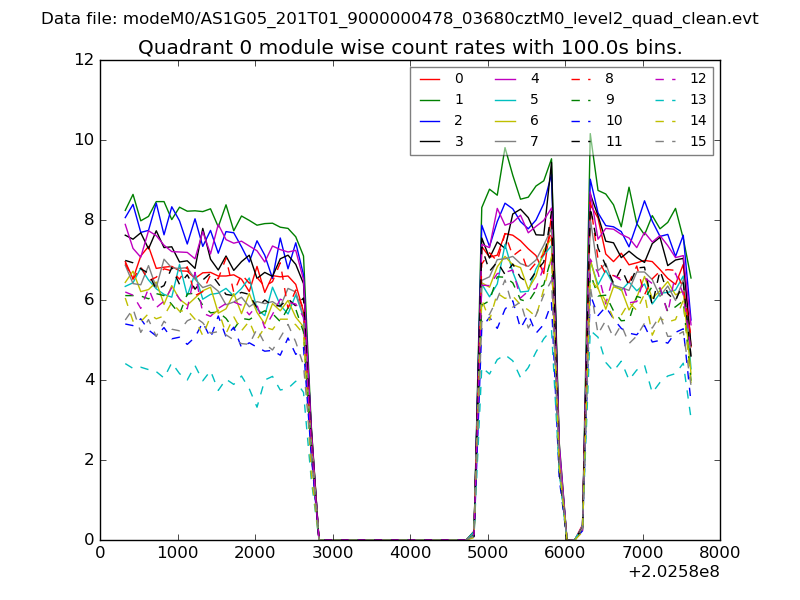 |
 |
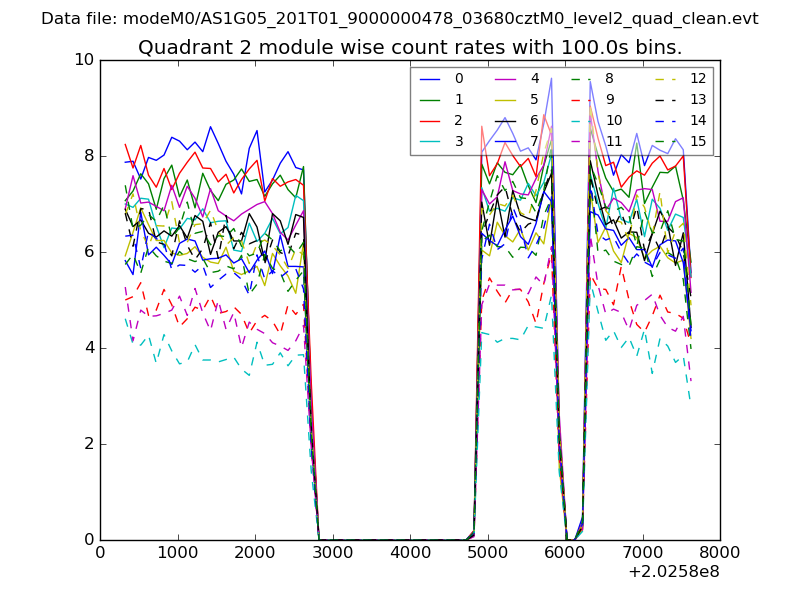
| Module-wise count rates for Quadrant B Data is divided into 100 sec bins |
 |
 |
| Module-wise count rates for Quadrant C Data is divided into 100 sec bins |
 |
 |
| Module-wise count rates for Quadrant D Data is divided into 100 sec bins |
 |
 |
| Parameter | Plot |
|---|---|
| CZT HV Monitor | 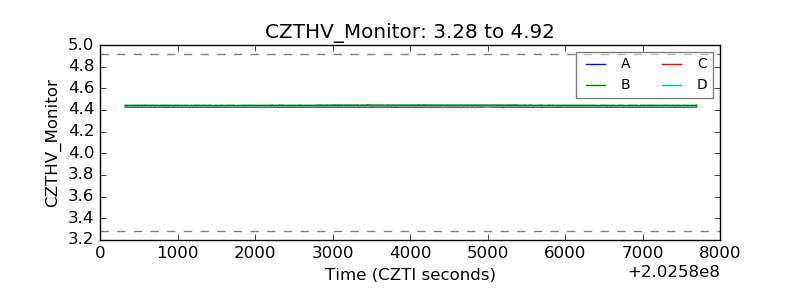 |
| D_VDD | 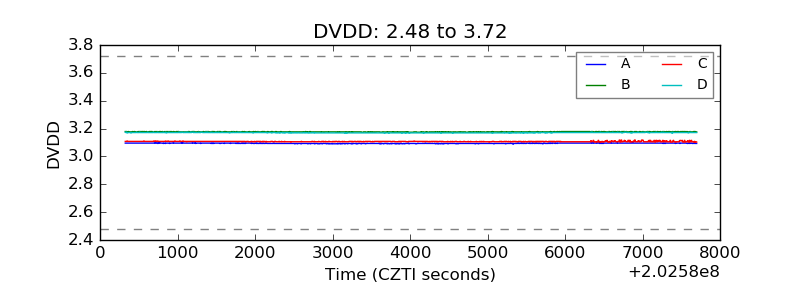 |
| Temperature 1 | 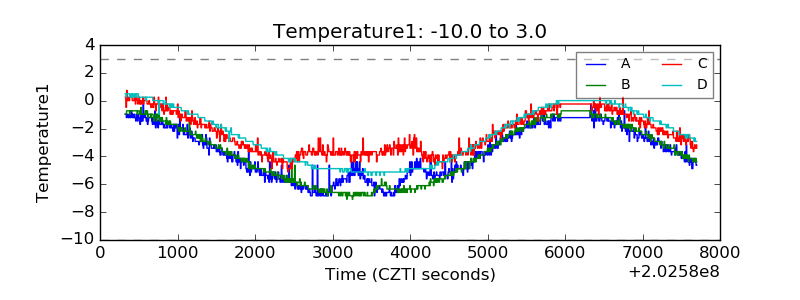 |
| Veto HV Monitor | 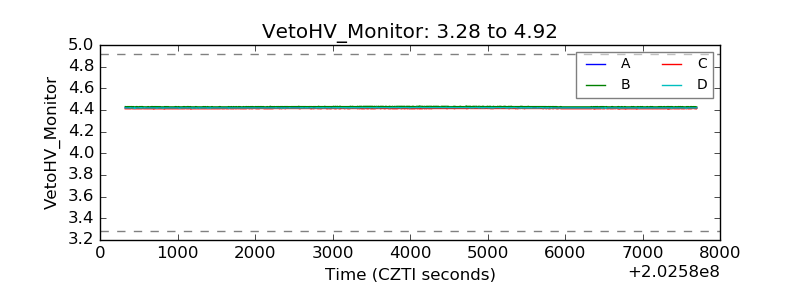 |
| Veto LLD | 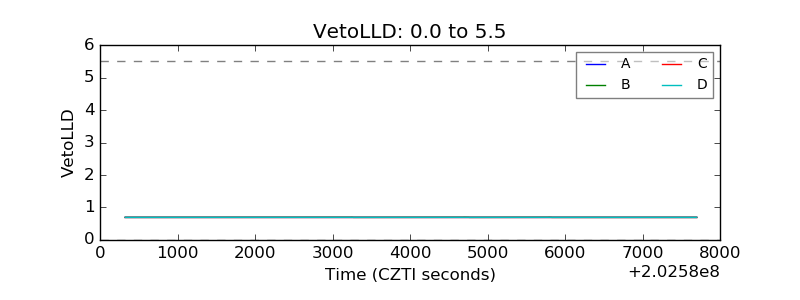 |
| Alpha Counter | 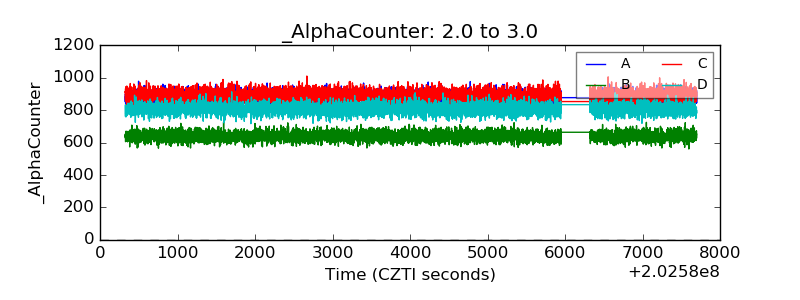 |
| _CPM_Rate | 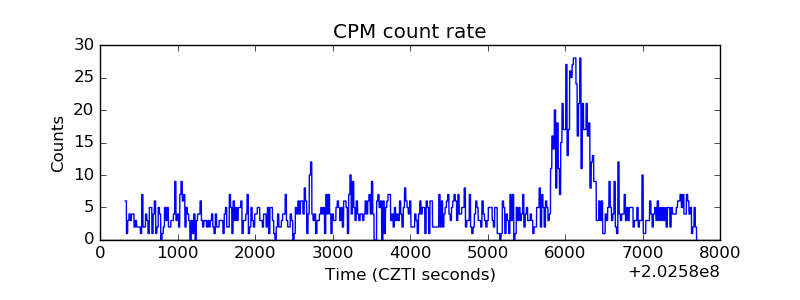 |
| CZT Counter | 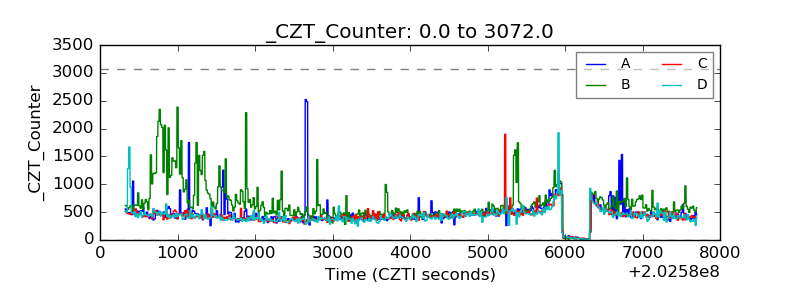 |
| +2.5 Volts monitor |  |
| +5 Volts monitor |  |
| Veto Counter | 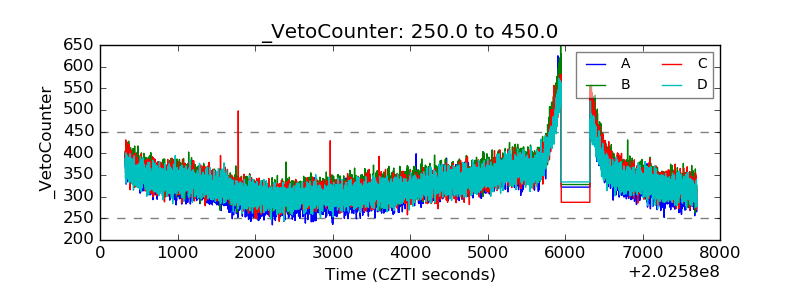 |