| Param | Original file | Final file |
|---|---|---|
| Filename | modeM0/AS1G05_201T01_9000000478_03681cztM0_level2.evt | modeM0/AS1G05_201T01_9000000478_03681cztM0_level2_quad_clean.evt |
| Size (bytes) | 512,153,280 | 90,336,960 |
| Size | 488.4 MB | 86.2 MB |
| Events in quadrant A | 3,816,497 | 557,122 |
| Events in quadrant B | 4,329,335 | 553,522 |
| Events in quadrant C | 3,433,440 | 554,638 |
| Events in quadrant D | 3,415,690 | 542,010 |
| Mode M9 | |||
|---|---|---|---|
| Quadrant | BADHDUFLAG | Total packets | Discarded packets |
| A | 0 | 6 | 0 |
| B | 0 | 6 | 0 |
| C | 0 | 6 | 0 |
| D | 0 | 6 | 0 |
| Mode M0 | |||
|---|---|---|---|
| Quadrant | BADHDUFLAG | Total packets | Discarded packets |
| A | 0 | 16724 | 3 |
| B | 0 | 17759 | 2 |
| C | 0 | 15754 | 2 |
| D | 0 | 15914 | 2 |
| Mode SS | |||
|---|---|---|---|
| Quadrant | BADHDUFLAG | Total packets | Discarded packets |
| A | 0 | 156 | 0 |
| B | 0 | 156 | 0 |
| C | 0 | 156 | 0 |
| D | 0 | 156 | 0 |
| Quadrant | Total seconds | Saturated seconds | Saturation percentage |
|---|---|---|---|
| A | 7594 | 78 | 1.027127% |
| B | 7594 | 78 | 1.027127% |
| C | 7594 | 38 | 0.500395% |
| D | 7594 | 18 | 0.237029% |
Noise dominated data is calculated using 1-second bins in cleaned event files. If a bin has >2000 counts, and if more than 50% of those come from <1% of pixels, then it is considered to be noise-dominated and hence unusable.
| Quadrant | # 1 sec bins | Bins with >0 counts | Bins with >2000 counts | High rate bins dominated by noise | Noise dominated (total time) | Noise dominated (detector-on time) | Marked lightcurve |
|---|---|---|---|---|---|---|---|
| A | 8214 | 7596 | 18 | 18 | 0.22% | 0.24% | 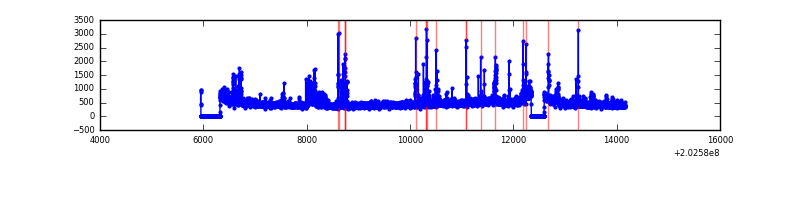 |
| B | 8214 | 7596 | 17 | 17 | 0.21% | 0.22% | 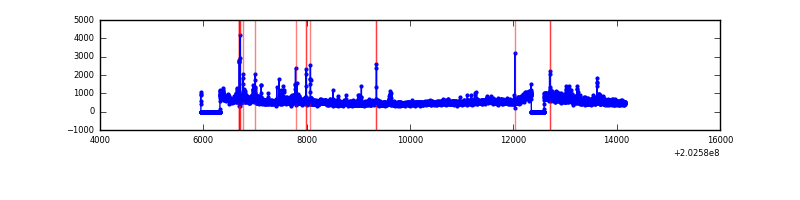 |
| C | 8214 | 7596 | 9 | 9 | 0.11% | 0.12% |  |
| D | 8214 | 7596 | 8 | 8 | 0.10% | 0.11% | 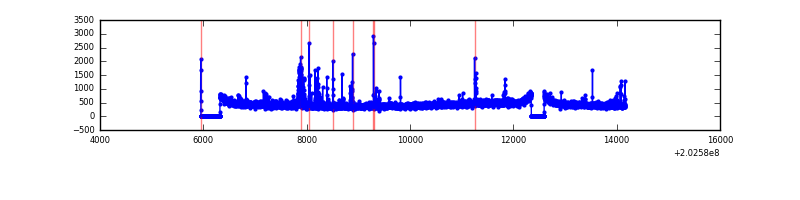 |
Top three noisy pixels from each quadrant. If the there are fewer than three noisy pixels in the level2.evt file, extra rows are filled as -1
| Pixel properties | Quadrant properties | ||||||
|---|---|---|---|---|---|---|---|
| Quadrant | DetID | PixID | Counts | Sigma | Mean | Median | Sigma |
| A | 0 | 128 | 132851 | 736.95 | 867 | 844 | 179.1 |
| A | 0 | 118 | 107940 | 597.88 | 867 | 844 | 179.1 |
| A | 13 | 251 | 98413 | 544.69 | 867 | 844 | 179.1 |
| B | 15 | 204 | 406921 | 2385.53 | 881 | 859 | 170.2 |
| B | 3 | 0 | 235965 | 1381.2 | 881 | 859 | 170.2 |
| B | 5 | 172 | 66410 | 385.1 | 881 | 859 | 170.2 |
| C | 1 | 16 | 74422 | 365.22 | 850 | 851 | 201.4 |
| C | 8 | 128 | 16840 | 79.37 | 850 | 851 | 201.4 |
| C | 8 | 112 | 8543 | 38.18 | 850 | 851 | 201.4 |
| D | 10 | 187 | 71094 | 340.11 | 847 | 822 | 206.6 |
| D | 13 | 223 | 39491 | 187.16 | 847 | 822 | 206.6 |
| D | 5 | 233 | 31404 | 148.02 | 847 | 822 | 206.6 |
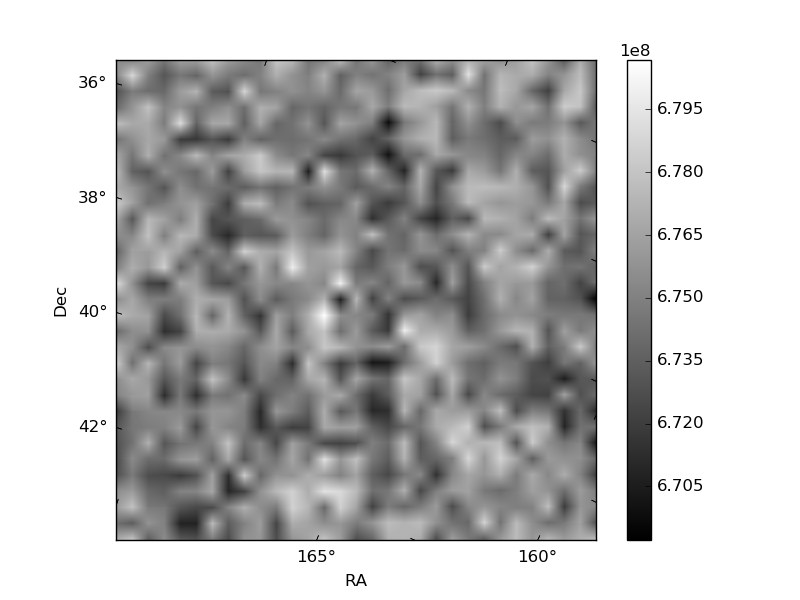
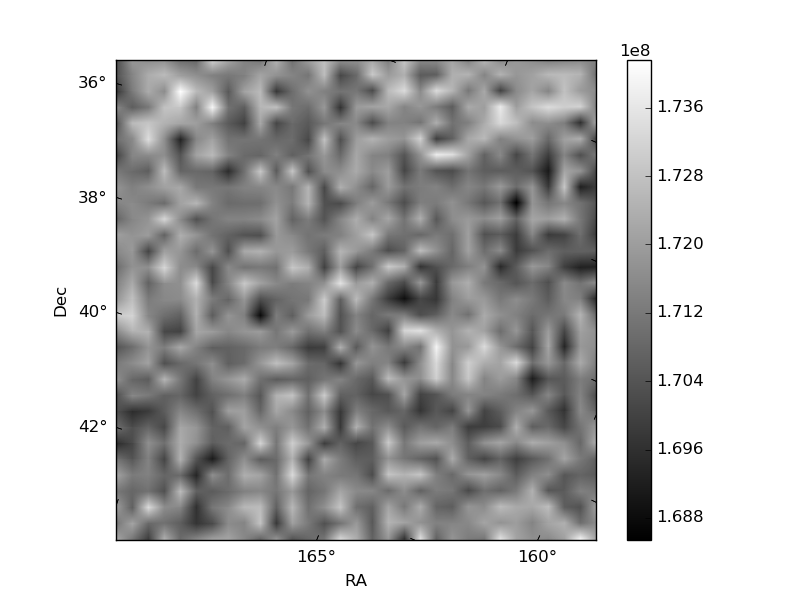
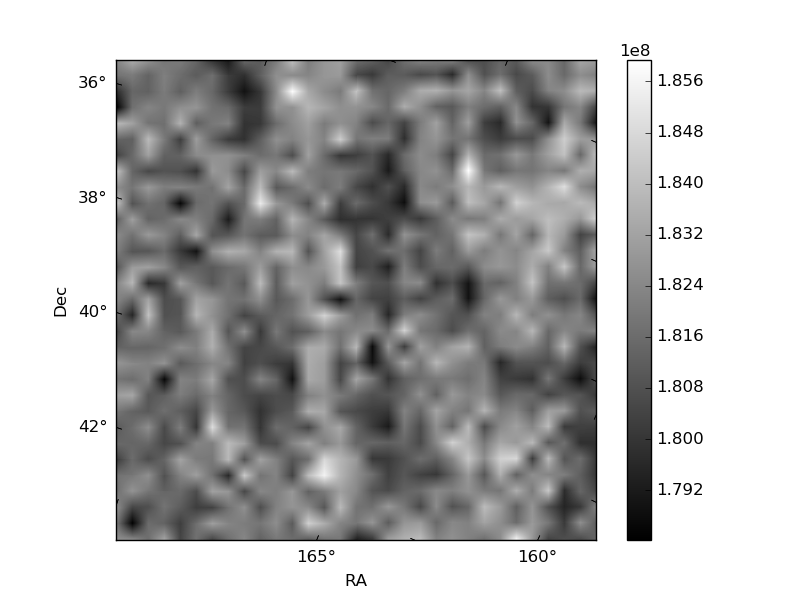
Histogram calculated using DETX and DETY for each event in the final _common_clean file
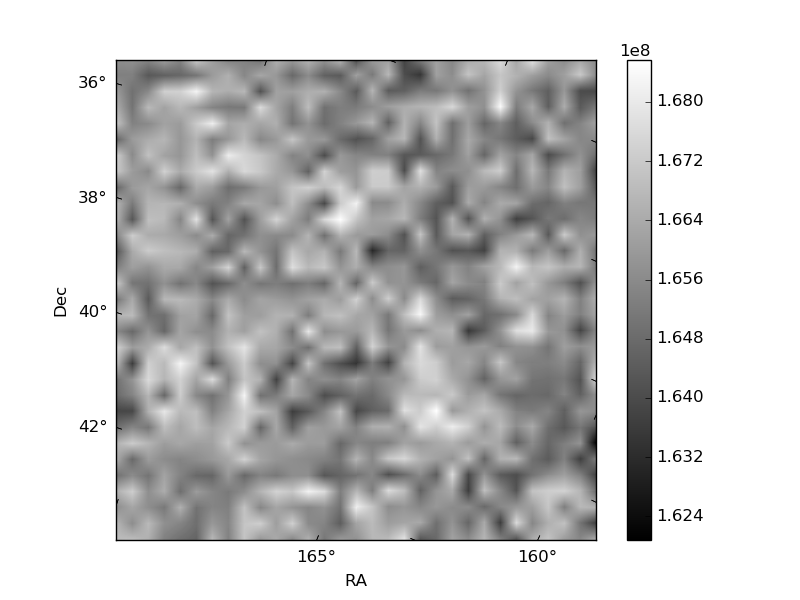
| Quadrant A | 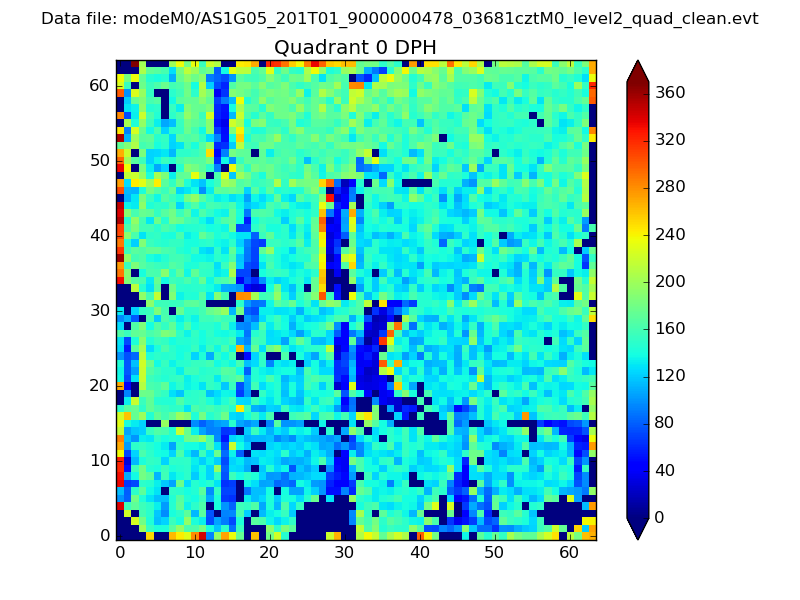 |
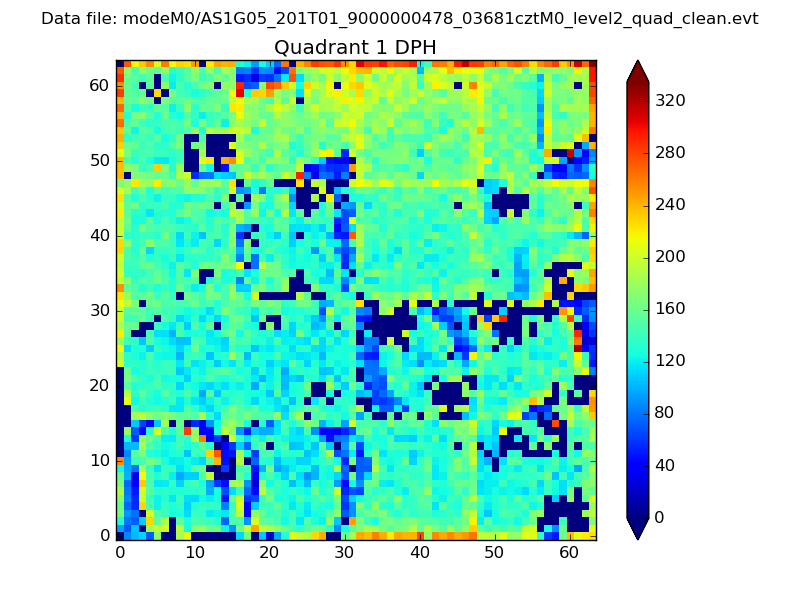 |
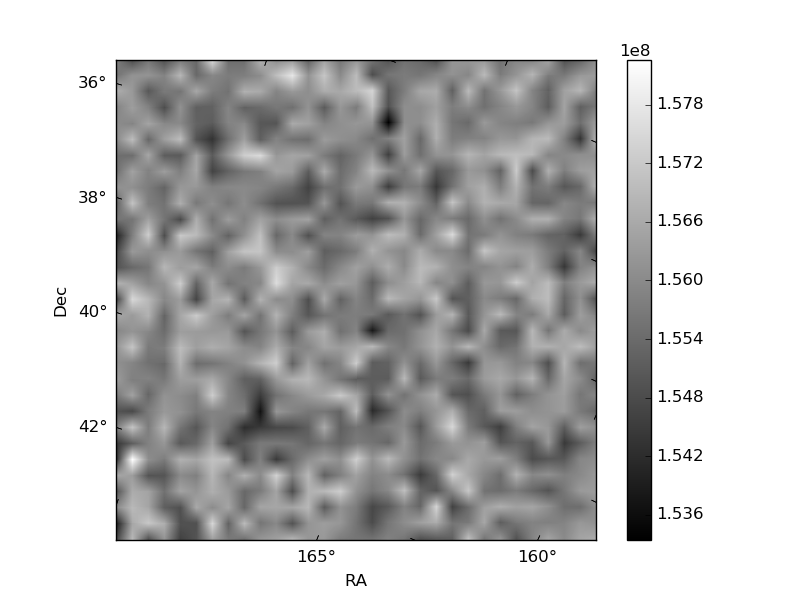
Quadrant B |
|---|---|---|---|
| Quadrant D | 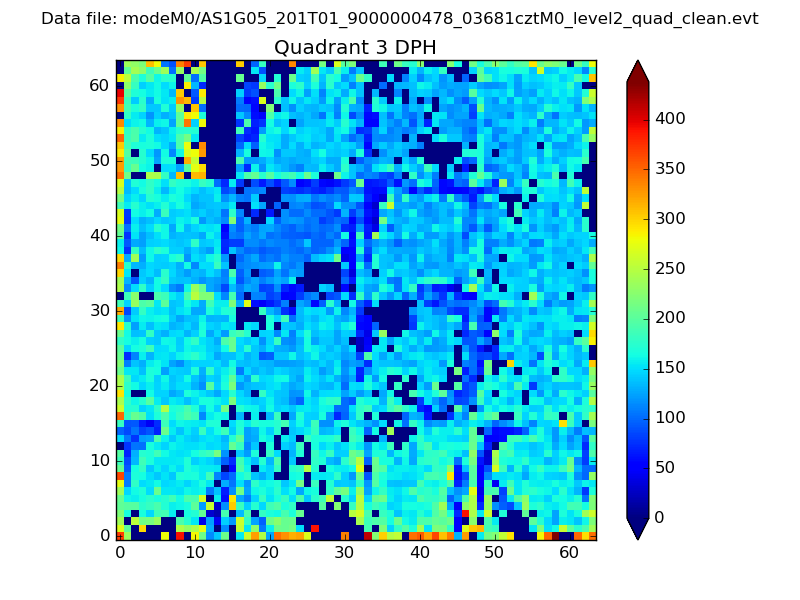 |
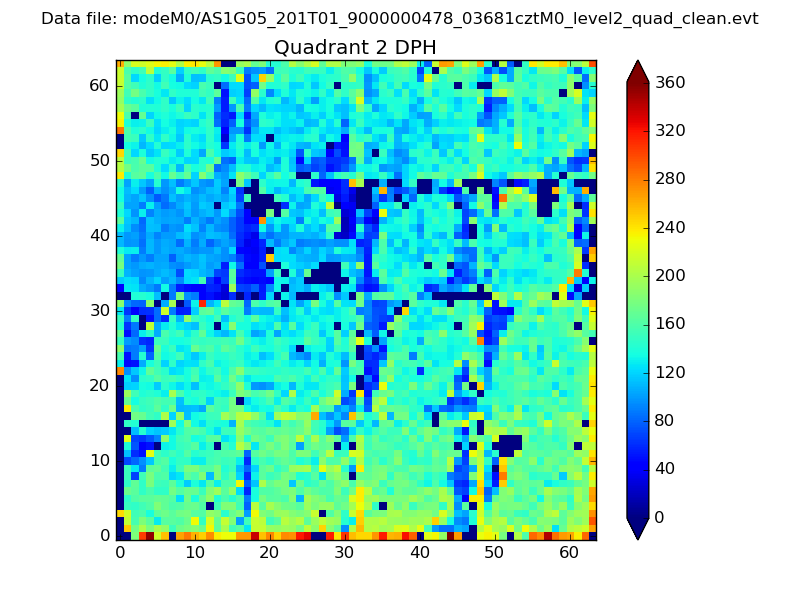 |
Quadrant C |
| Plot type | Count rate plots | Images |
|---|---|---|
| Comparison with Poisson distribution Blue bars denote a histogram of data divided into 1 sec bins. Red curve is a Poisson curve with rate = median count rate of data. |
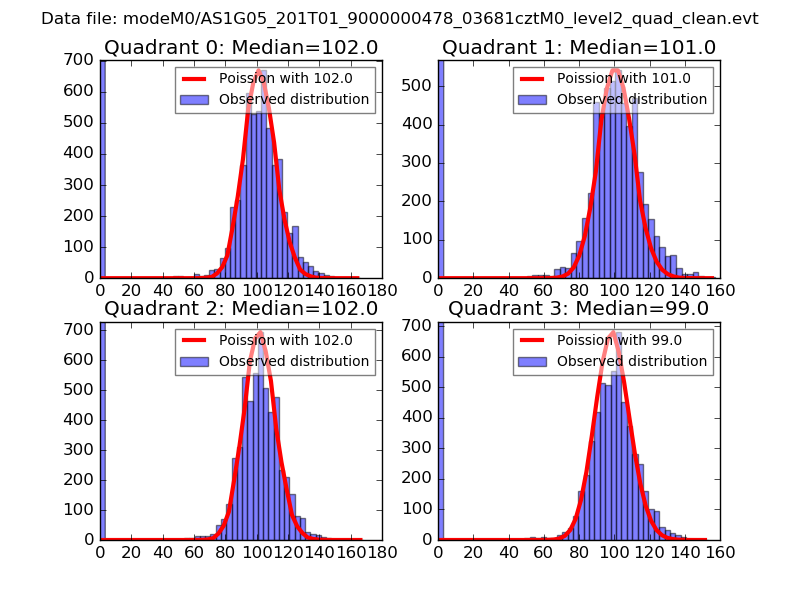 |
 |
| Quadrant-wise count rates Data is divided into 100 sec bins |
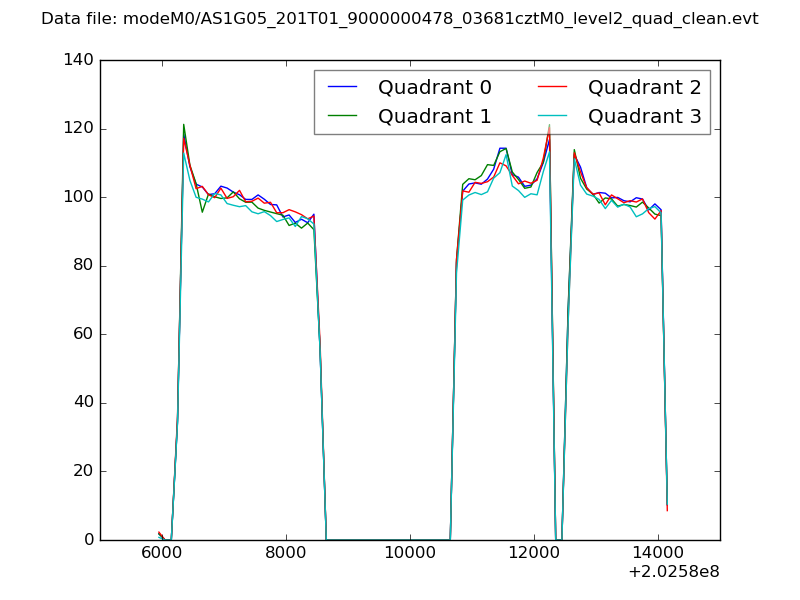 |
|
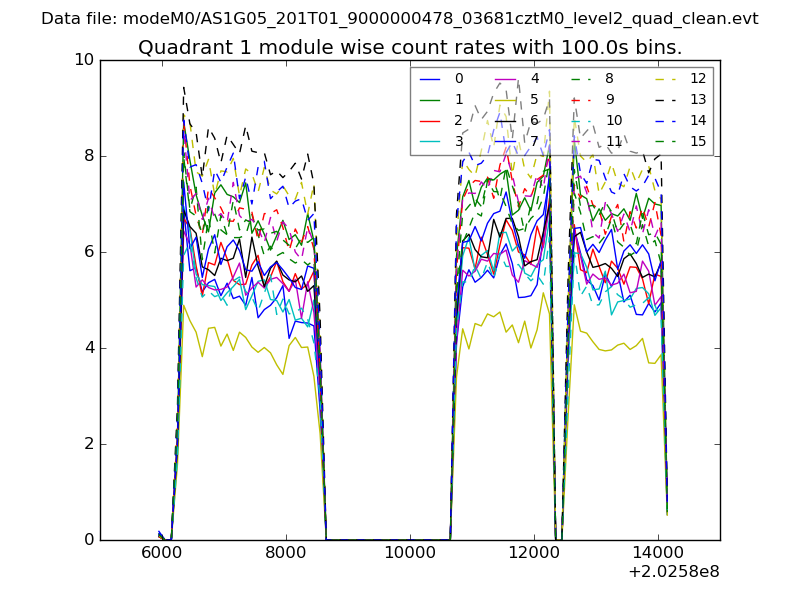
| Module-wise count rates for Quadrant A Data is divided into 100 sec bins |
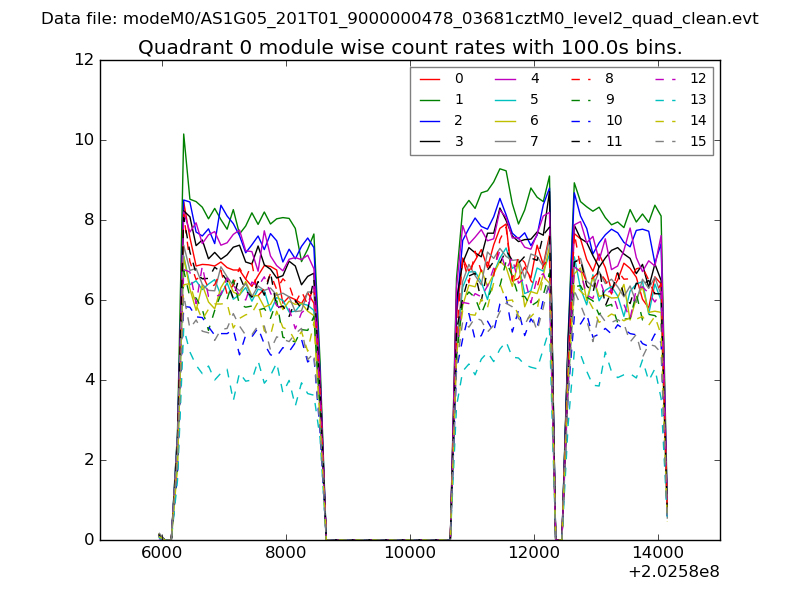 |
 |
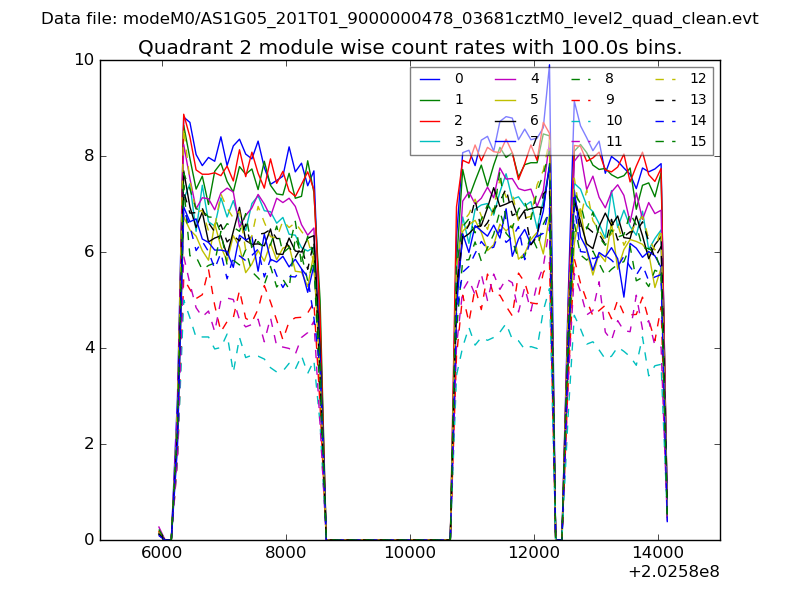
| Module-wise count rates for Quadrant B Data is divided into 100 sec bins |
 |
 |
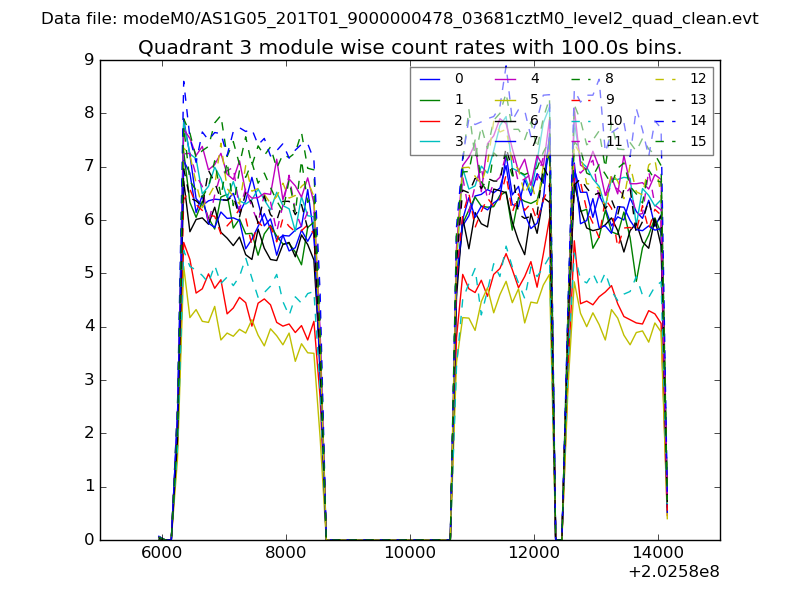
| Module-wise count rates for Quadrant C Data is divided into 100 sec bins |
 |
 |
| Module-wise count rates for Quadrant D Data is divided into 100 sec bins |
 |
 |
| Parameter | Plot |
|---|---|
| CZT HV Monitor | 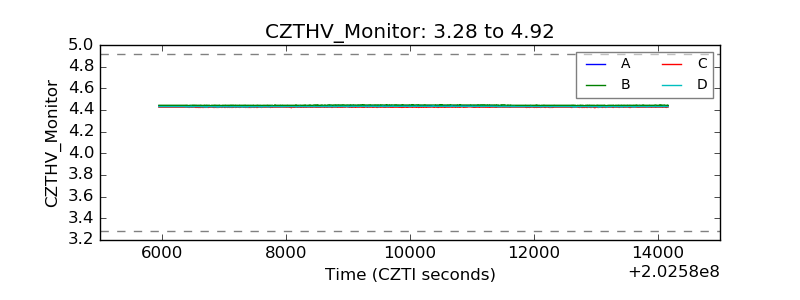 |
| D_VDD | 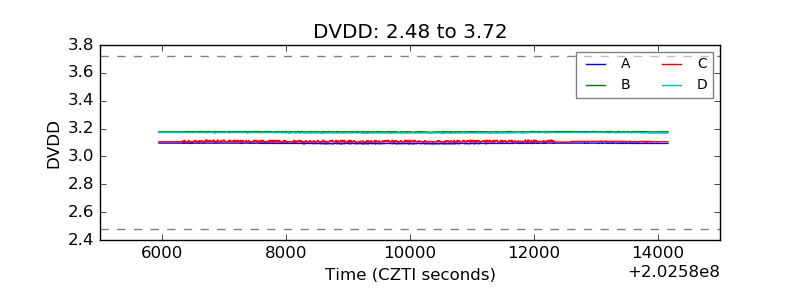 |
| Temperature 1 | 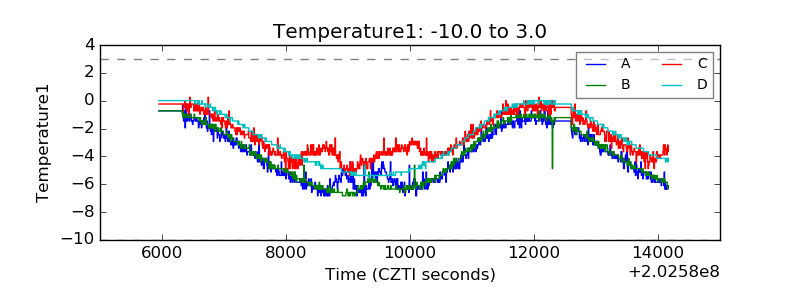 |
| Veto HV Monitor | 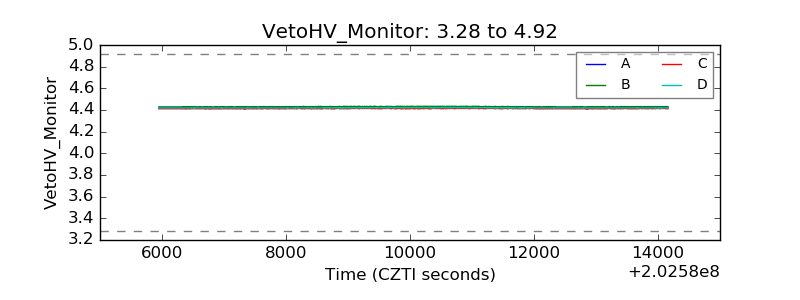 |
| Veto LLD | 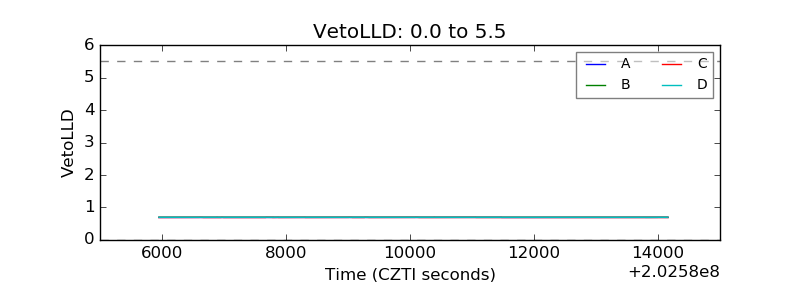 |
| Alpha Counter | 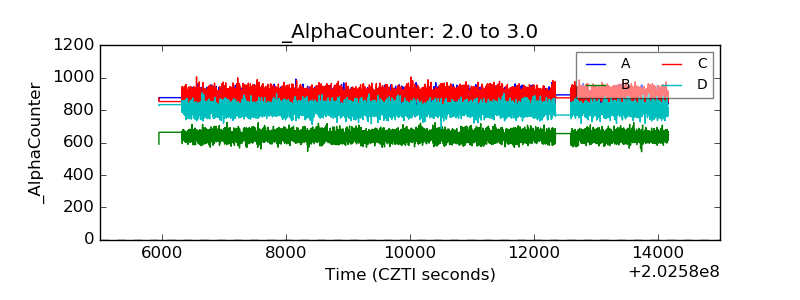 |
| _CPM_Rate | 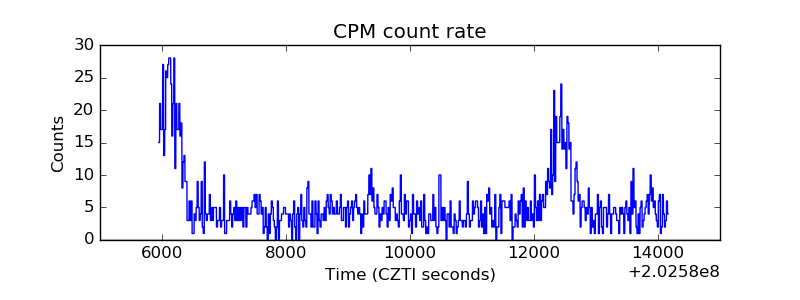 |
| CZT Counter | 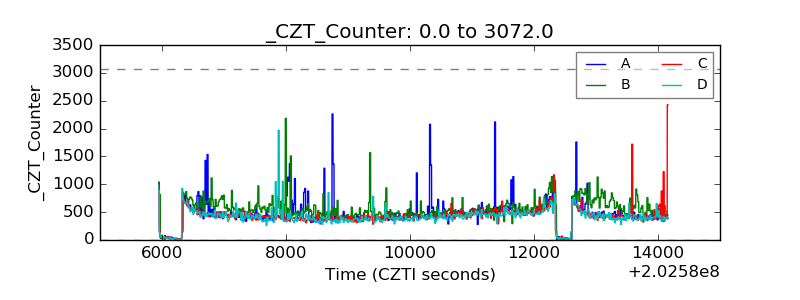 |
| +2.5 Volts monitor |  |
| +5 Volts monitor |  |
| Veto Counter | 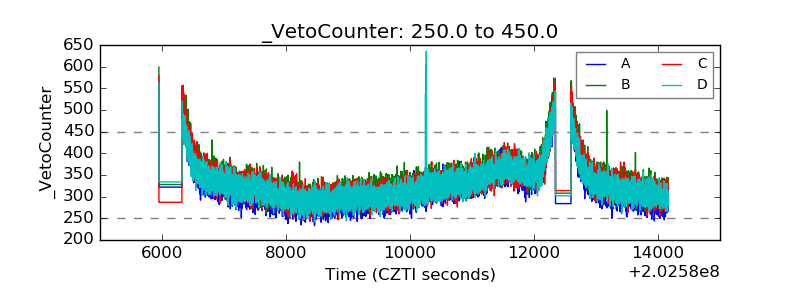 |