| Param | Original file | Final file |
|---|---|---|
| Filename | modeM0/AS1G05_201T01_9000000478_03685cztM0_level2.evt | modeM0/AS1G05_201T01_9000000478_03685cztM0_level2_quad_clean.evt |
| Size (bytes) | 191,836,800 | 38,998,080 |
| Size | 182.9 MB | 37.2 MB |
| Events in quadrant A | 1,509,424 | 250,795 |
| Events in quadrant B | 1,733,355 | 251,230 |
| Events in quadrant C | 1,173,049 | 253,965 |
| Events in quadrant D | 1,225,395 | 248,450 |
| Mode M9 | |||
|---|---|---|---|
| Quadrant | BADHDUFLAG | Total packets | Discarded packets |
| A | 0 | 4 | 0 |
| B | 0 | 4 | 0 |
| C | 0 | 4 | 0 |
| D | 0 | 4 | 0 |
| Mode M0 | |||
|---|---|---|---|
| Quadrant | BADHDUFLAG | Total packets | Discarded packets |
| A | 0 | 6216 | 1 |
| B | 0 | 6861 | 1 |
| C | 0 | 5117 | 1 |
| D | 0 | 5314 | 1 |
| Mode SS | |||
|---|---|---|---|
| Quadrant | BADHDUFLAG | Total packets | Discarded packets |
| A | 0 | 50 | 0 |
| B | 0 | 50 | 0 |
| C | 0 | 50 | 0 |
| D | 0 | 50 | 0 |
| Quadrant | Total seconds | Saturated seconds | Saturation percentage |
|---|---|---|---|
| A | 2453 | 85 | 3.465145% |
| B | 2453 | 63 | 2.568284% |
| C | 2453 | 14 | 0.570730% |
| D | 2453 | 18 | 0.733795% |
Noise dominated data is calculated using 1-second bins in cleaned event files. If a bin has >2000 counts, and if more than 50% of those come from <1% of pixels, then it is considered to be noise-dominated and hence unusable.
| Quadrant | # 1 sec bins | Bins with >0 counts | Bins with >2000 counts | High rate bins dominated by noise | Noise dominated (total time) | Noise dominated (detector-on time) | Marked lightcurve |
|---|---|---|---|---|---|---|---|
| A | 2843 | 2454 | 25 | 25 | 0.88% | 1.02% | 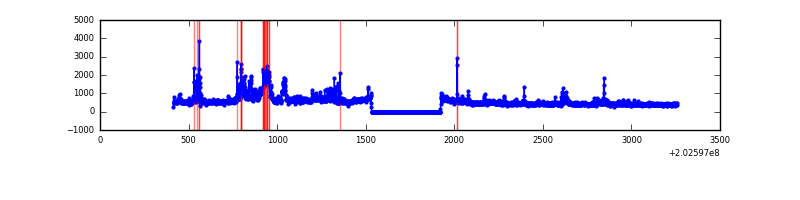 |
| B | 2843 | 2454 | 12 | 12 | 0.42% | 0.49% | 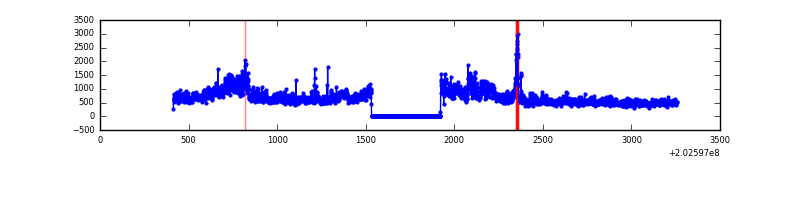 |
| C | 2843 | 2454 | 3 | 3 | 0.11% | 0.12% | 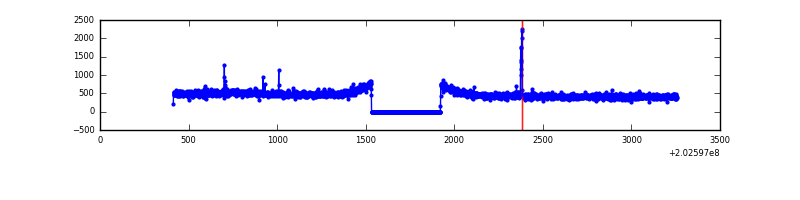 |
| D | 2843 | 2454 | 7 | 7 | 0.25% | 0.29% | 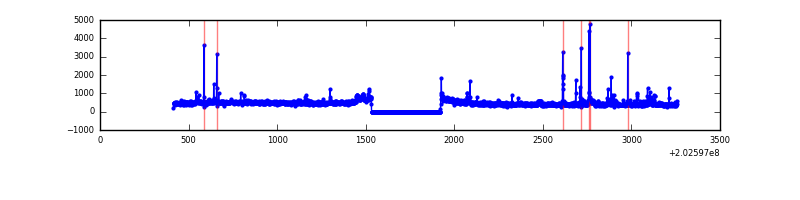 |
Top three noisy pixels from each quadrant. If the there are fewer than three noisy pixels in the level2.evt file, extra rows are filled as -1
| Pixel properties | Quadrant properties | ||||||
|---|---|---|---|---|---|---|---|
| Quadrant | DetID | PixID | Counts | Sigma | Mean | Median | Sigma |
| A | 0 | 118 | 185139 | 2933.07 | 294 | 286 | 63.0 |
| A | 13 | 251 | 117023 | 1852.27 | 294 | 286 | 63.0 |
| A | 0 | 50 | 29288 | 460.18 | 294 | 286 | 63.0 |
| B | 15 | 204 | 393175 | 6445.4 | 300 | 292 | 61.0 |
| B | 3 | 0 | 72987 | 1192.59 | 300 | 292 | 61.0 |
| B | 5 | 172 | 45831 | 747.09 | 300 | 292 | 61.0 |
| C | 1 | 16 | 16462 | 227.04 | 293 | 294 | 71.2 |
| C | 8 | 128 | 4619 | 60.73 | 293 | 294 | 71.2 |
| C | 13 | 61 | 2466 | 30.5 | 293 | 294 | 71.2 |
| D | 10 | 187 | 39010 | 536.03 | 292 | 283 | 72.2 |
| D | 2 | 37 | 23433 | 320.42 | 292 | 283 | 72.2 |
| D | 5 | 233 | 18545 | 252.77 | 292 | 283 | 72.2 |
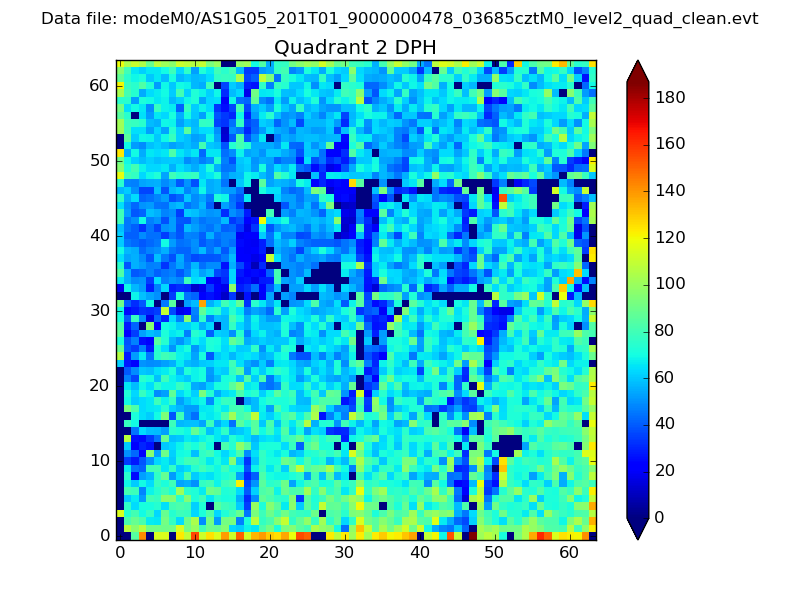
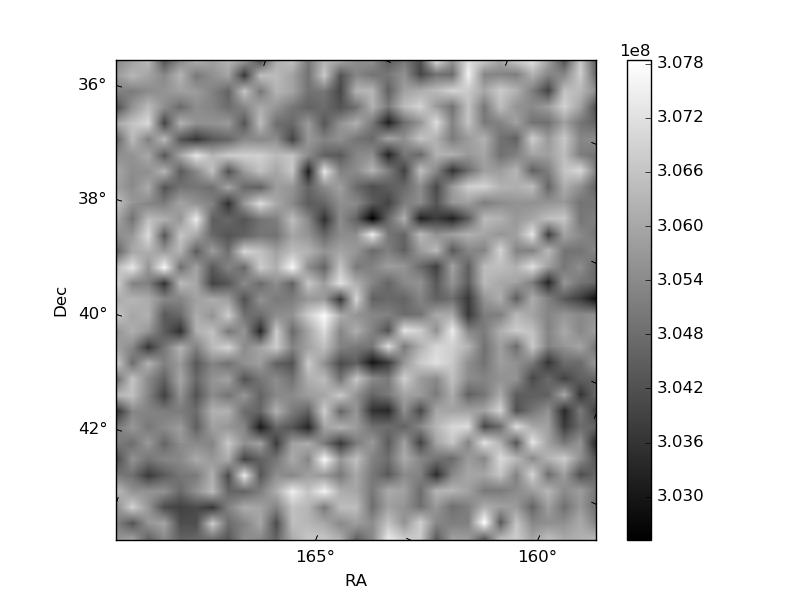
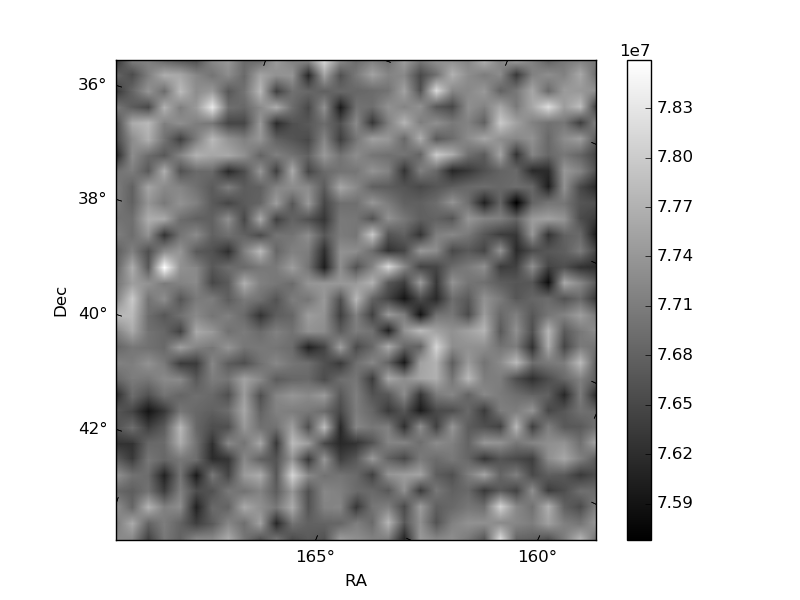
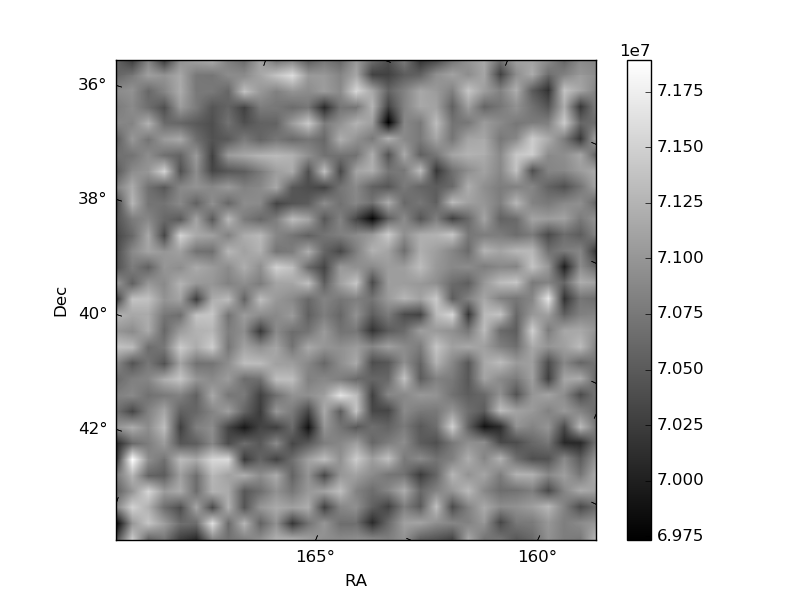
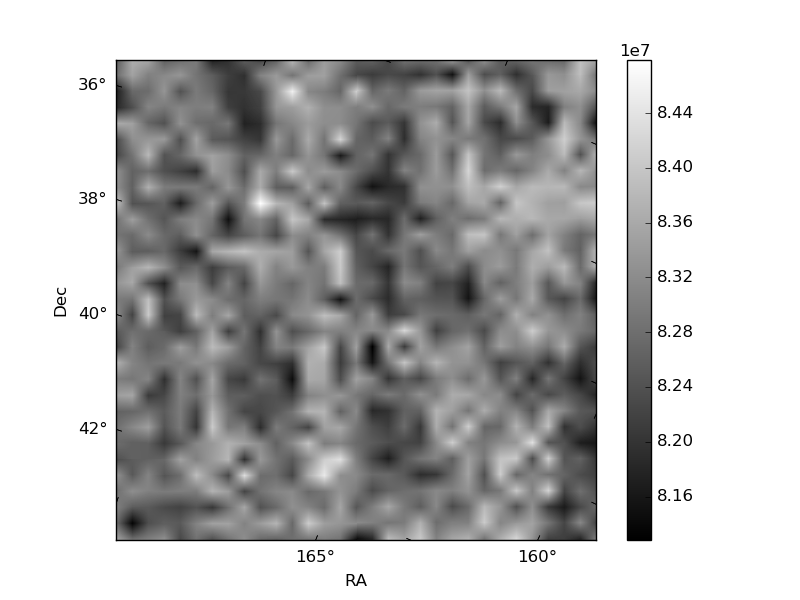
Histogram calculated using DETX and DETY for each event in the final _common_clean file
| Quadrant A | 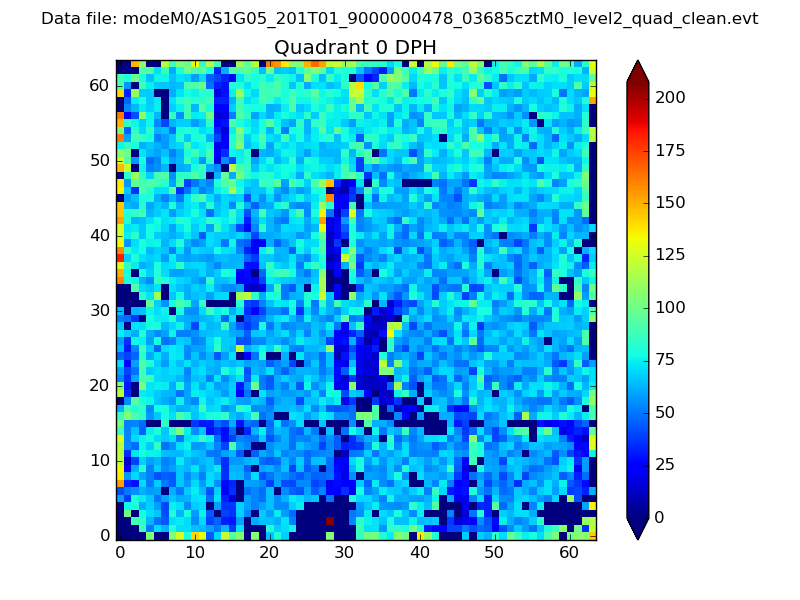 |
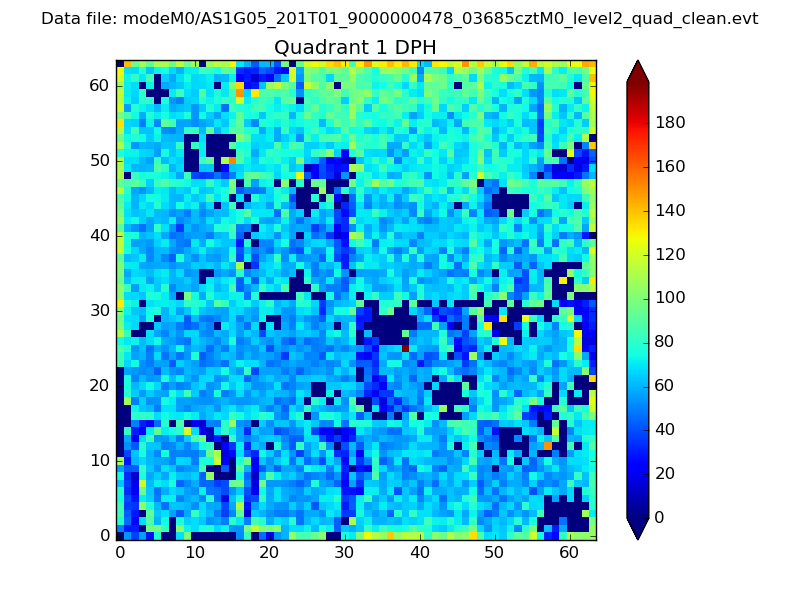 |
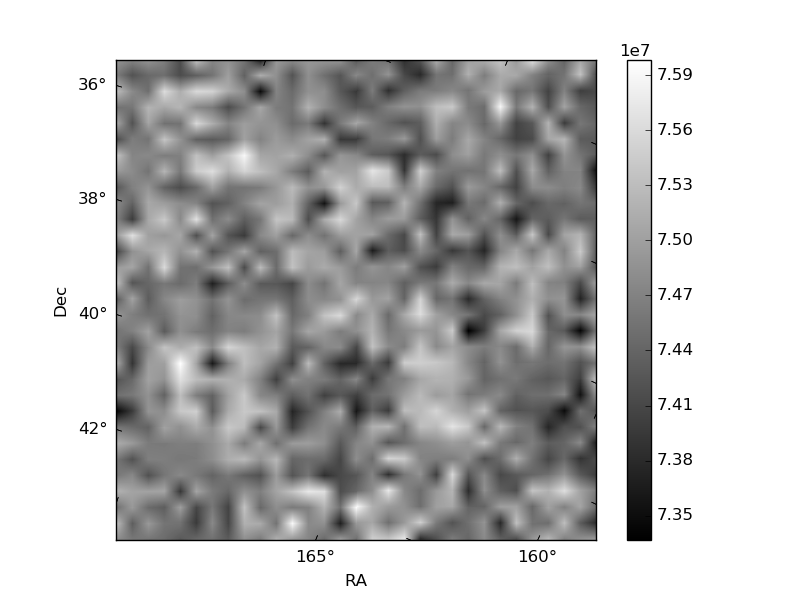
Quadrant B |
|---|---|---|---|
| Quadrant D | 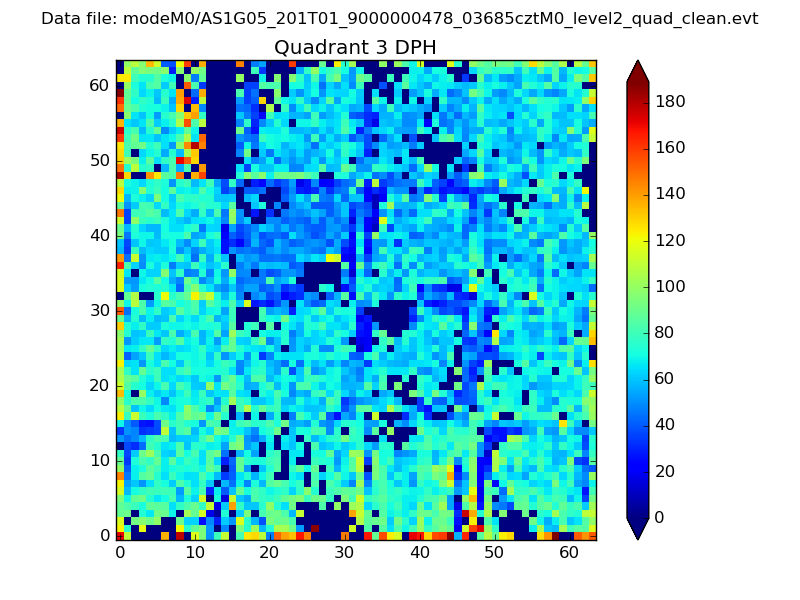 |
 |
Quadrant C |
| Plot type | Count rate plots | Images |
|---|---|---|
| Comparison with Poisson distribution Blue bars denote a histogram of data divided into 1 sec bins. Red curve is a Poisson curve with rate = median count rate of data. |
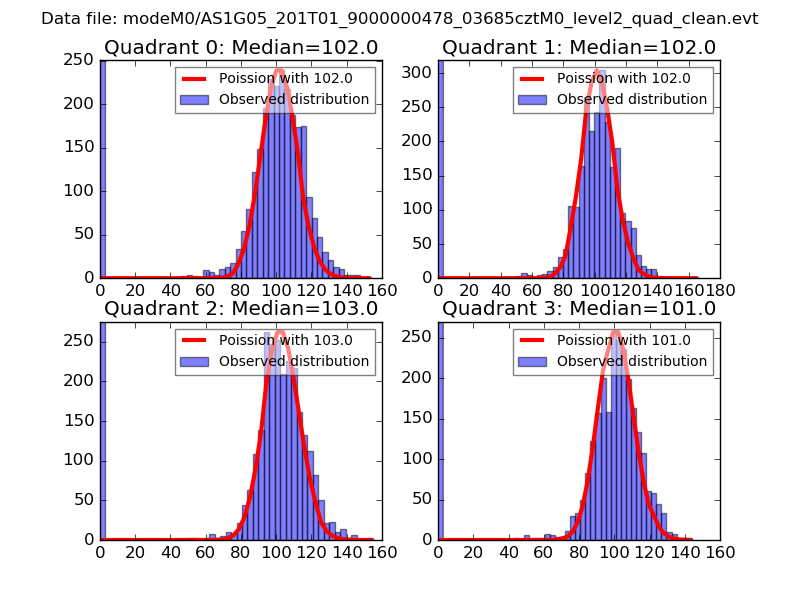 |
 |
| Quadrant-wise count rates Data is divided into 100 sec bins |
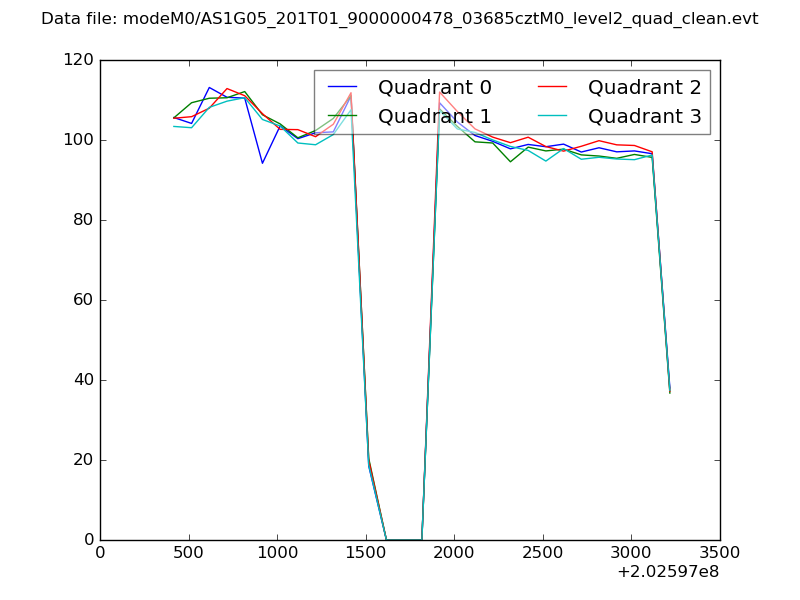 |
|
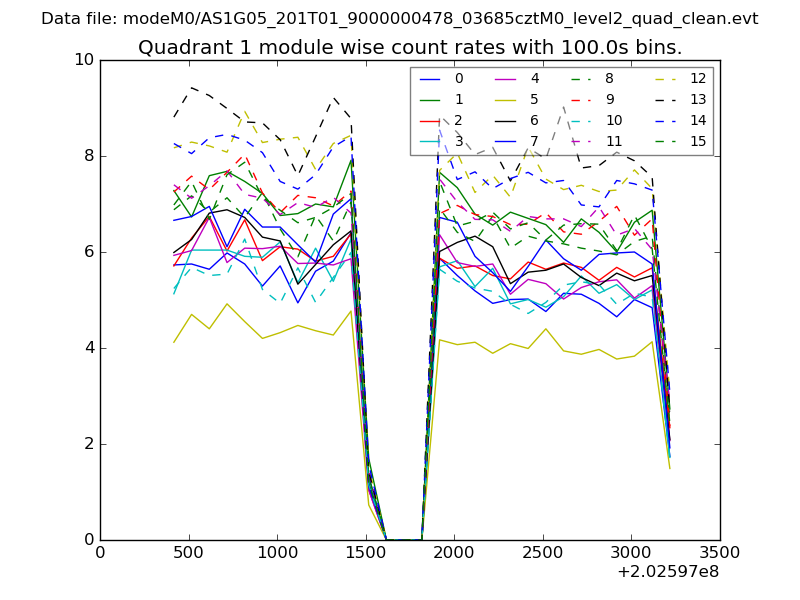
| Module-wise count rates for Quadrant A Data is divided into 100 sec bins |
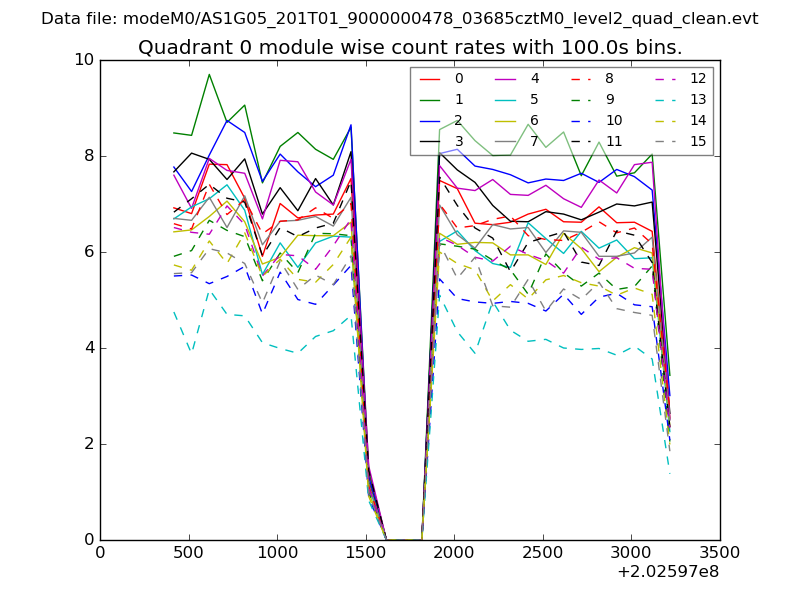 |
 |
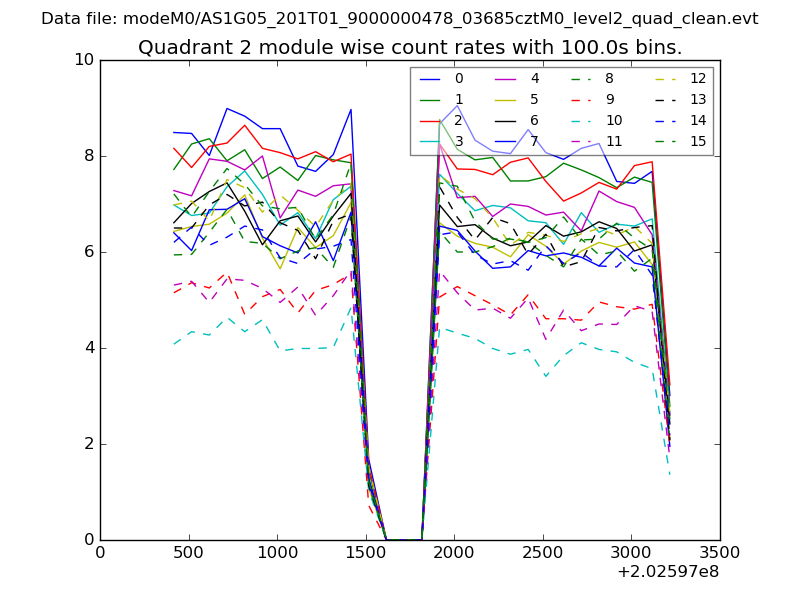
| Module-wise count rates for Quadrant B Data is divided into 100 sec bins |
 |
 |
| Module-wise count rates for Quadrant C Data is divided into 100 sec bins |
 |
 |
| Module-wise count rates for Quadrant D Data is divided into 100 sec bins |
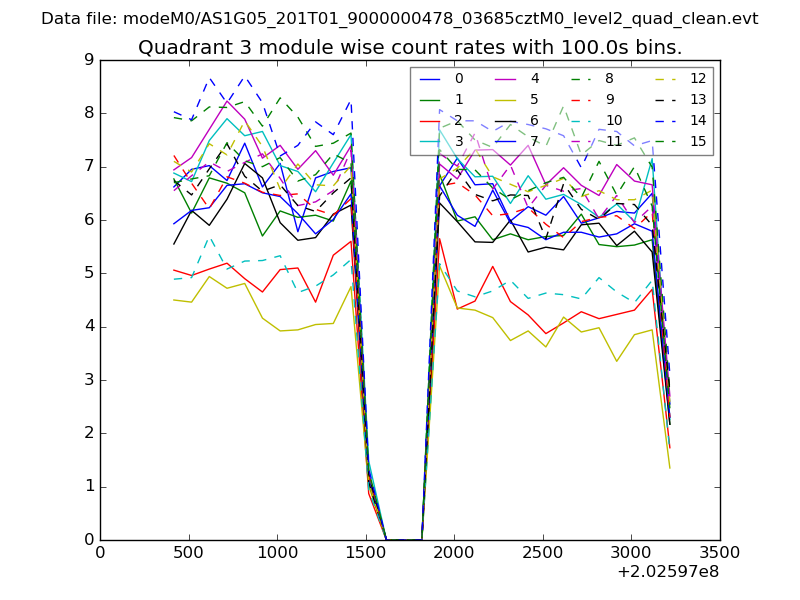 |
 |
| Parameter | Plot |
|---|---|
| CZT HV Monitor | 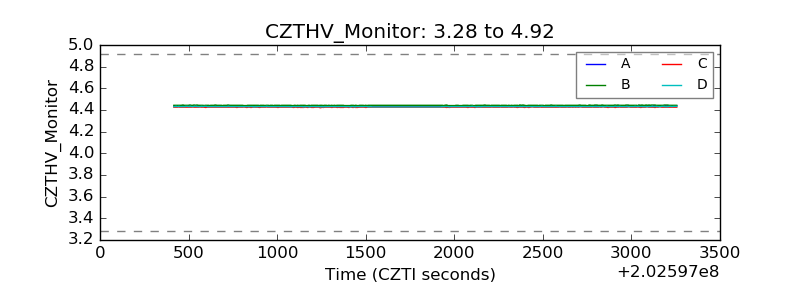 |
| D_VDD | 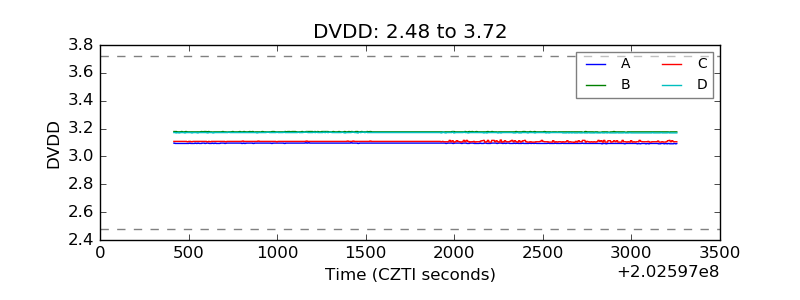 |
| Temperature 1 | 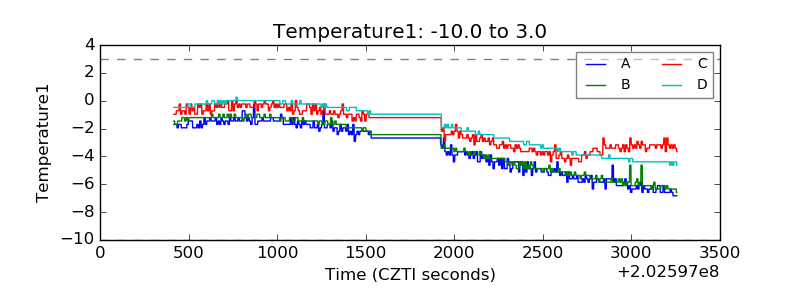 |
| Veto HV Monitor |  |
| Veto LLD | 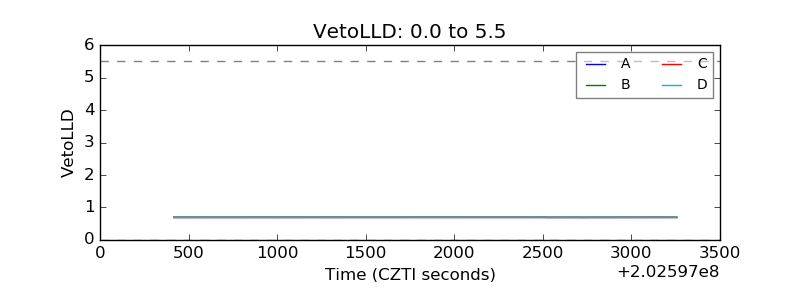 |
| Alpha Counter | 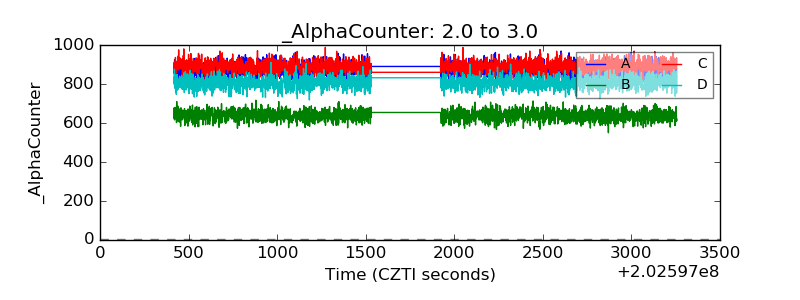 |
| _CPM_Rate | 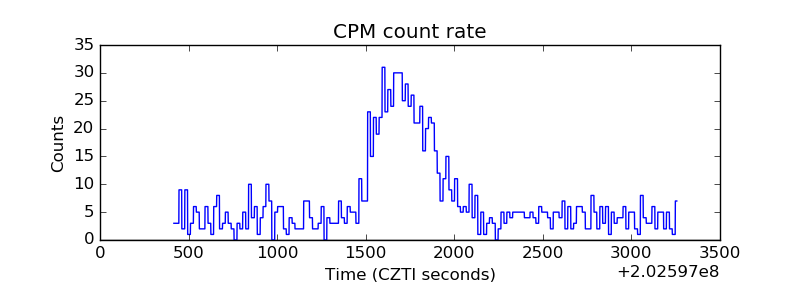 |
| CZT Counter | 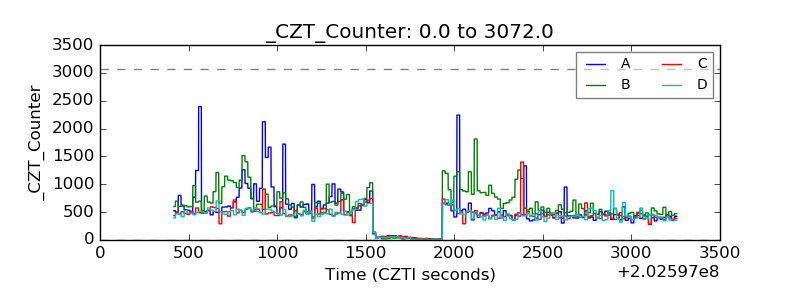 |
| +2.5 Volts monitor | 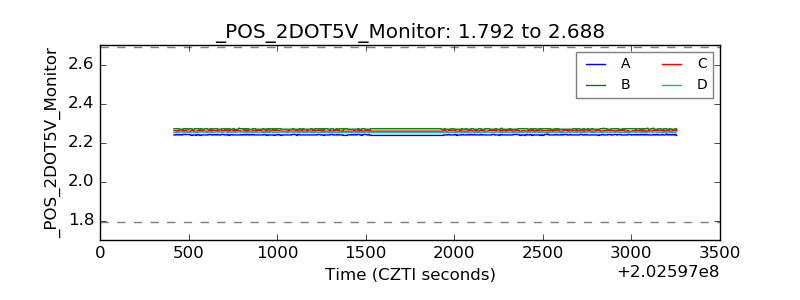 |
| +5 Volts monitor |  |
| Veto Counter | 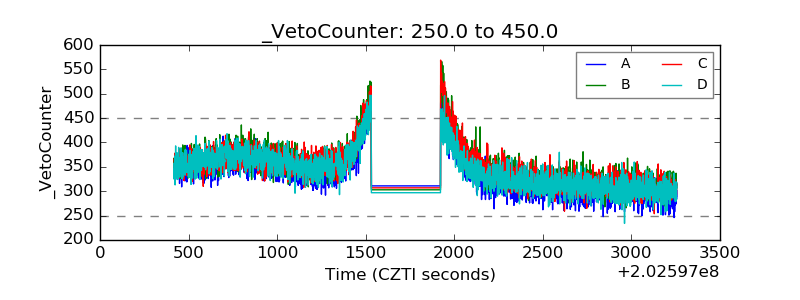 |