| Param | Original file | Final file |
|---|---|---|
| Filename | modeM0/AS1SLEW_01234_9000000477_03671cztM0_level2.evt | modeM0/AS1SLEW_01234_9000000477_03671cztM0_level2_quad_clean.evt |
| Size (bytes) | 14,333,760 | 3,254,400 |
| Size | 13.7 MB | 3.1 MB |
| Events in quadrant A | 106,382 | 19,305 |
| Events in quadrant B | 109,118 | 19,750 |
| Events in quadrant C | 104,531 | 20,184 |
| Events in quadrant D | 100,047 | 19,606 |
| Mode M0 | |||
|---|---|---|---|
| Quadrant | BADHDUFLAG | Total packets | Discarded packets |
| A | 0 | 415 | 0 |
| B | 0 | 428 | 0 |
| C | 0 | 416 | 0 |
| D | 0 | 399 | 0 |
| Mode SS | |||
|---|---|---|---|
| Quadrant | BADHDUFLAG | Total packets | Discarded packets |
| A | 0 | 6 | 0 |
| B | 0 | 6 | 0 |
| C | 0 | 6 | 0 |
| D | 0 | 6 | 0 |
| Mode M9 | |||
|---|---|---|---|
| Quadrant | BADHDUFLAG | Total packets | Discarded packets |
| A | 0 | 8 | 0 |
| B | 0 | 8 | 0 |
| C | 0 | 8 | 0 |
| D | 0 | 8 | 0 |
| Quadrant | Total seconds | Saturated seconds | Saturation percentage |
|---|---|---|---|
| A | 148 | 34 | 22.972973% |
| B | 148 | 36 | 24.324324% |
| C | 148 | 23 | 15.540541% |
| D | 148 | 17 | 11.486486% |
Noise dominated data is calculated using 1-second bins in cleaned event files. If a bin has >2000 counts, and if more than 50% of those come from <1% of pixels, then it is considered to be noise-dominated and hence unusable.
| Quadrant | # 1 sec bins | Bins with >0 counts | Bins with >2000 counts | High rate bins dominated by noise | Noise dominated (total time) | Noise dominated (detector-on time) | Marked lightcurve |
|---|---|---|---|---|---|---|---|
| A | 148 | 148 | 0 | 0 | 0.00% | 0.00% | 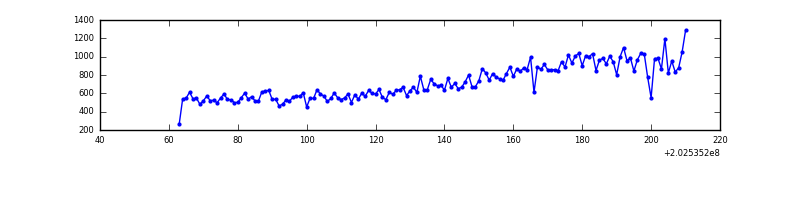 |
| B | 148 | 148 | 0 | 0 | 0.00% | 0.00% | 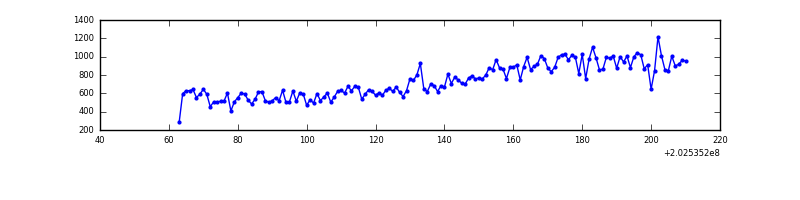 |
| C | 148 | 148 | 0 | 0 | 0.00% | 0.00% | 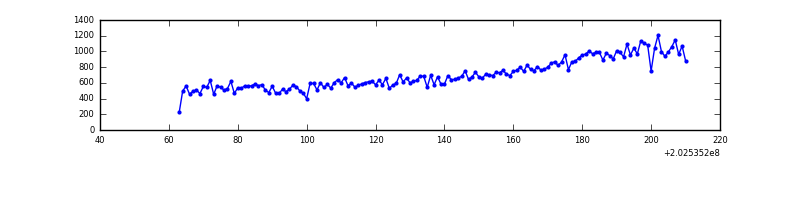 |
| D | 148 | 148 | 0 | 0 | 0.00% | 0.00% | 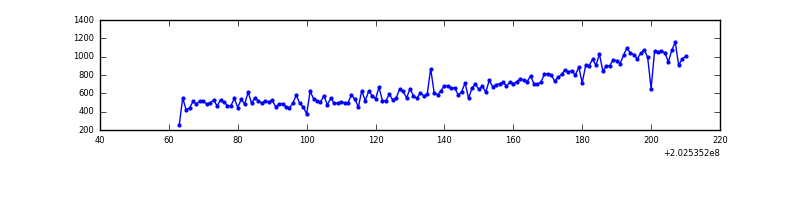 |
Top three noisy pixels from each quadrant. If the there are fewer than three noisy pixels in the level2.evt file, extra rows are filled as -1
| Pixel properties | Quadrant properties | ||||||
|---|---|---|---|---|---|---|---|
| Quadrant | DetID | PixID | Counts | Sigma | Mean | Median | Sigma |
| A | 13 | 164 | 4253 | 547.31 | 26 | 25 | 7.7 |
| A | 0 | 50 | 478 | 58.64 | 26 | 25 | 7.7 |
| A | 13 | 14 | 445 | 54.37 | 26 | 25 | 7.7 |
| B | 15 | 204 | 6208 | 803.19 | 26 | 25 | 7.7 |
| B | 14 | 167 | 637 | 79.5 | 26 | 25 | 7.7 |
| B | 12 | 111 | 469 | 57.68 | 26 | 25 | 7.7 |
| C | 9 | 247 | 434 | 47.9 | 26 | 26 | 8.5 |
| C | 13 | 61 | 219 | 22.66 | 26 | 26 | 8.5 |
| C | 3 | 202 | 75 | 5.75 | 26 | 26 | 8.5 |
| D | 14 | 226 | 294 | 31.01 | 26 | 25 | 8.7 |
| D | 0 | 56 | 94 | 7.95 | 26 | 25 | 8.7 |
| D | 0 | 105 | 92 | 7.72 | 26 | 25 | 8.7 |
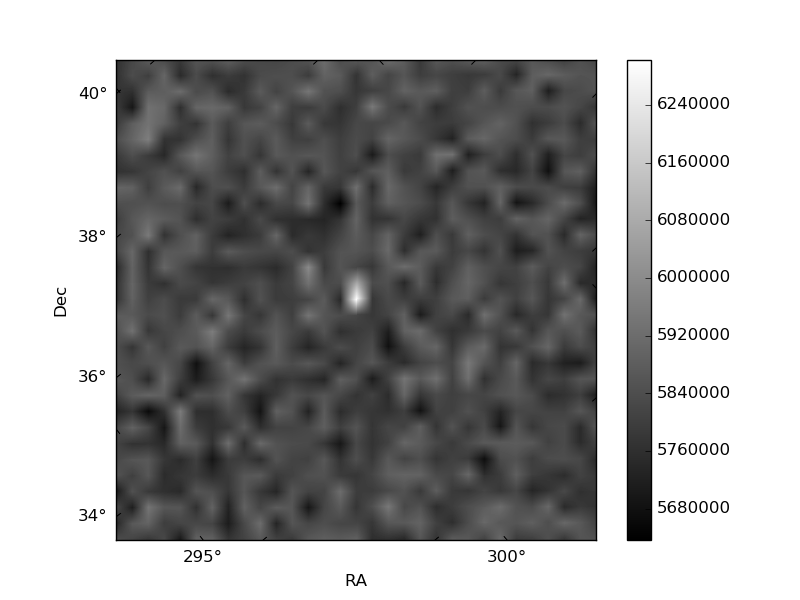
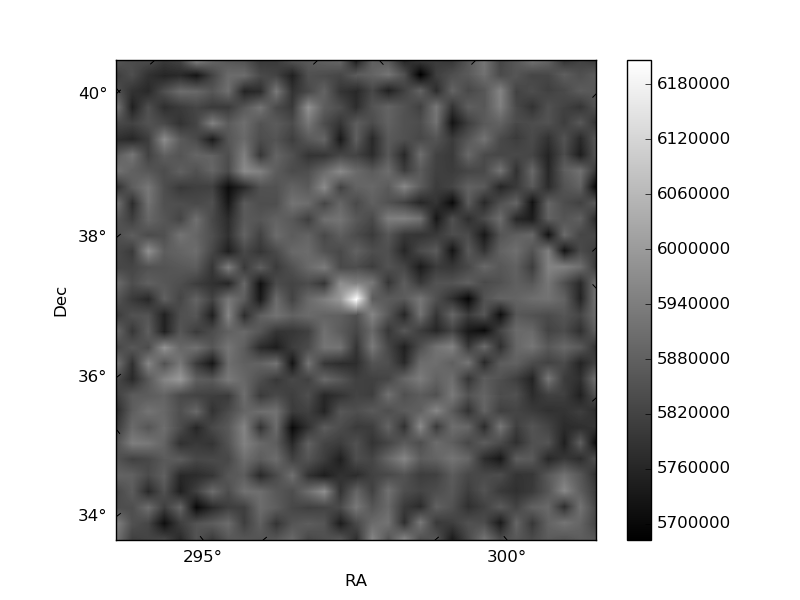
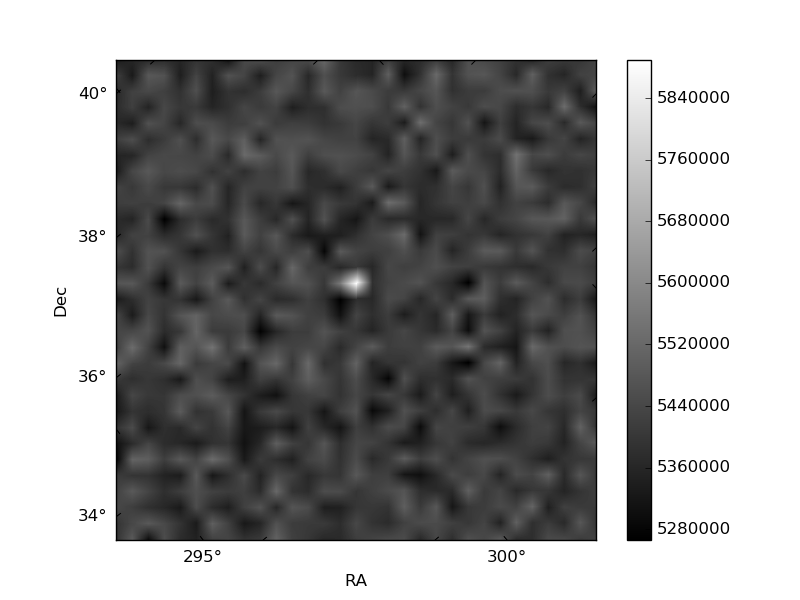
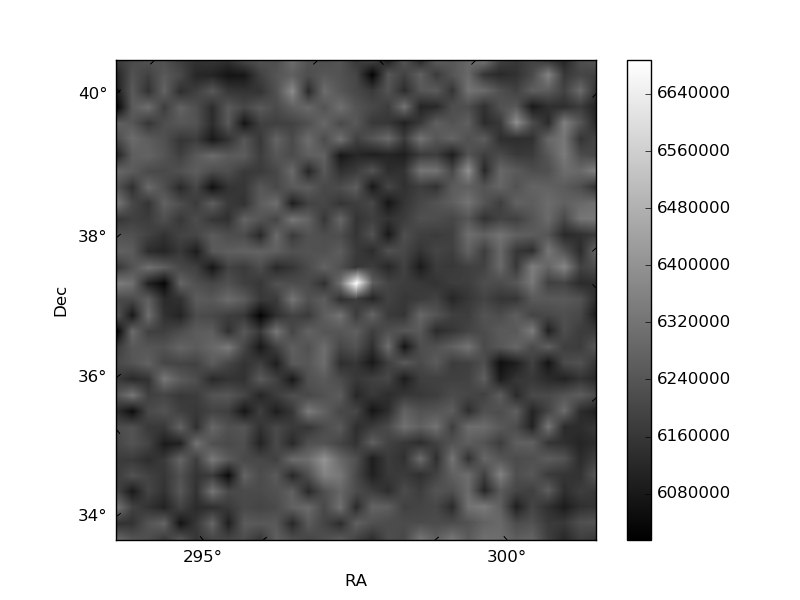
Histogram calculated using DETX and DETY for each event in the final _common_clean file
| Quadrant A | 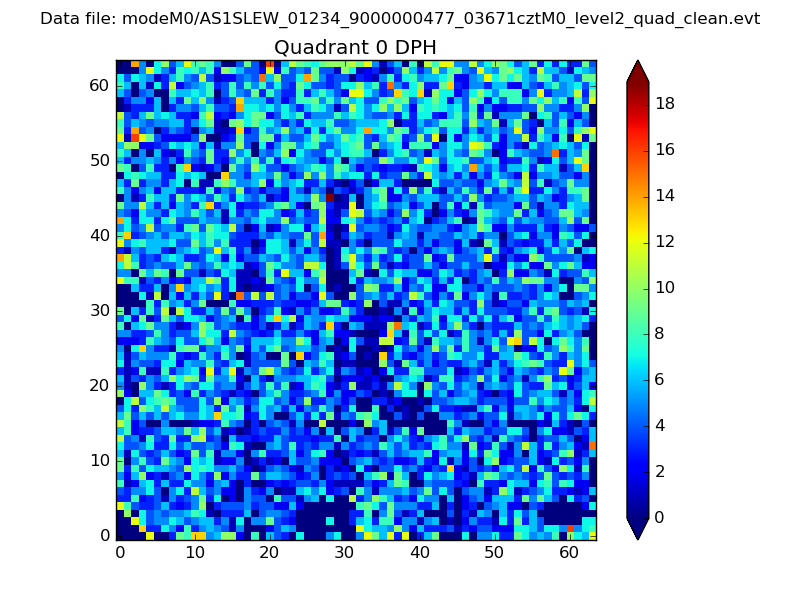 |
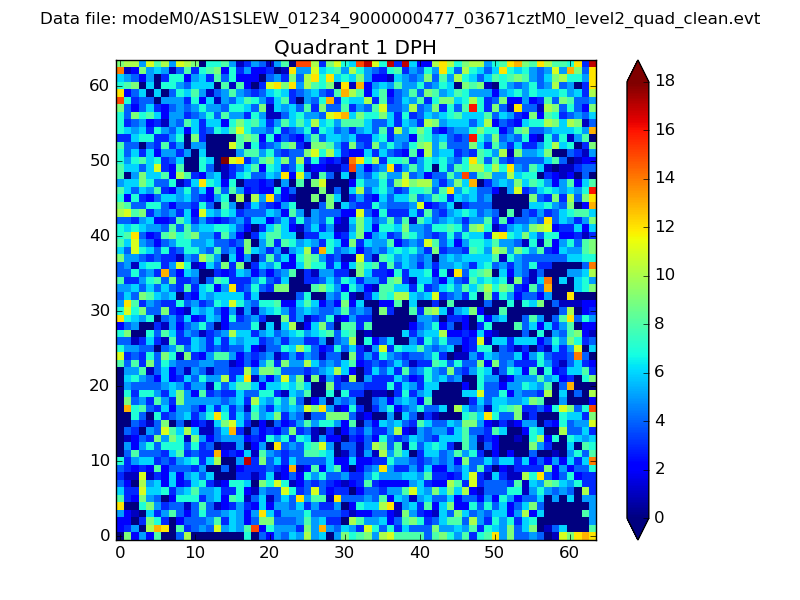 |
Quadrant B |
|---|---|---|---|
| Quadrant D | 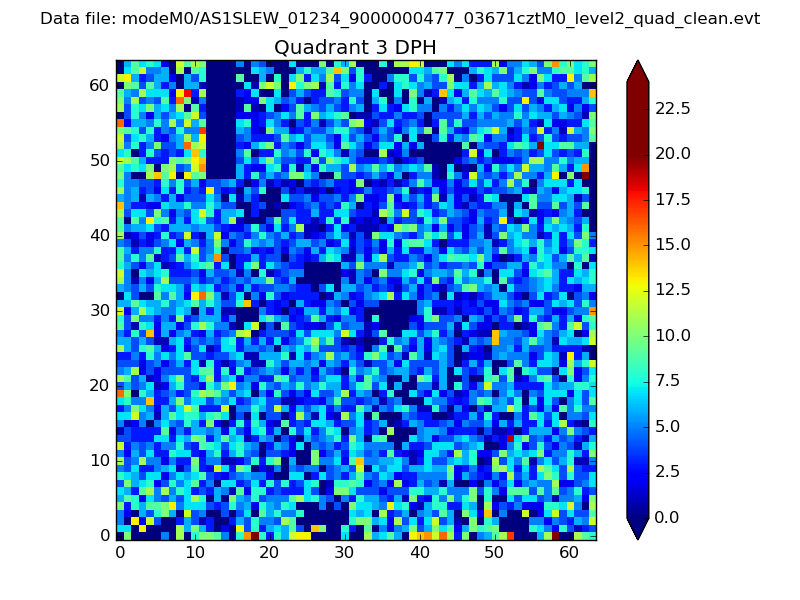 |
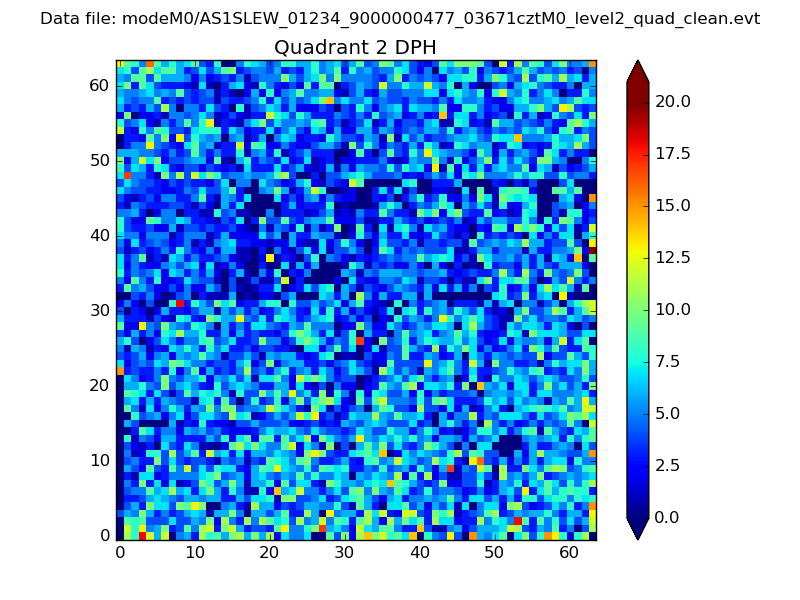 |
Quadrant C |
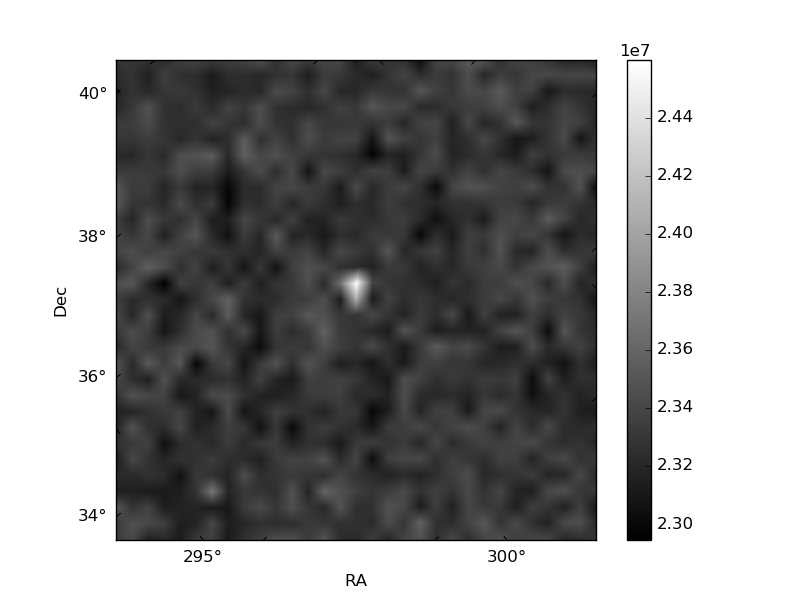
| Plot type | Count rate plots | Images |
|---|---|---|
| Comparison with Poisson distribution Blue bars denote a histogram of data divided into 1 sec bins. Red curve is a Poisson curve with rate = median count rate of data. |
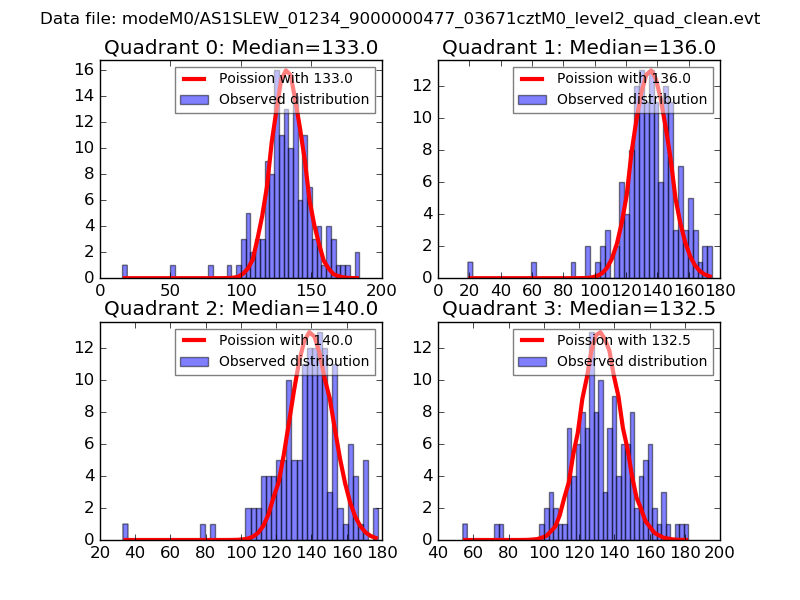 |
 |
| Quadrant-wise count rates Data is divided into 100 sec bins |
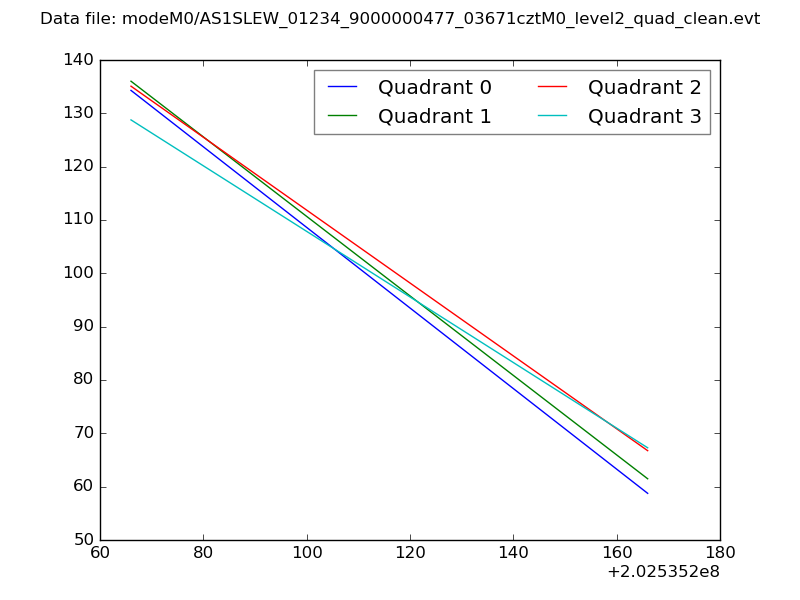 |
|
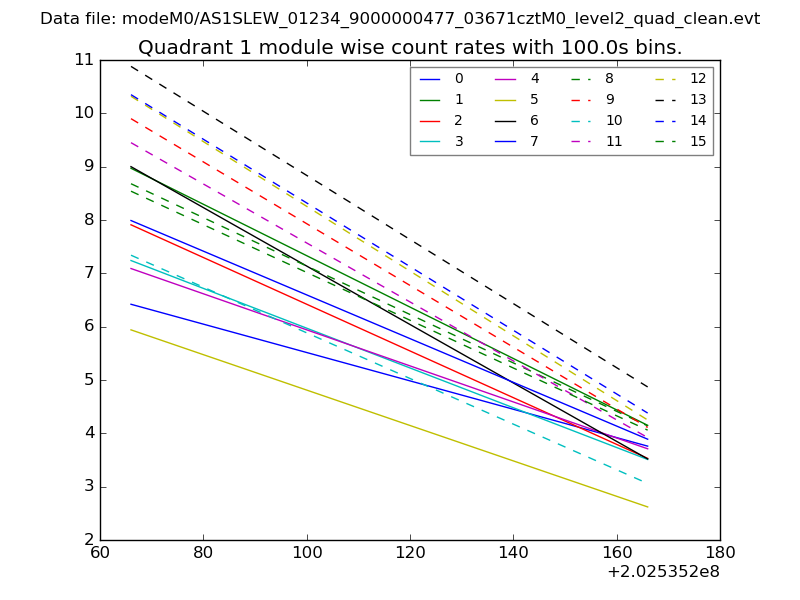
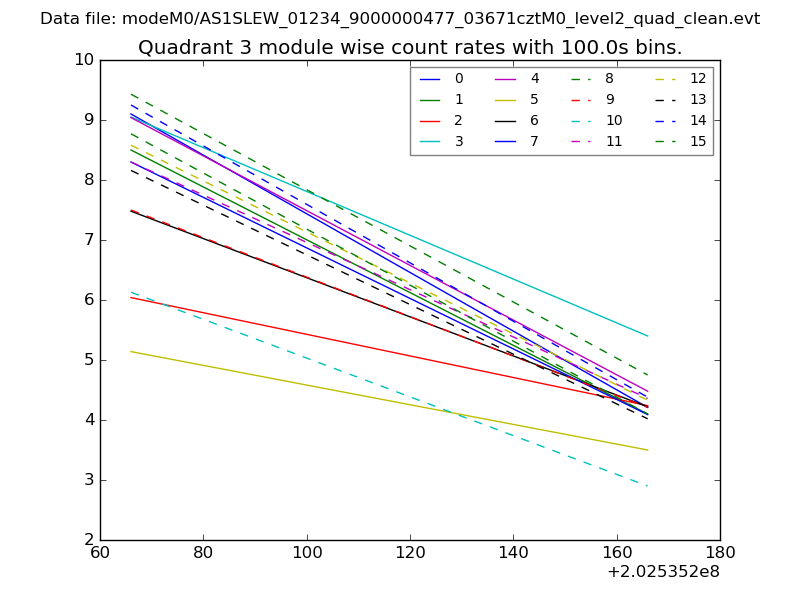
| Module-wise count rates for Quadrant A Data is divided into 100 sec bins |
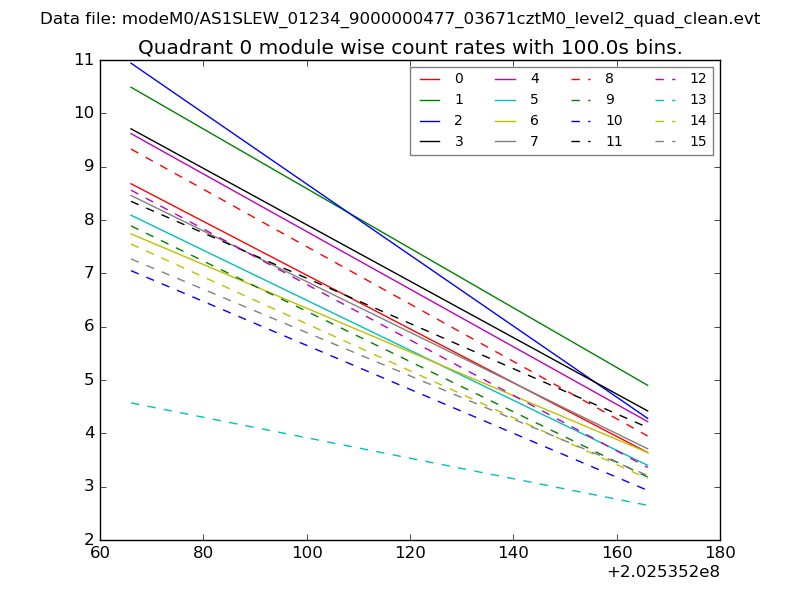 |
 |
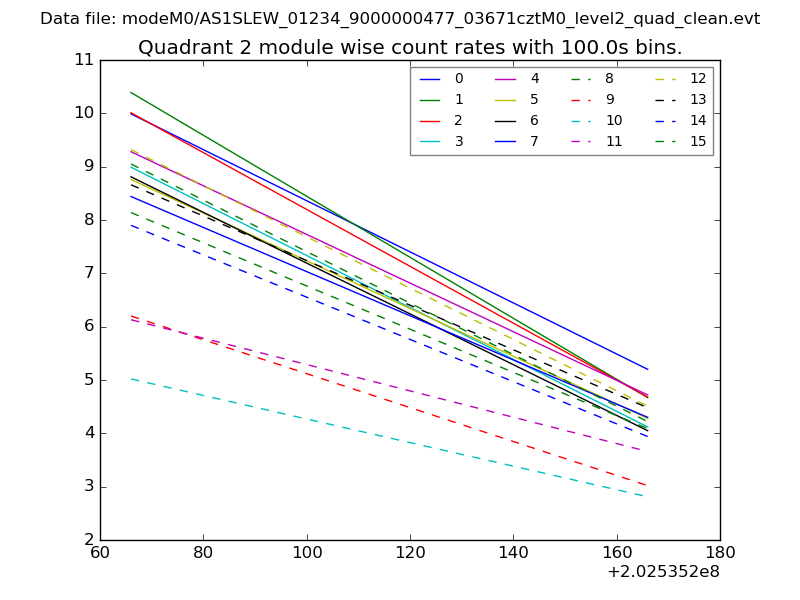
| Module-wise count rates for Quadrant B Data is divided into 100 sec bins |
 |
 |
| Module-wise count rates for Quadrant C Data is divided into 100 sec bins |
 |
 |
| Module-wise count rates for Quadrant D Data is divided into 100 sec bins |
 |
 |
| Parameter | Plot |
|---|---|
| CZT HV Monitor | 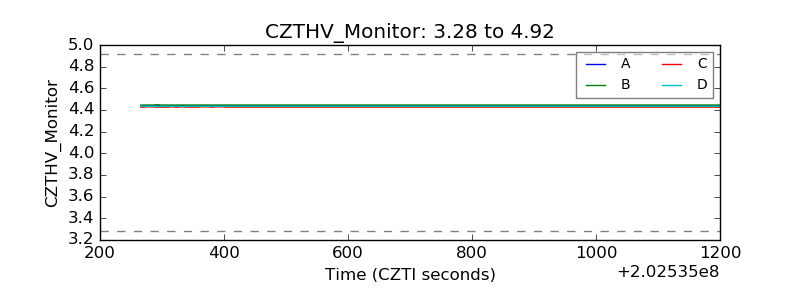 |
| D_VDD | 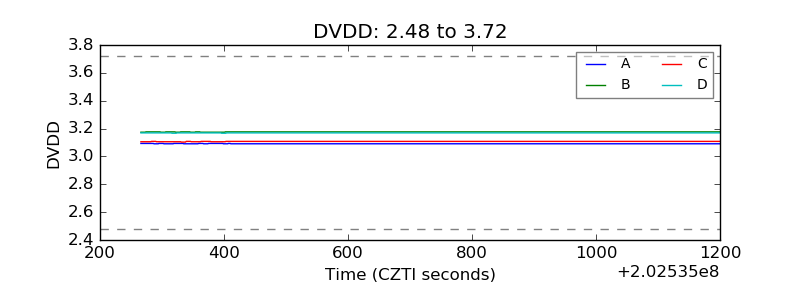 |
| Temperature 1 | 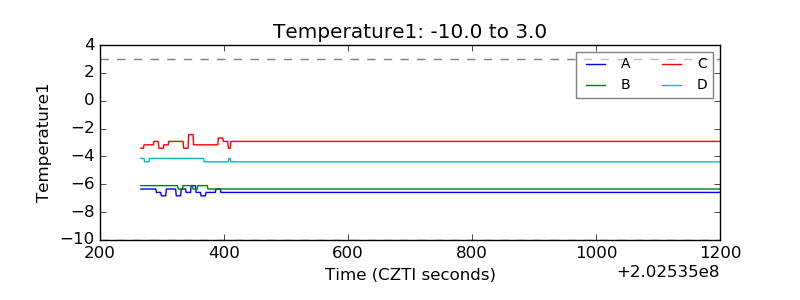 |
| Veto HV Monitor | 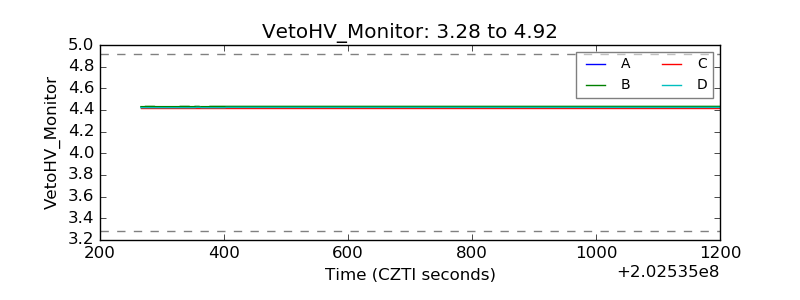 |
| Veto LLD | 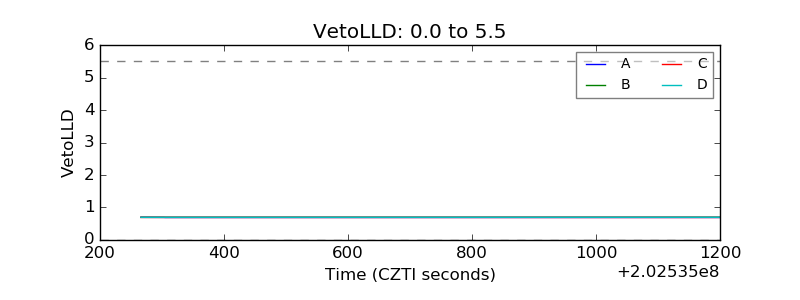 |
| Alpha Counter | 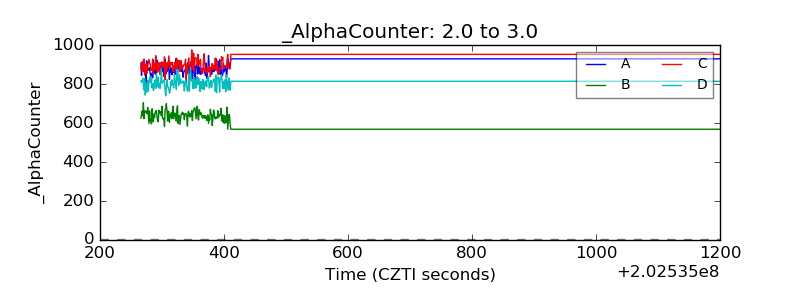 |
| _CPM_Rate | 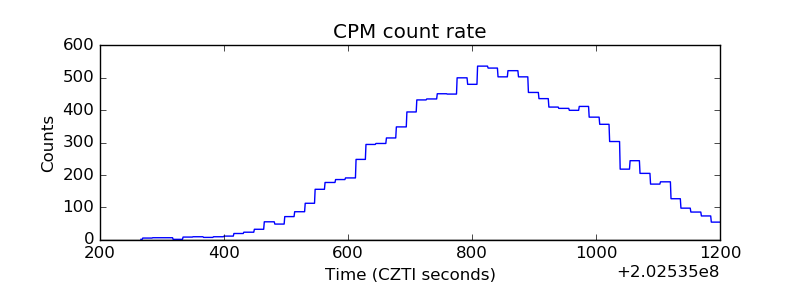 |
| CZT Counter | 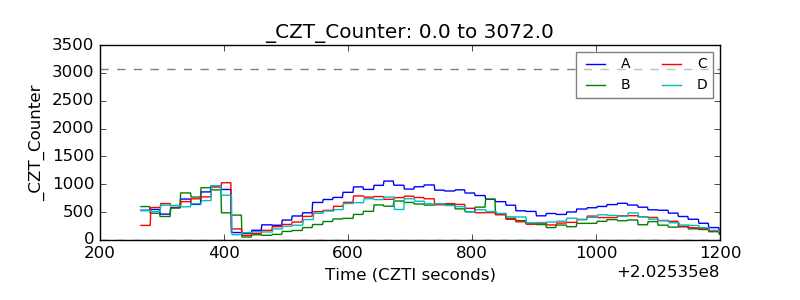 |
| +2.5 Volts monitor |  |
| +5 Volts monitor |  |
| Veto Counter | 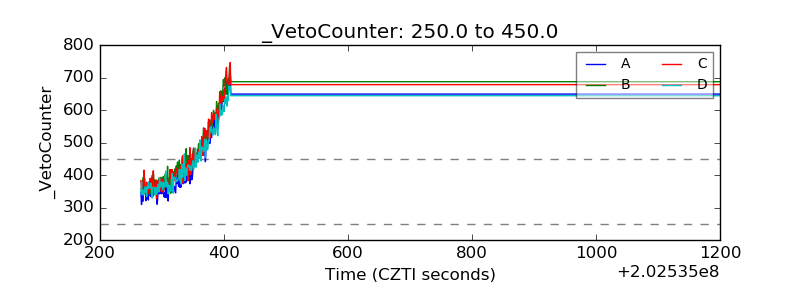 |