| Param | Original file | Final file |
|---|---|---|
| Filename | modeM0/AS1G05_009T01_9000000482cztM0_level2.fits | modeM0/AS1G05_009T01_9000000482cztM0_level2_quad_clean.evt |
| Size (bytes) | 866,188,800 | 946,526,400 |
| Size | 826.1 MB | 902.7 MB |
| Events in quadrant A | 5,080,254 | 5,601,161 |
| Events in quadrant B | 4,991,442 | 5,736,236 |
| Events in quadrant C | 5,161,712 | 5,609,458 |
| Events in quadrant D | 4,460,794 | 5,187,104 |
| Mode M9 | |||
|---|---|---|---|
| Quadrant | BADHDUFLAG | Total packets | Discarded packets |
| A | 0 | 129 | 0 |
| B | 0 | 129 | 0 |
| C | 0 | 129 | 0 |
| D | 0 | 129 | 0 |
| Mode SS | |||
|---|---|---|---|
| Quadrant | BADHDUFLAG | Total packets | Discarded packets |
| A | 0 | 1942 | 0 |
| B | 0 | 1942 | 0 |
| C | 0 | 1942 | 0 |
| D | 0 | 1942 | 0 |
| Mode M0 | |||
|---|---|---|---|
| Quadrant | BADHDUFLAG | Total packets | Discarded packets |
| A | 0 | 238348 | 0 |
| B | 0 | 256562 | 0 |
| C | 0 | 199708 | 0 |
| D | 0 | 221197 | 0 |
| Quadrant | Total seconds | Saturated seconds | Saturation percentage |
|---|---|---|---|
| A | 95319 | 6061 | 6.358648% |
| B | 95319 | 4218 | 4.425141% |
| C | 95319 | 1206 | 1.265225% |
| D | 95318 | 2319 | 2.432909% |
Noise dominated data is calculated using 1-second bins in cleaned event files. If a bin has >2000 counts, and if more than 50% of those come from <1% of pixels, then it is considered to be noise-dominated and hence unusable.
| Quadrant | # 1 sec bins | Bins with >0 counts | Bins with >2000 counts | High rate bins dominated by noise | Noise dominated (total time) | Noise dominated (detector-on time) | Marked lightcurve |
|---|---|---|---|---|---|---|---|
| A | 113326 | 95092 | 0 | 0 | 0.00% | 0.00% |  |
| B | 113326 | 95315 | 0 | 0 | 0.00% | 0.00% |  |
| C | 113326 | 95314 | 0 | 0 | 0.00% | 0.00% | 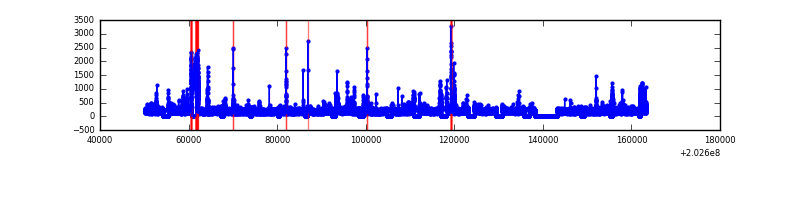 |
| D | 113326 | 95258 | 0 | 0 | 0.00% | 0.00% | 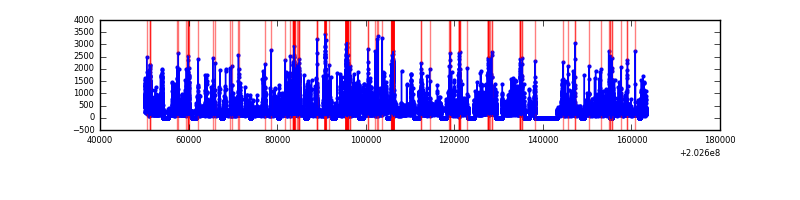 |
Top three noisy pixels from each quadrant. If the there are fewer than three noisy pixels in the level2.evt file, extra rows are filled as -1
| Pixel properties | Quadrant properties | ||||||
|---|---|---|---|---|---|---|---|
| Quadrant | DetID | PixID | Counts | Sigma | Mean | Median | Sigma |
| A | 0 | 29 | 4988 | 11.0 | 1319 | 1227 | 341.9 |
| A | 7 | 110 | 4250 | 8.84 | 1319 | 1227 | 341.9 |
| A | 0 | 30 | 3933 | 7.91 | 1319 | 1227 | 341.9 |
| B | 2 | 9 | 4408 | 11.48 | 1319 | 1246 | 275.4 |
| B | 12 | 226 | 3637 | 8.68 | 1319 | 1246 | 275.4 |
| B | 5 | 128 | 3444 | 7.98 | 1319 | 1246 | 275.4 |
| C | 1 | 80 | 3725 | 6.71 | 1364 | 1256 | 367.8 |
| C | 1 | 81 | 3623 | 6.44 | 1364 | 1256 | 367.8 |
| C | 7 | 111 | 3533 | 6.19 | 1364 | 1256 | 367.8 |
| D | 11 | 82 | 3931 | 8.04 | 1273 | 1152 | 345.6 |
| D | 3 | 14 | 3333 | 6.31 | 1273 | 1152 | 345.6 |
| D | 6 | 83 | 3238 | 6.04 | 1273 | 1152 | 345.6 |
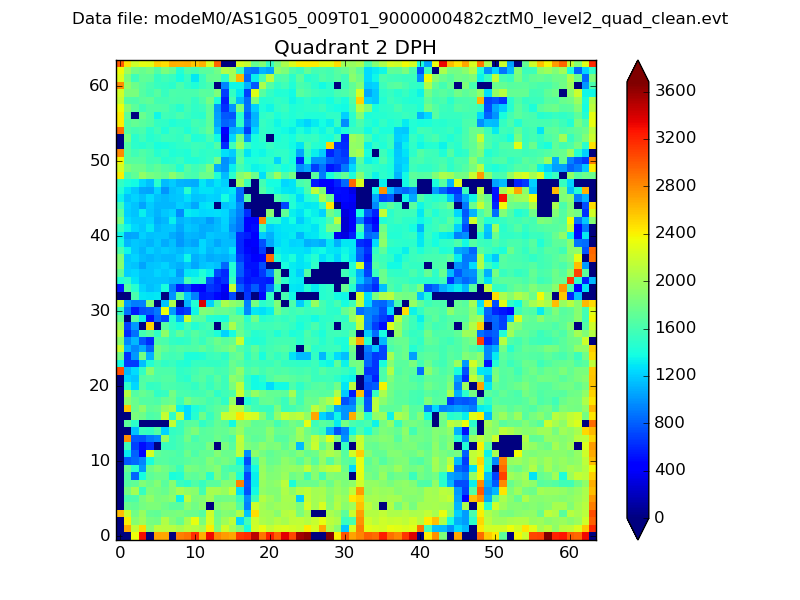
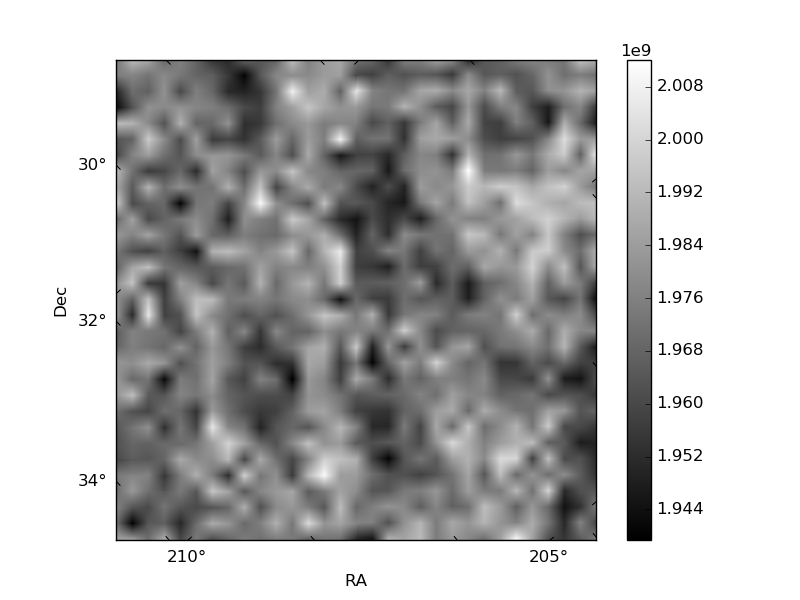
Histogram calculated using DETX and DETY for each event in the final _common_clean file
| Quadrant A | 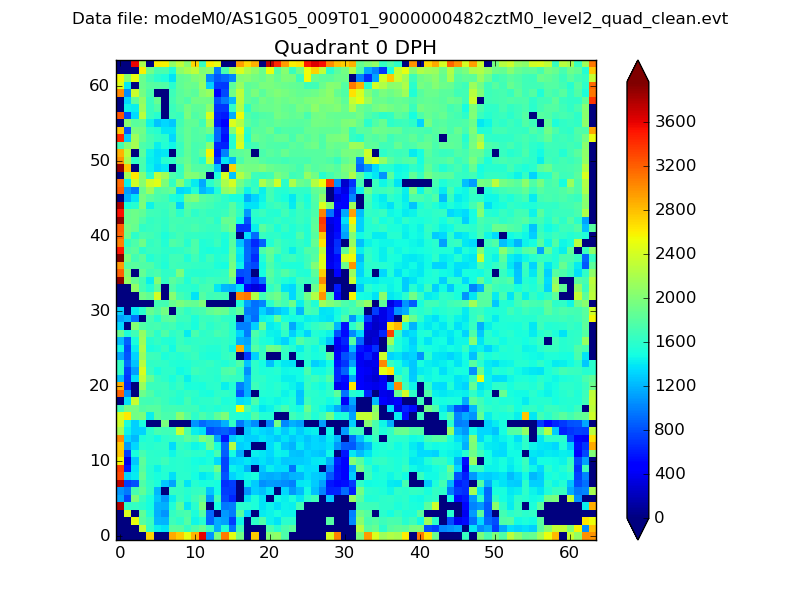 |
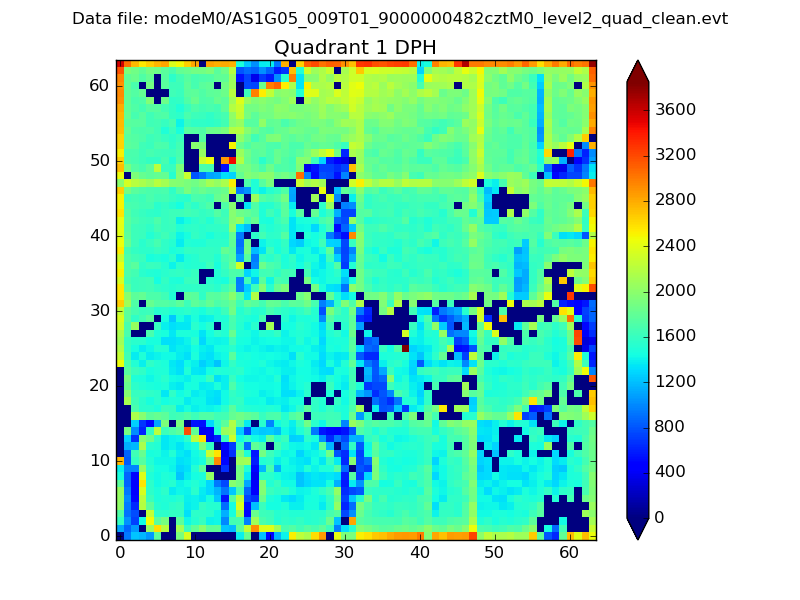 |
Quadrant B |
|---|---|---|---|
| Quadrant D | 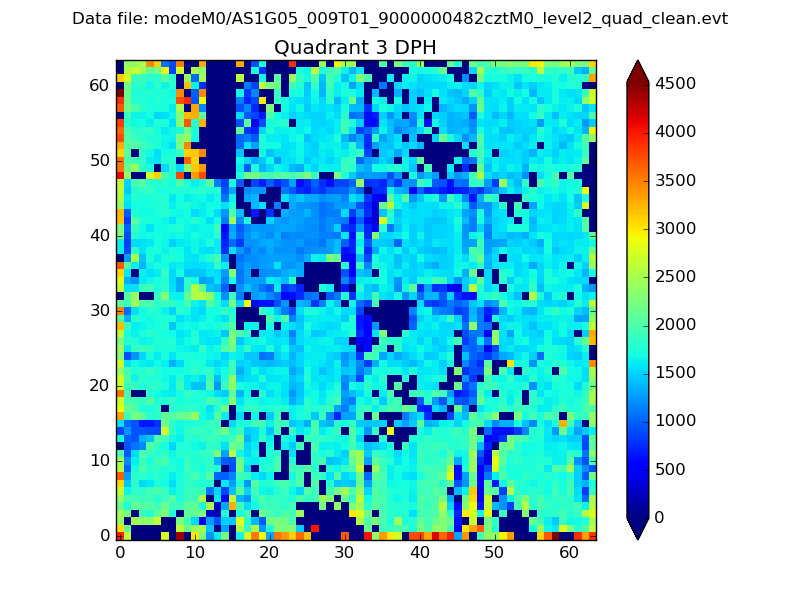 |
 |
Quadrant C |
| Plot type | Count rate plots | Images |
|---|---|---|
| Comparison with Poisson distribution Blue bars denote a histogram of data divided into 1 sec bins. Red curve is a Poisson curve with rate = median count rate of data. |
 |
 |
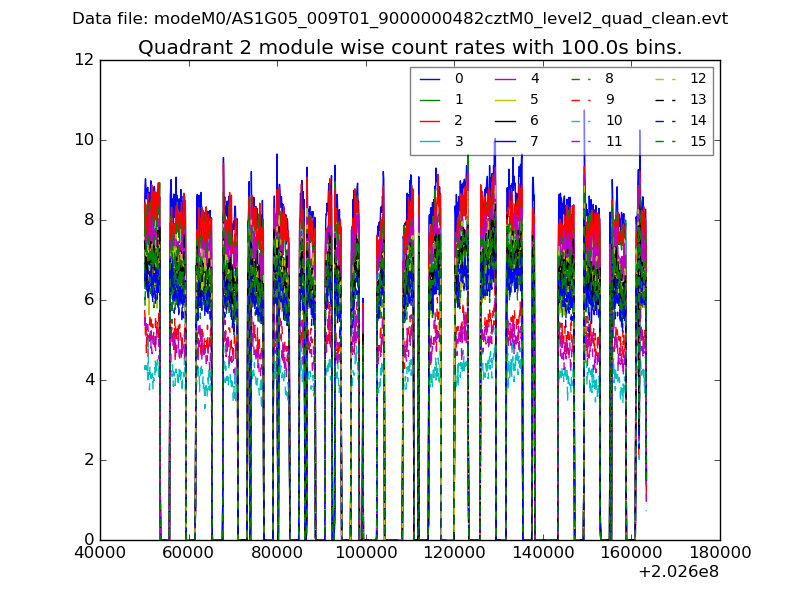
| Quadrant-wise count rates Data is divided into 100 sec bins |
 |
|
| Module-wise count rates for Quadrant A Data is divided into 100 sec bins |
 |
 |
| Module-wise count rates for Quadrant B Data is divided into 100 sec bins |
 |
 |
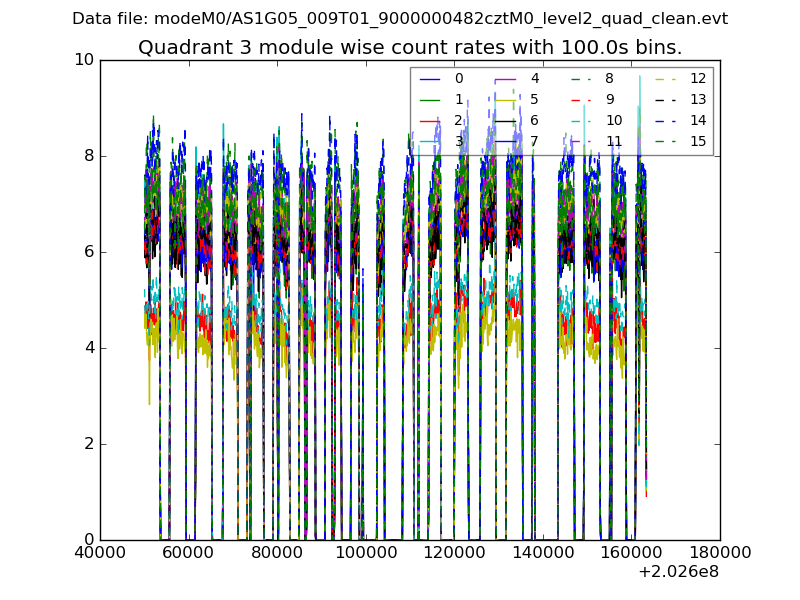
| Module-wise count rates for Quadrant C Data is divided into 100 sec bins |
 |
 |
| Module-wise count rates for Quadrant D Data is divided into 100 sec bins |
 |
 |
| Parameter | Plot |
|---|---|
| CZT HV Monitor |  |
| D_VDD |  |
| Temperature 1 | 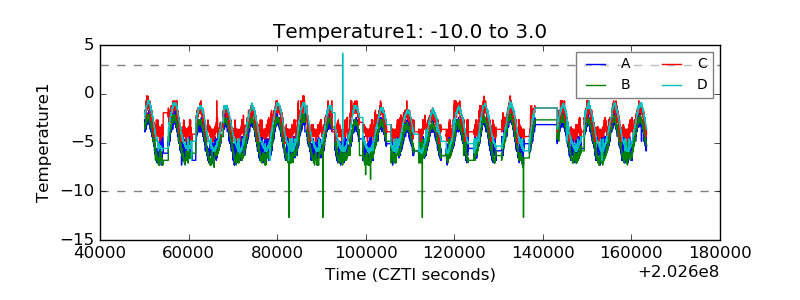 |
| Veto HV Monitor |  |
| Veto LLD | 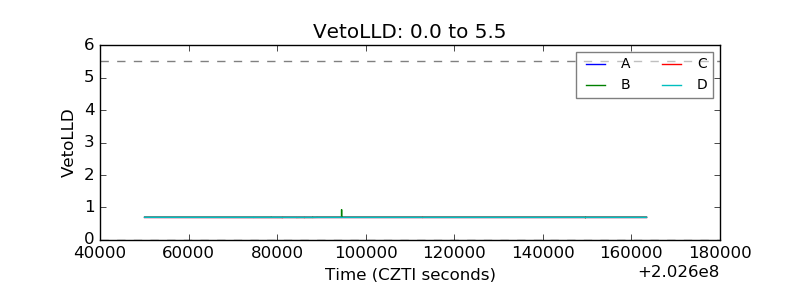 |
| Alpha Counter |  |
| _CPM_Rate |  |
| CZT Counter |  |
| +2.5 Volts monitor |  |
| +5 Volts monitor |  |
| _ROLL_ROT |  |
| _Roll_DEC |  |
| _Roll_RA | 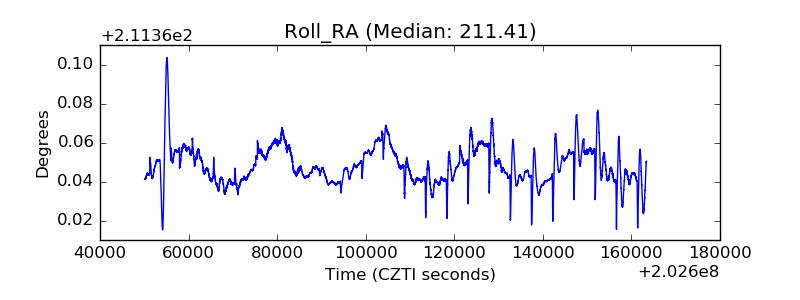 |
| Veto Counter | 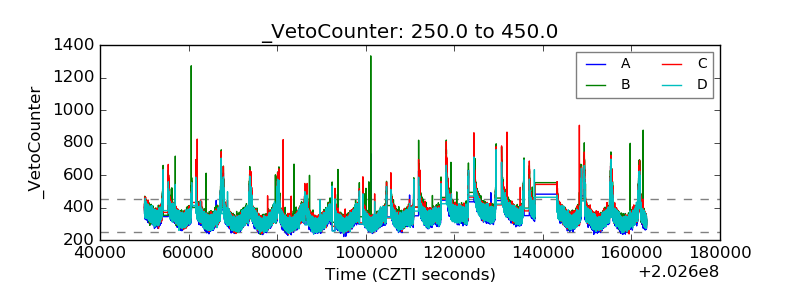 |