| Param | Original file | Final file |
|---|---|---|
| Filename | modeM0/AS1G05_009T01_9000000482_03692cztM0_level2.evt | modeM0/AS1G05_009T01_9000000482_03692cztM0_level2_quad_clean.evt |
| Size (bytes) | 451,474,560 | 79,649,280 |
| Size | 430.6 MB | 76.0 MB |
| Events in quadrant A | 3,094,133 | 512,542 |
| Events in quadrant B | 3,881,239 | 508,148 |
| Events in quadrant C | 2,726,730 | 504,226 |
| Events in quadrant D | 3,580,460 | 485,271 |
| Mode M9 | |||
|---|---|---|---|
| Quadrant | BADHDUFLAG | Total packets | Discarded packets |
| A | 0 | 12 | 0 |
| B | 0 | 12 | 0 |
| C | 0 | 12 | 0 |
| D | 0 | 12 | 0 |
| Mode SS | |||
|---|---|---|---|
| Quadrant | BADHDUFLAG | Total packets | Discarded packets |
| A | 0 | 116 | 0 |
| B | 0 | 116 | 0 |
| C | 0 | 116 | 0 |
| D | 0 | 116 | 0 |
| Mode M0 | |||
|---|---|---|---|
| Quadrant | BADHDUFLAG | Total packets | Discarded packets |
| A | 0 | 12864 | 2 |
| B | 0 | 15551 | 1 |
| C | 0 | 11917 | 1 |
| D | 0 | 14681 | 1 |
| Quadrant | Total seconds | Saturated seconds | Saturation percentage |
|---|---|---|---|
| A | 5750 | 135 | 2.347826% |
| B | 5750 | 166 | 2.886957% |
| C | 5750 | 85 | 1.478261% |
| D | 5750 | 216 | 3.756522% |
Noise dominated data is calculated using 1-second bins in cleaned event files. If a bin has >2000 counts, and if more than 50% of those come from <1% of pixels, then it is considered to be noise-dominated and hence unusable.
| Quadrant | # 1 sec bins | Bins with >0 counts | Bins with >2000 counts | High rate bins dominated by noise | Noise dominated (total time) | Noise dominated (detector-on time) | Marked lightcurve |
|---|---|---|---|---|---|---|---|
| A | 6895 | 5750 | 20 | 20 | 0.29% | 0.35% | 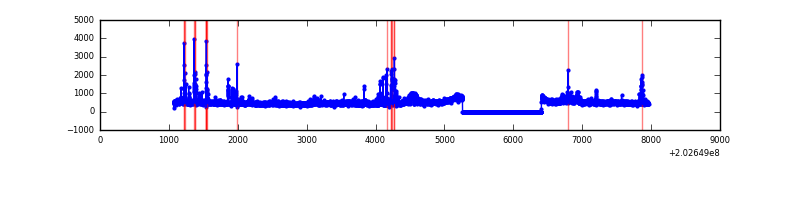 |
| B | 6895 | 5751 | 41 | 41 | 0.59% | 0.71% | 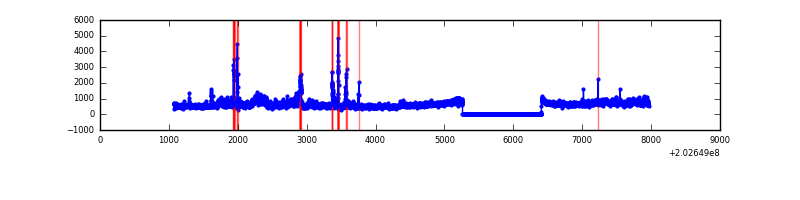 |
| C | 6895 | 5751 | 0 | 0 | 0.00% | 0.00% | 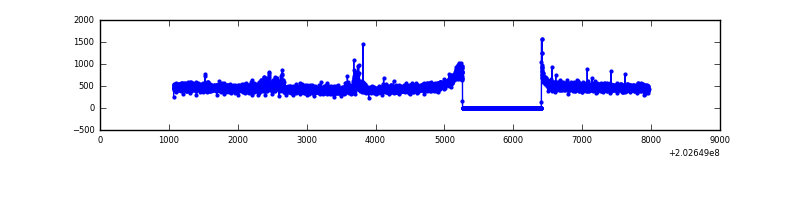 |
| D | 6895 | 5751 | 108 | 108 | 1.57% | 1.88% | 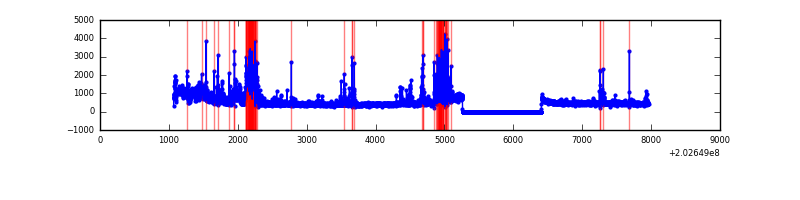 |
Top three noisy pixels from each quadrant. If the there are fewer than three noisy pixels in the level2.evt file, extra rows are filled as -1
| Pixel properties | Quadrant properties | ||||||
|---|---|---|---|---|---|---|---|
| Quadrant | DetID | PixID | Counts | Sigma | Mean | Median | Sigma |
| A | 13 | 164 | 140318 | 964.32 | 703 | 687 | 144.8 |
| A | 13 | 251 | 86171 | 590.37 | 703 | 687 | 144.8 |
| A | 0 | 118 | 62297 | 425.49 | 703 | 687 | 144.8 |
| B | 14 | 167 | 407205 | 2985.39 | 701 | 683 | 136.2 |
| B | 15 | 204 | 373582 | 2738.47 | 701 | 683 | 136.2 |
| B | 5 | 172 | 203312 | 1488.05 | 701 | 683 | 136.2 |
| C | 2 | 53 | 52002 | 321.8 | 680 | 683 | 159.5 |
| C | 9 | 247 | 7343 | 41.76 | 680 | 683 | 159.5 |
| C | 13 | 61 | 5809 | 32.14 | 680 | 683 | 159.5 |
| D | 9 | 35 | 588518 | 3598.26 | 676 | 658 | 163.4 |
| D | 13 | 239 | 200266 | 1221.79 | 676 | 658 | 163.4 |
| D | 2 | 37 | 104934 | 638.27 | 676 | 658 | 163.4 |
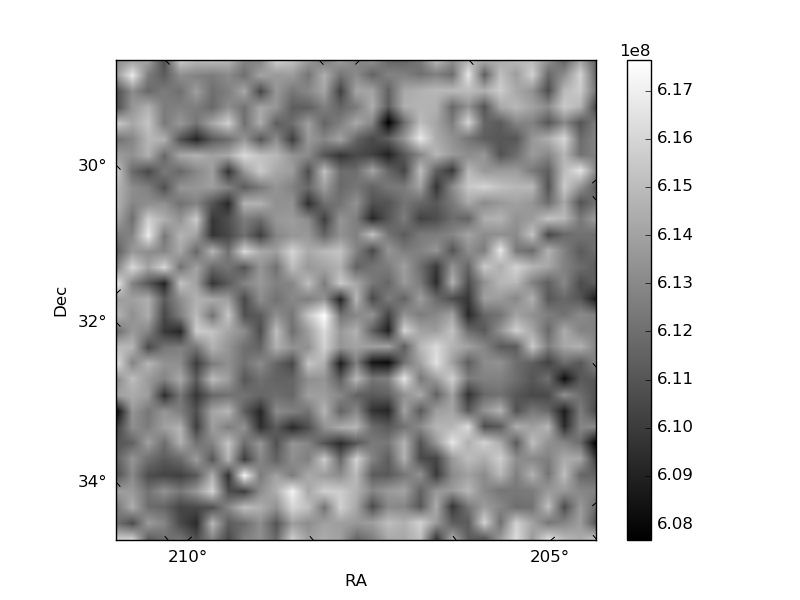
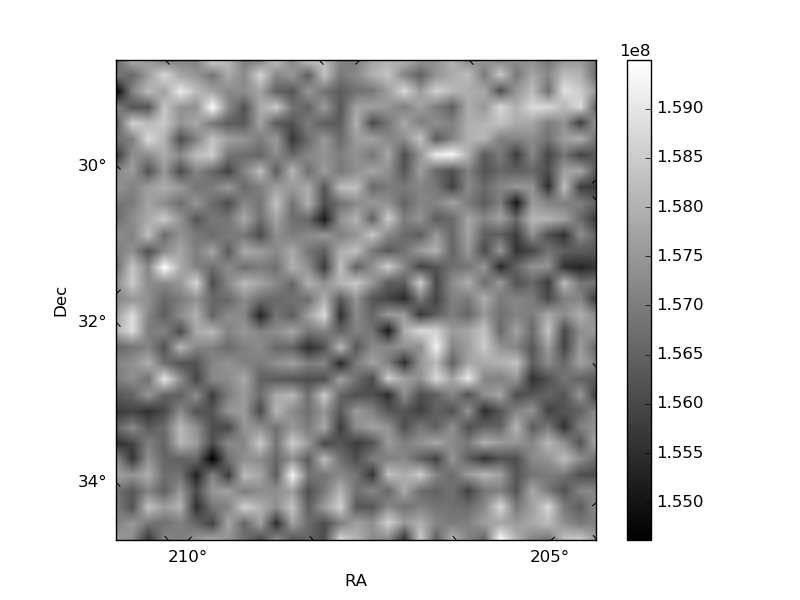
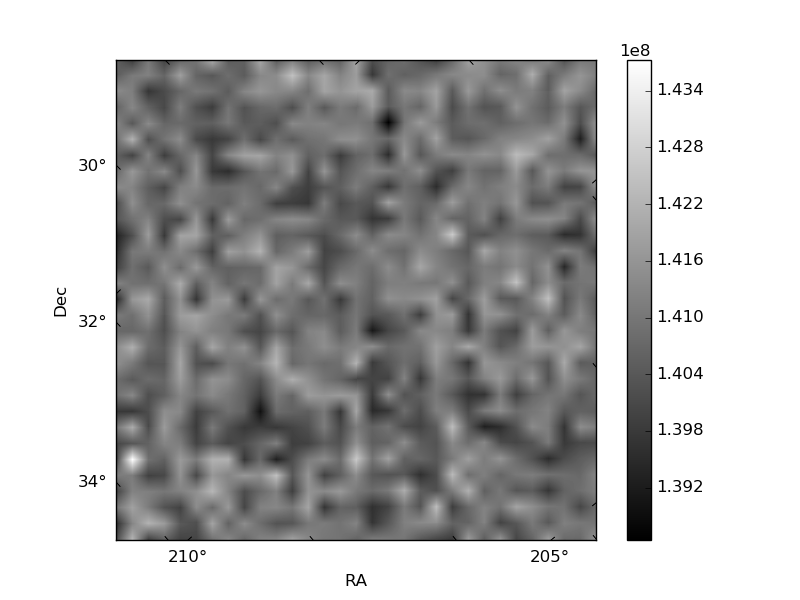
Histogram calculated using DETX and DETY for each event in the final _common_clean file
| Quadrant A | 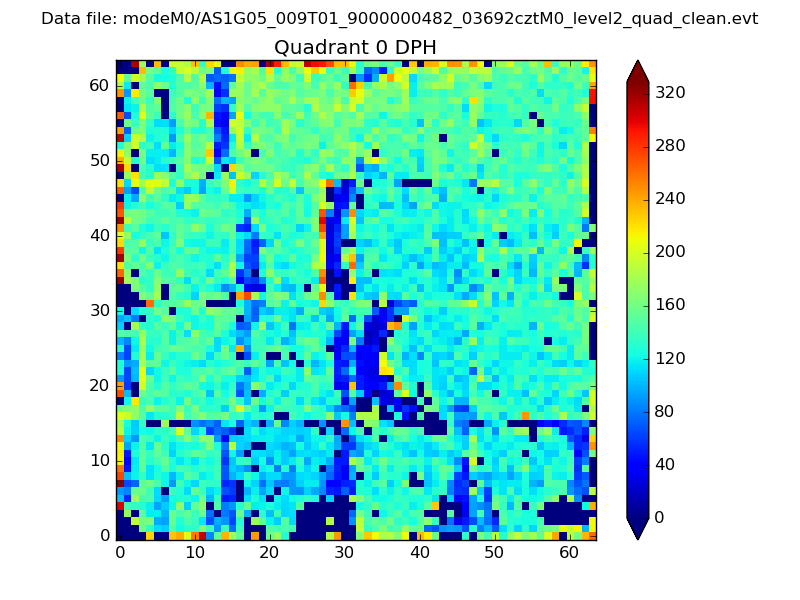 |
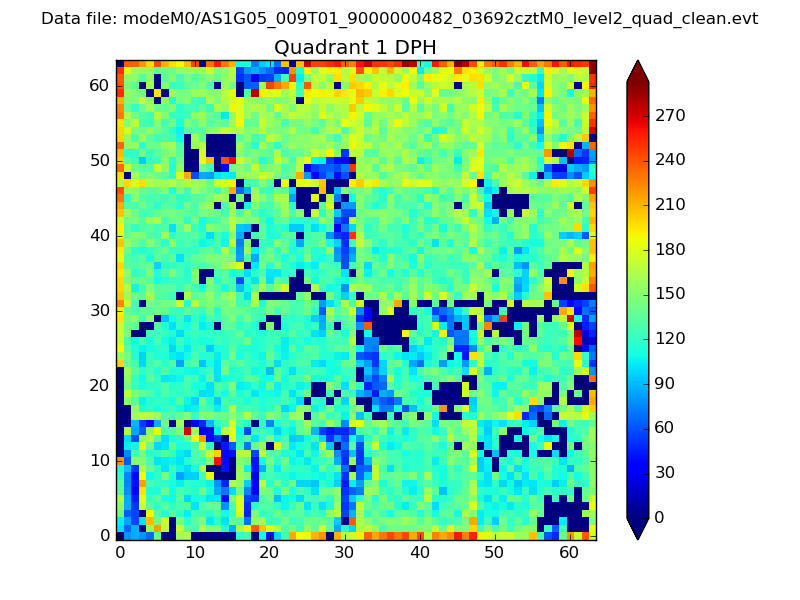 |
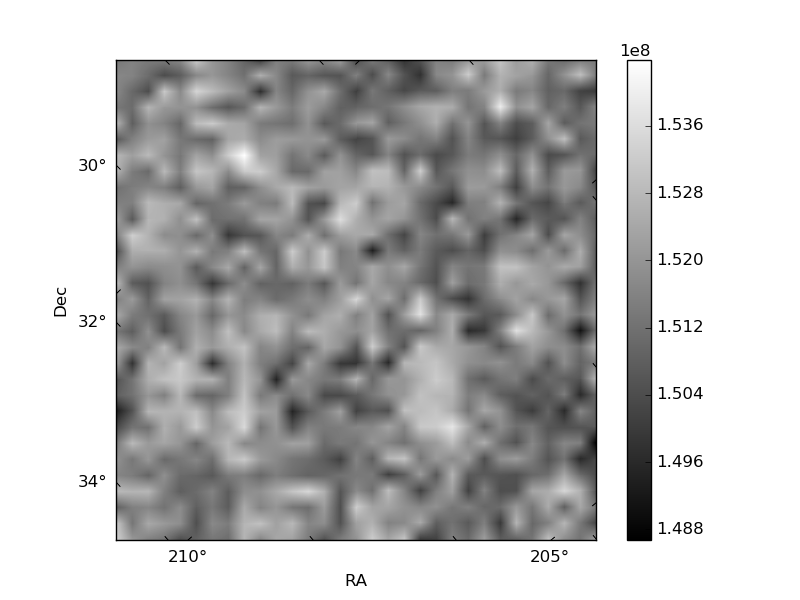
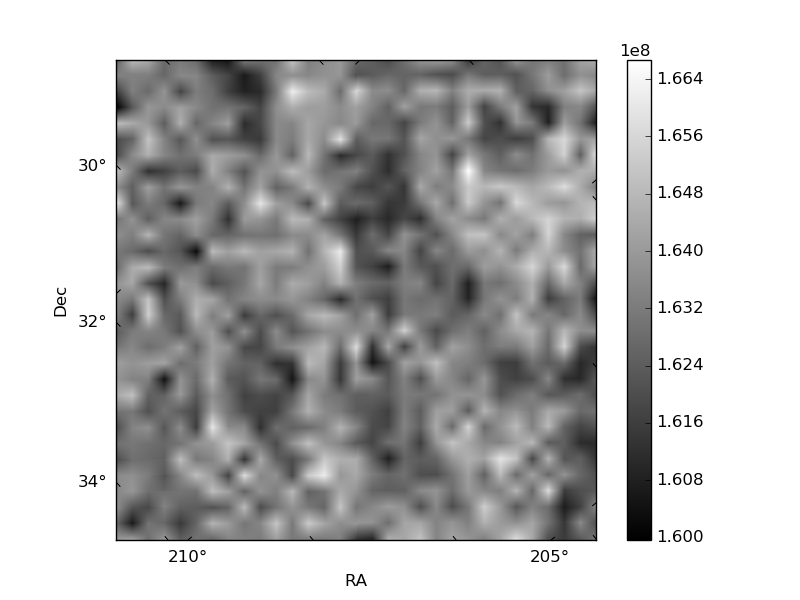
Quadrant B |
|---|---|---|---|
| Quadrant D | 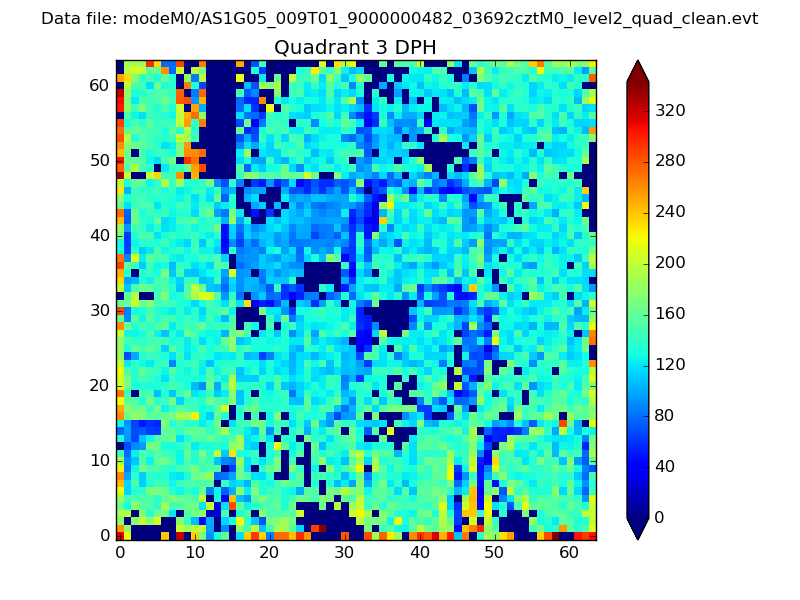 |
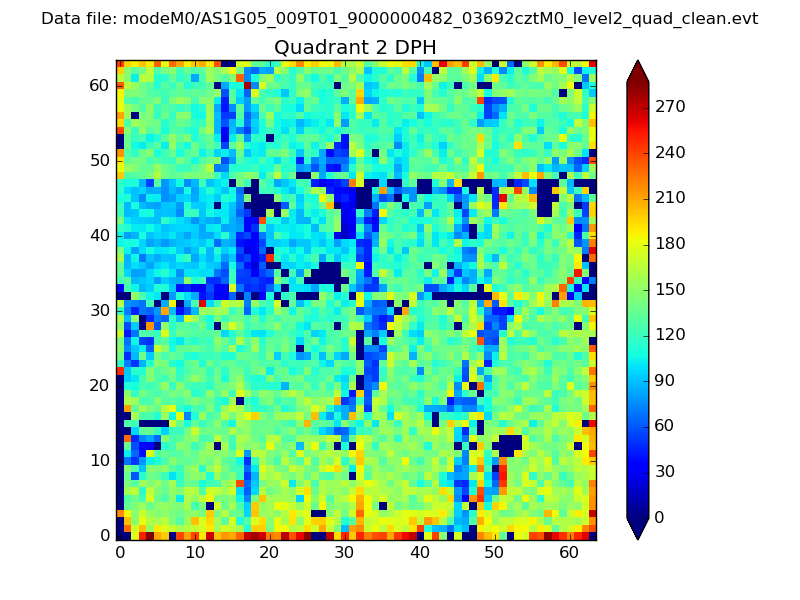 |
Quadrant C |
| Plot type | Count rate plots | Images |
|---|---|---|
| Comparison with Poisson distribution Blue bars denote a histogram of data divided into 1 sec bins. Red curve is a Poisson curve with rate = median count rate of data. |
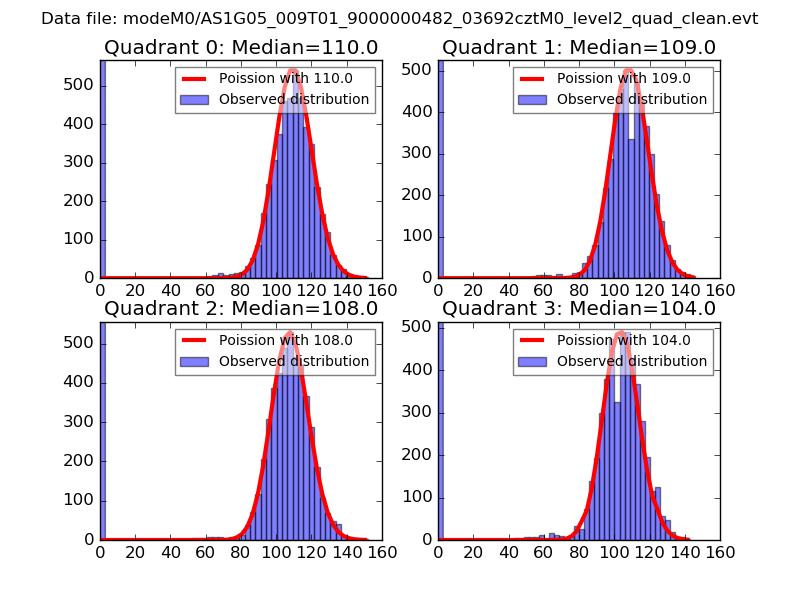 |
 |
| Quadrant-wise count rates Data is divided into 100 sec bins |
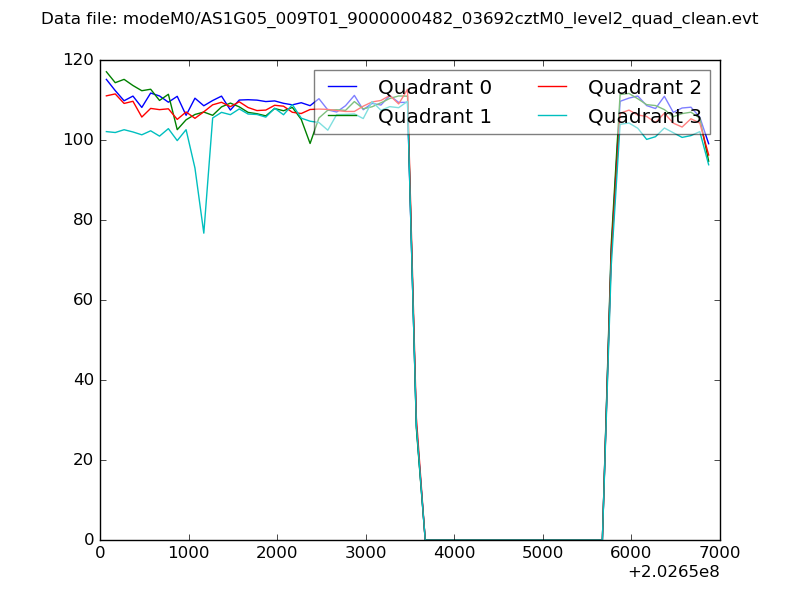 |
|
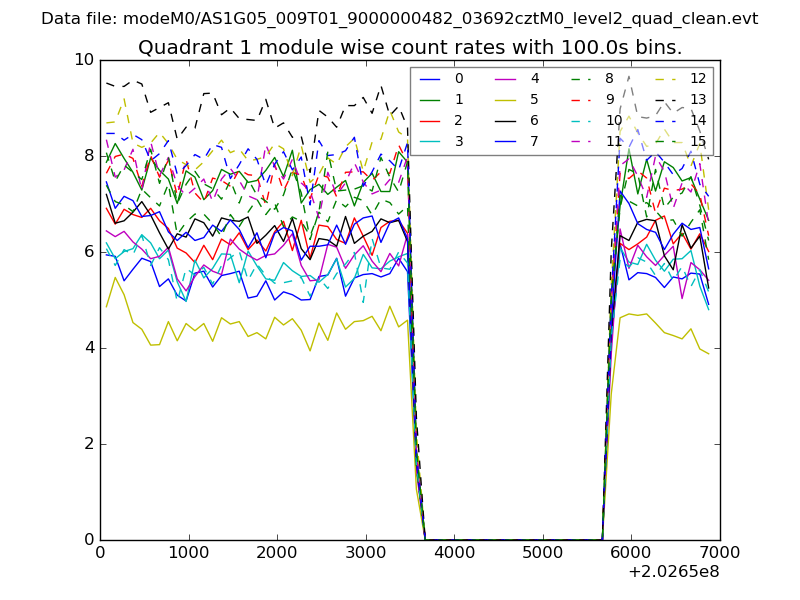
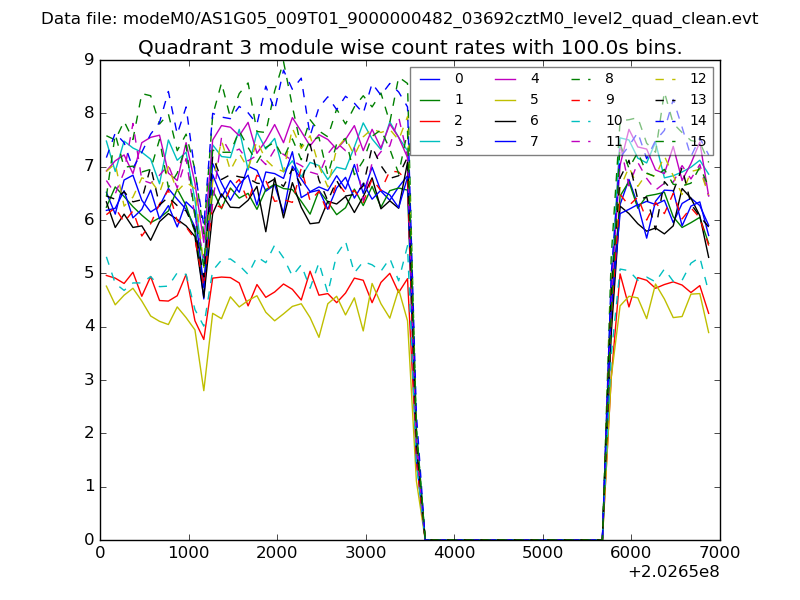
| Module-wise count rates for Quadrant A Data is divided into 100 sec bins |
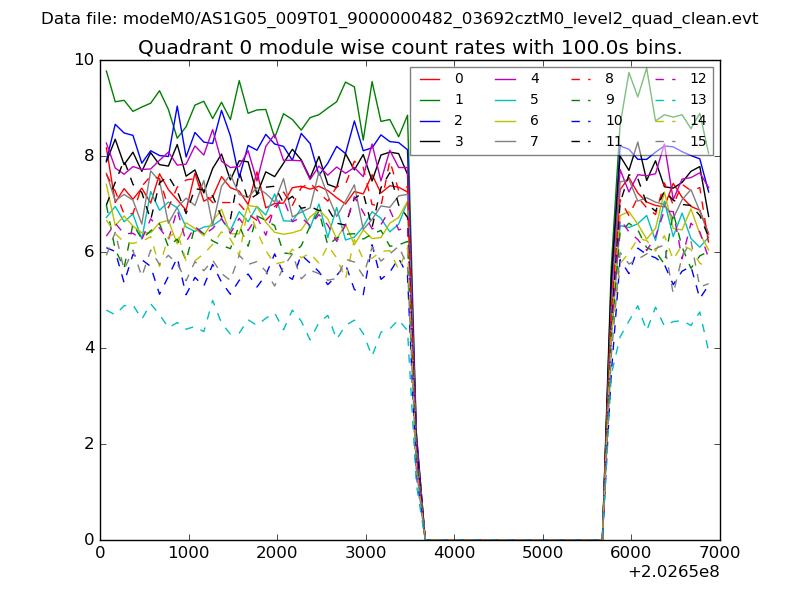 |
 |
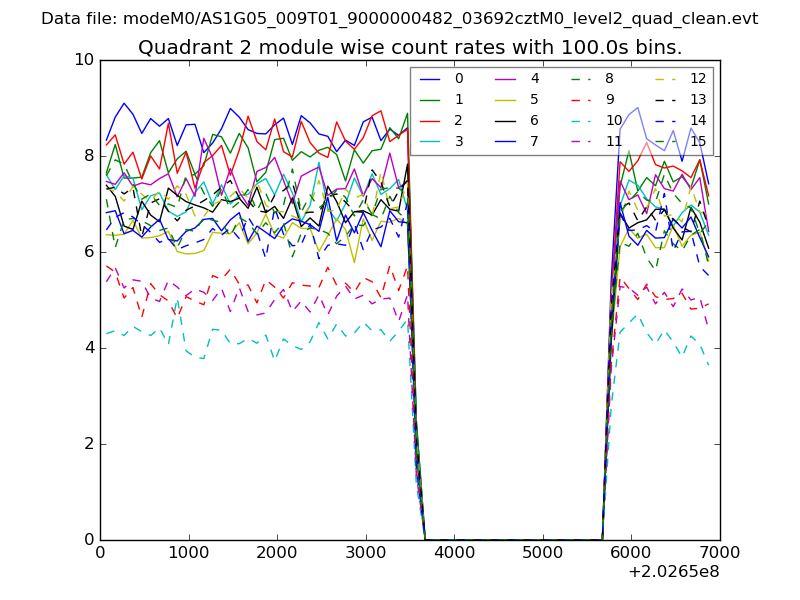
| Module-wise count rates for Quadrant B Data is divided into 100 sec bins |
 |
 |
| Module-wise count rates for Quadrant C Data is divided into 100 sec bins |
 |
 |
| Module-wise count rates for Quadrant D Data is divided into 100 sec bins |
 |
 |
| Parameter | Plot |
|---|---|
| CZT HV Monitor | 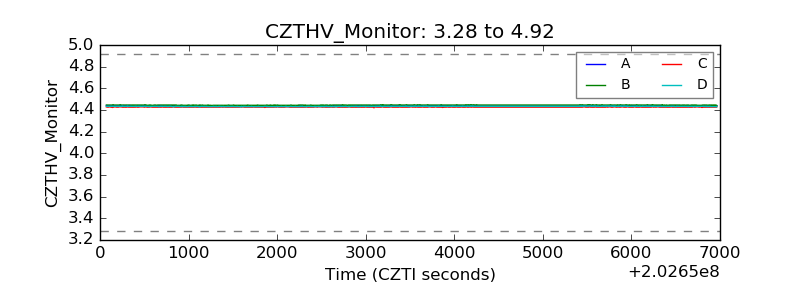 |
| D_VDD | 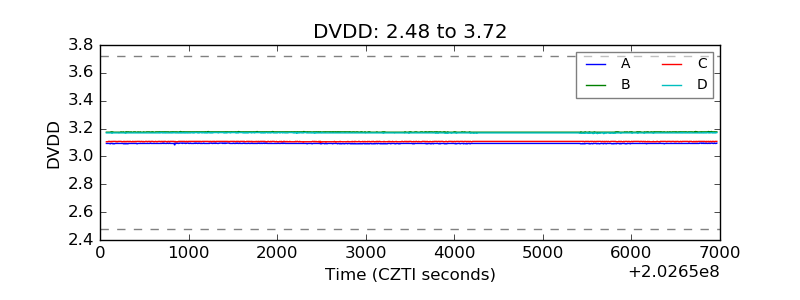 |
| Temperature 1 | 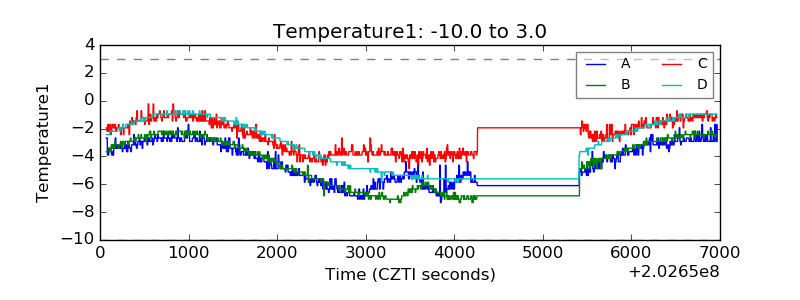 |
| Veto HV Monitor | 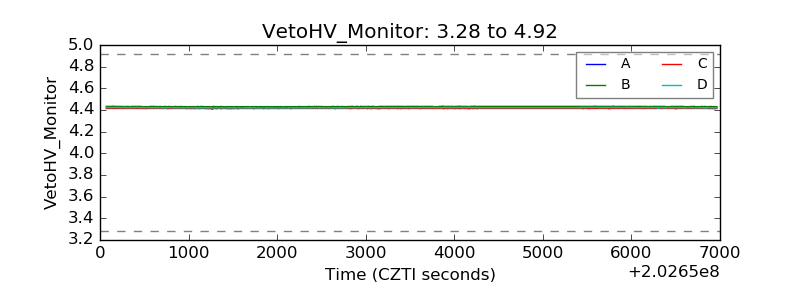 |
| Veto LLD | 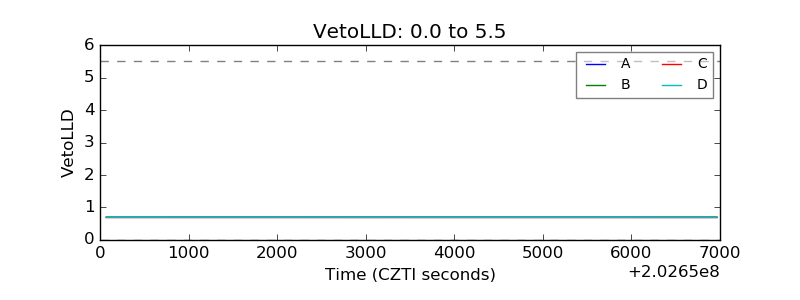 |
| Alpha Counter | 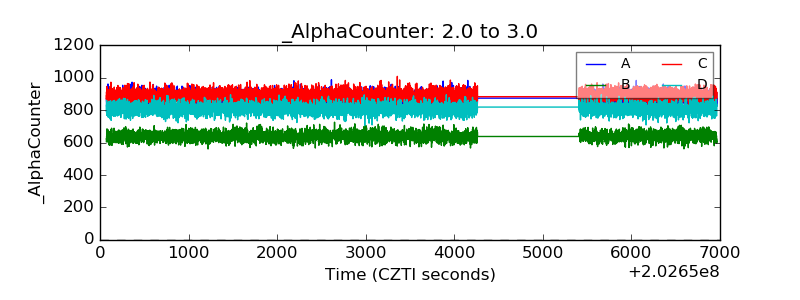 |
| _CPM_Rate | 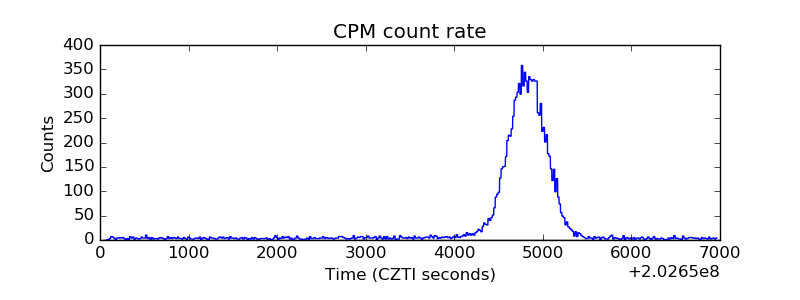 |
| CZT Counter | 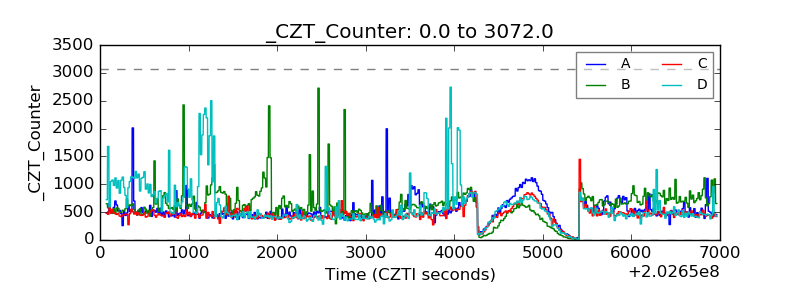 |
| +2.5 Volts monitor |  |
| +5 Volts monitor |  |
| Veto Counter | 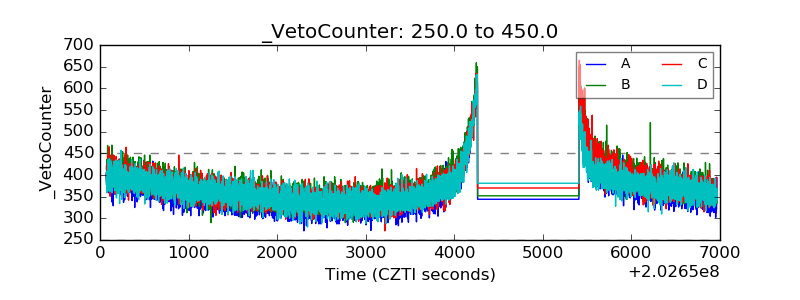 |