| Param | Original file | Final file |
|---|---|---|
| Filename | modeM0/AS1G05_009T01_9000000482_03693cztM0_level2.evt | modeM0/AS1G05_009T01_9000000482_03693cztM0_level2_quad_clean.evt |
| Size (bytes) | 507,401,280 | 86,944,320 |
| Size | 483.9 MB | 82.9 MB |
| Events in quadrant A | 3,606,509 | 553,802 |
| Events in quadrant B | 4,390,457 | 548,748 |
| Events in quadrant C | 3,650,359 | 541,571 |
| Events in quadrant D | 3,274,267 | 531,566 |
| Mode M9 | |||
|---|---|---|---|
| Quadrant | BADHDUFLAG | Total packets | Discarded packets |
| A | 0 | 9 | 0 |
| B | 0 | 9 | 0 |
| C | 0 | 9 | 0 |
| D | 0 | 9 | 0 |
| Mode SS | |||
|---|---|---|---|
| Quadrant | BADHDUFLAG | Total packets | Discarded packets |
| A | 0 | 134 | 0 |
| B | 0 | 134 | 0 |
| C | 0 | 134 | 0 |
| D | 0 | 134 | 0 |
| Mode M0 | |||
|---|---|---|---|
| Quadrant | BADHDUFLAG | Total packets | Discarded packets |
| A | 0 | 15069 | 2 |
| B | 0 | 17614 | 1 |
| C | 0 | 15358 | 1 |
| D | 0 | 14432 | 1 |
| Quadrant | Total seconds | Saturated seconds | Saturation percentage |
|---|---|---|---|
| A | 6553 | 163 | 2.487410% |
| B | 6553 | 136 | 2.075385% |
| C | 6553 | 339 | 5.173203% |
| D | 6553 | 96 | 1.464978% |
Noise dominated data is calculated using 1-second bins in cleaned event files. If a bin has >2000 counts, and if more than 50% of those come from <1% of pixels, then it is considered to be noise-dominated and hence unusable.
| Quadrant | # 1 sec bins | Bins with >0 counts | Bins with >2000 counts | High rate bins dominated by noise | Noise dominated (total time) | Noise dominated (detector-on time) | Marked lightcurve |
|---|---|---|---|---|---|---|---|
| A | 7453 | 6554 | 61 | 61 | 0.82% | 0.93% | 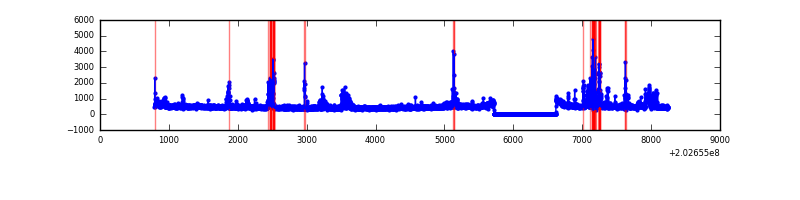 |
| B | 7453 | 6554 | 59 | 59 | 0.79% | 0.90% | 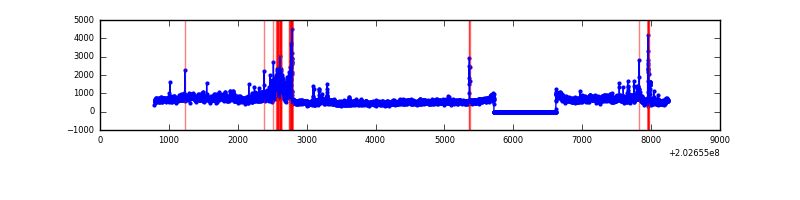 |
| C | 7453 | 6553 | 233 | 233 | 3.13% | 3.56% | 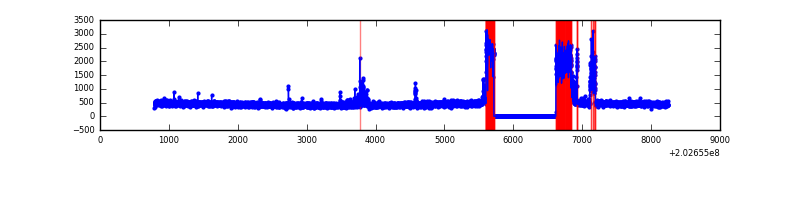 |
| D | 7453 | 6554 | 57 | 57 | 0.76% | 0.87% | 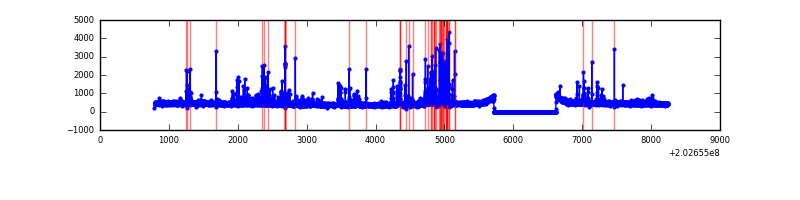 |
Top three noisy pixels from each quadrant. If the there are fewer than three noisy pixels in the level2.evt file, extra rows are filled as -1
| Pixel properties | Quadrant properties | ||||||
|---|---|---|---|---|---|---|---|
| Quadrant | DetID | PixID | Counts | Sigma | Mean | Median | Sigma |
| A | 13 | 251 | 229323 | 1430.47 | 774 | 756 | 159.8 |
| A | 0 | 118 | 178768 | 1114.08 | 774 | 756 | 159.8 |
| A | 13 | 164 | 130739 | 813.49 | 774 | 756 | 159.8 |
| B | 14 | 167 | 508607 | 3321.02 | 779 | 758 | 152.9 |
| B | 15 | 204 | 363732 | 2373.63 | 779 | 758 | 152.9 |
| B | 4 | 81 | 259992 | 1695.23 | 779 | 758 | 152.9 |
| C | 2 | 53 | 735607 | 4285.41 | 730 | 733 | 171.5 |
| C | 9 | 247 | 47605 | 273.33 | 730 | 733 | 171.5 |
| C | 0 | 239 | 7025 | 36.69 | 730 | 733 | 171.5 |
| D | 13 | 239 | 199630 | 1088.31 | 753 | 731 | 182.8 |
| D | 2 | 37 | 74542 | 403.87 | 753 | 731 | 182.8 |
| D | 5 | 233 | 54986 | 296.87 | 753 | 731 | 182.8 |
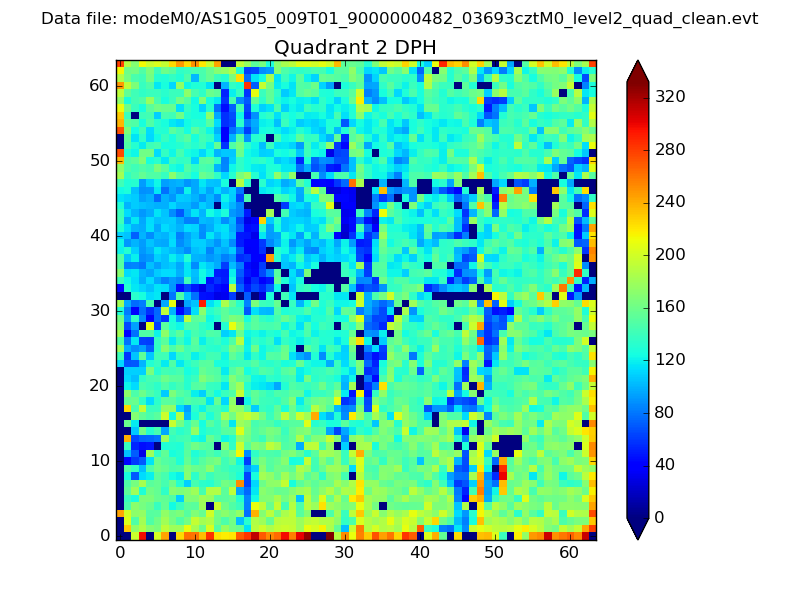
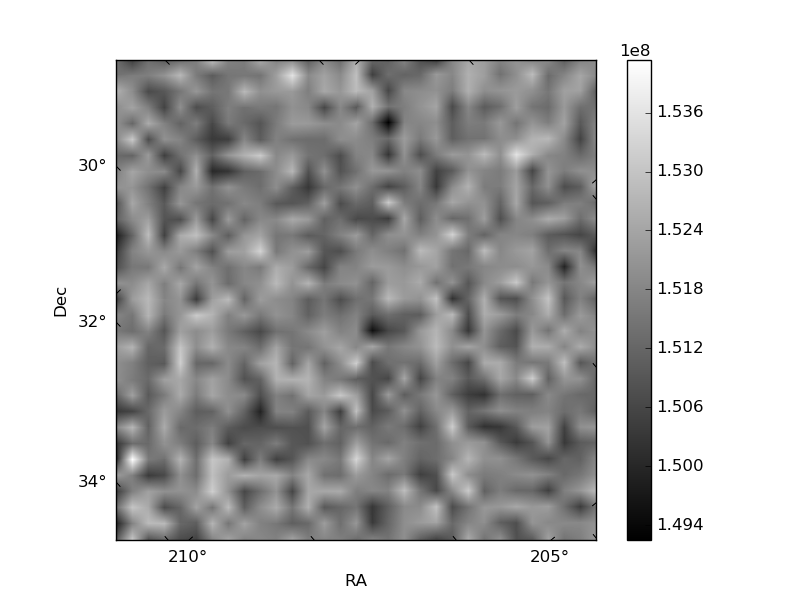
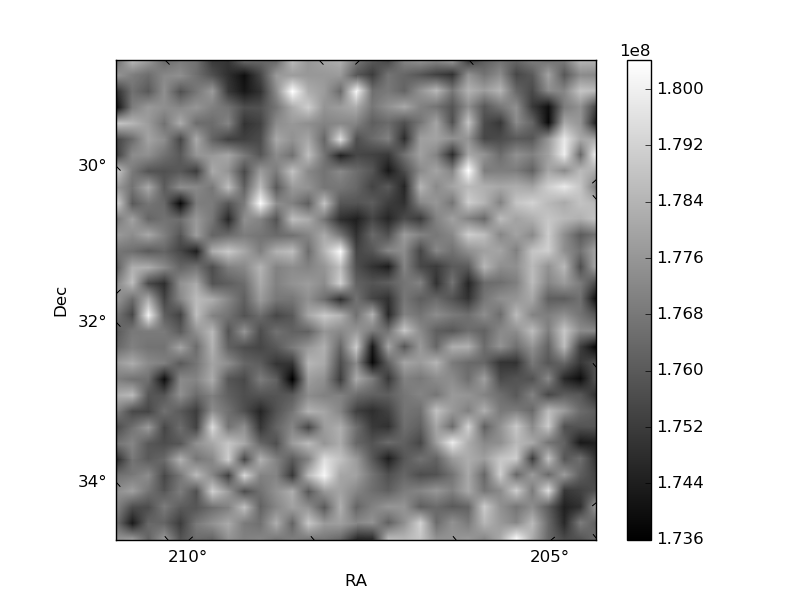
Histogram calculated using DETX and DETY for each event in the final _common_clean file
| Quadrant A | 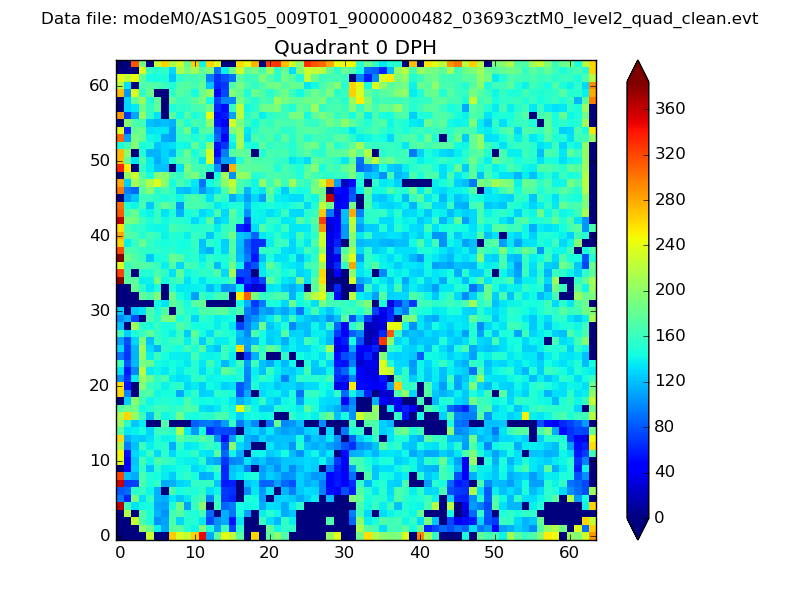 |
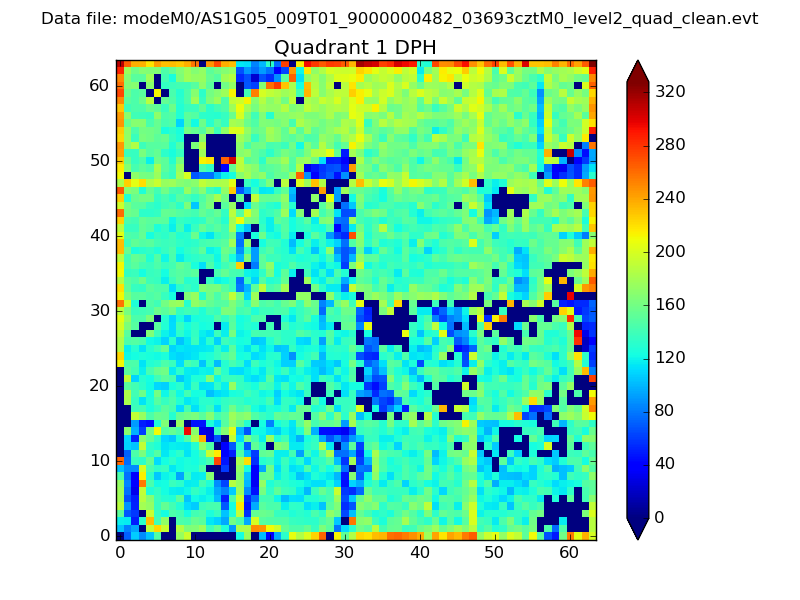 |
Quadrant B |
|---|---|---|---|
| Quadrant D | 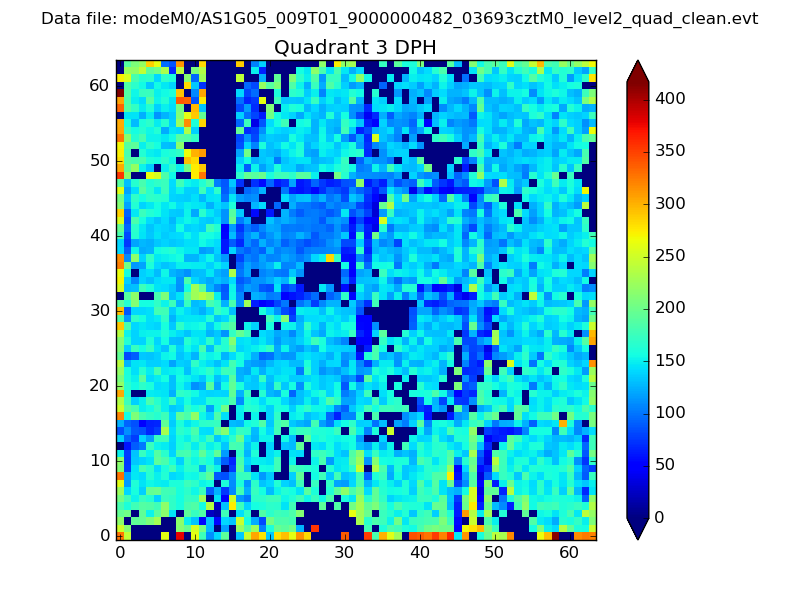 |
 |
Quadrant C |
| Plot type | Count rate plots | Images |
|---|---|---|
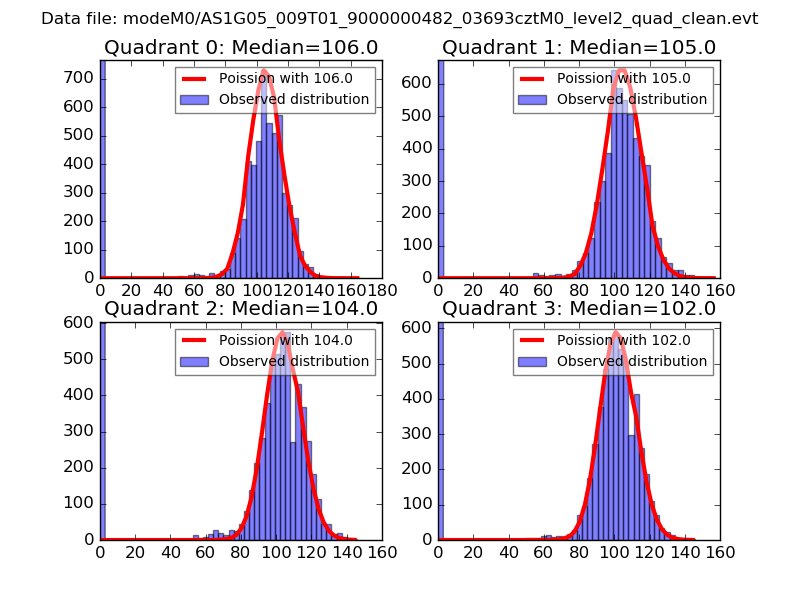
| Comparison with Poisson distribution Blue bars denote a histogram of data divided into 1 sec bins. Red curve is a Poisson curve with rate = median count rate of data. |
 |
 |
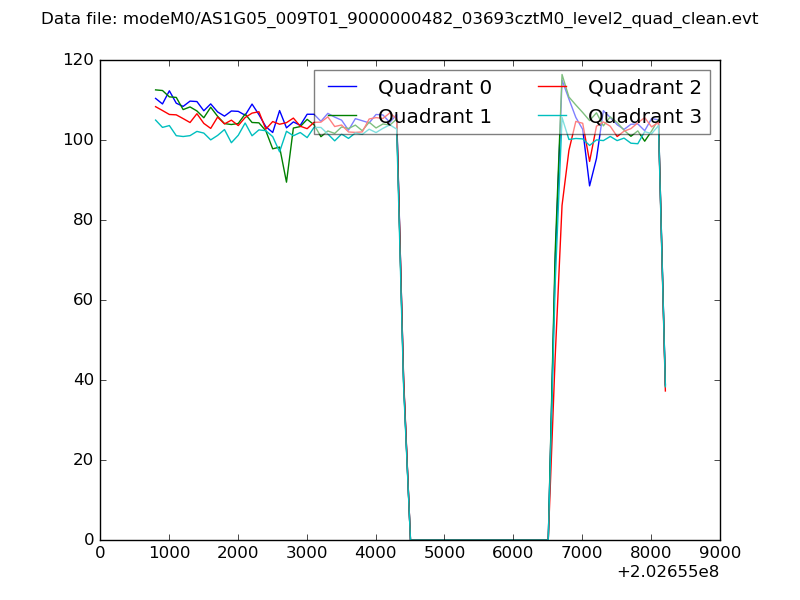
| Quadrant-wise count rates Data is divided into 100 sec bins |
 |
|
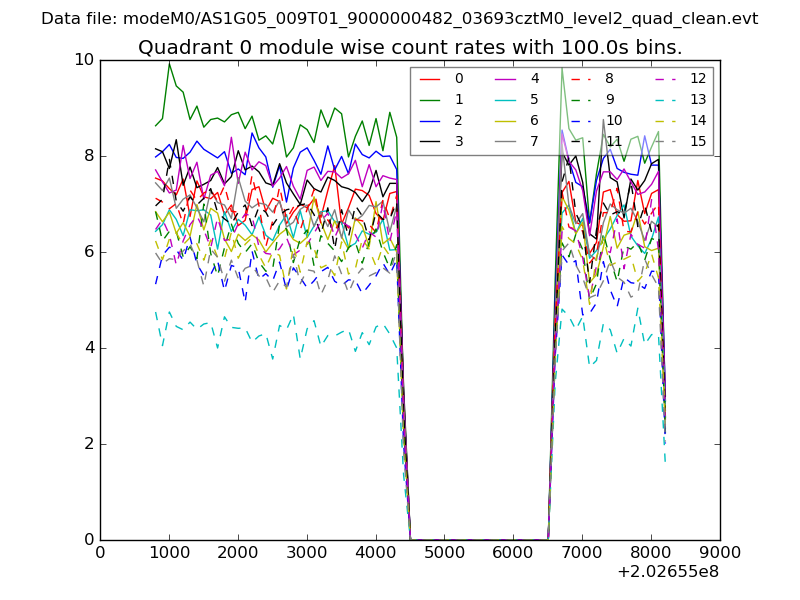
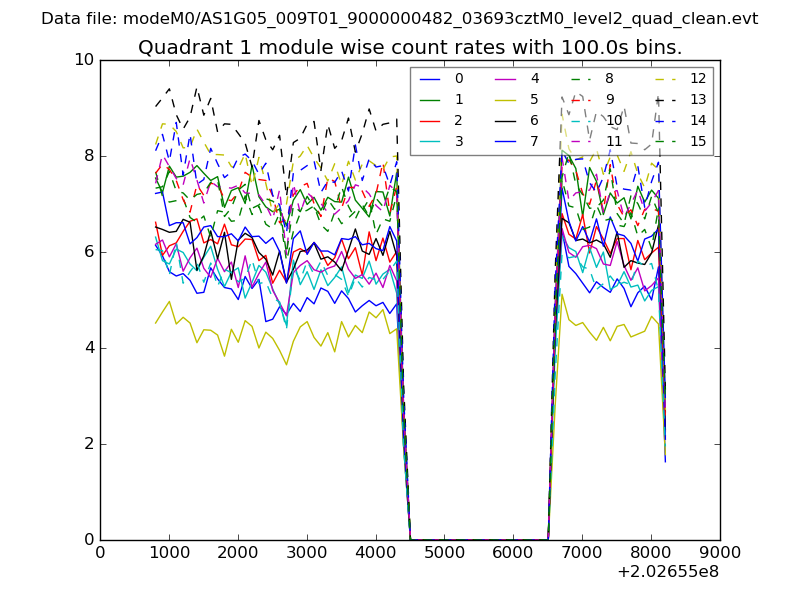
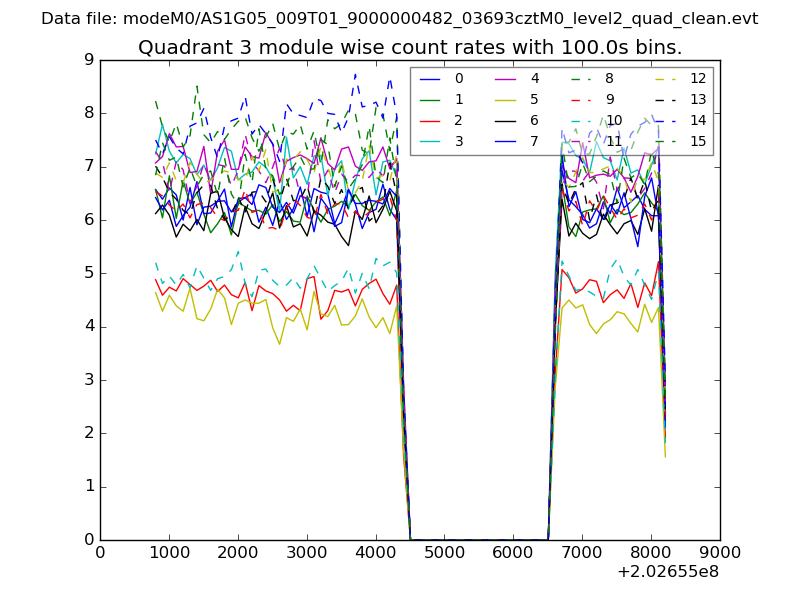
| Module-wise count rates for Quadrant A Data is divided into 100 sec bins |
 |
 |
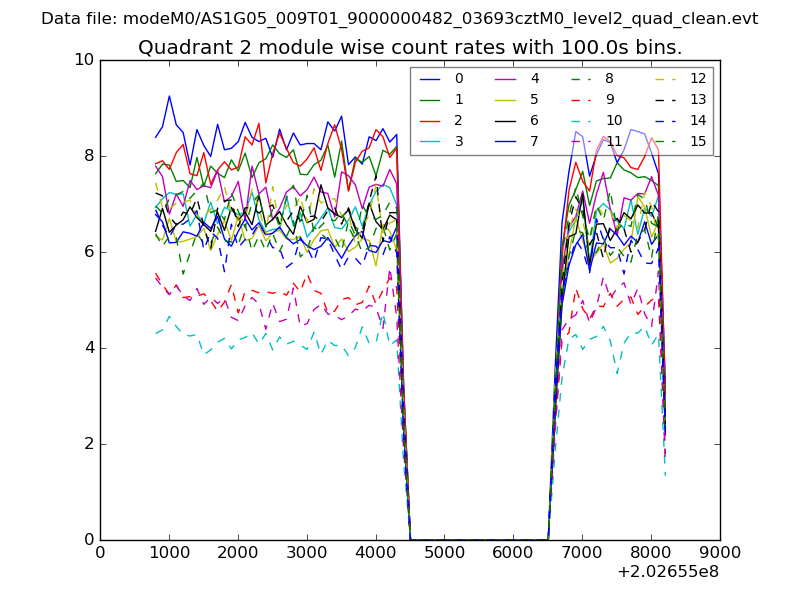
| Module-wise count rates for Quadrant B Data is divided into 100 sec bins |
 |
 |
| Module-wise count rates for Quadrant C Data is divided into 100 sec bins |
 |
 |
| Module-wise count rates for Quadrant D Data is divided into 100 sec bins |
 |
 |
| Parameter | Plot |
|---|---|
| CZT HV Monitor | 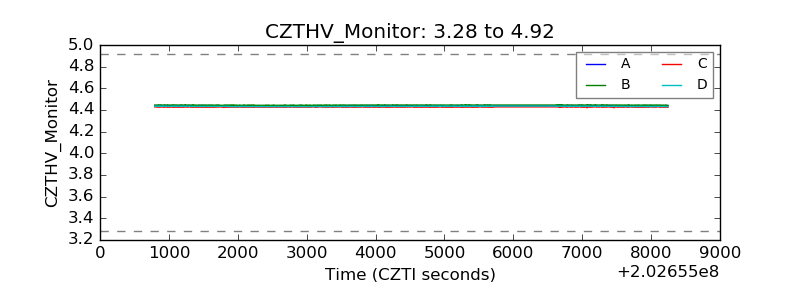 |
| D_VDD | 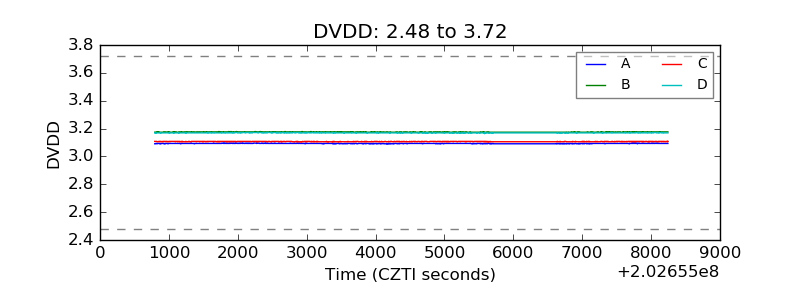 |
| Temperature 1 | 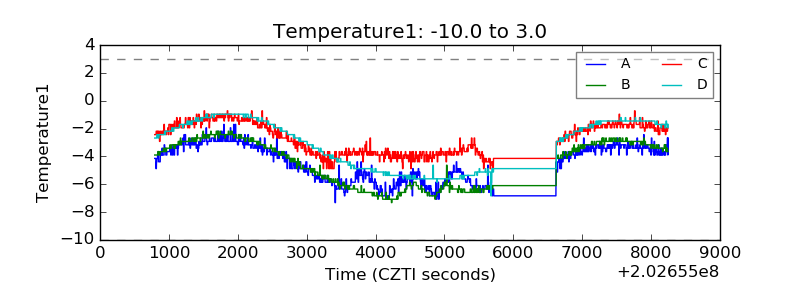 |
| Veto HV Monitor | 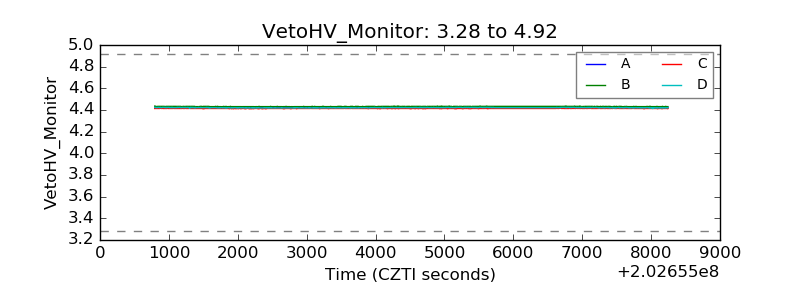 |
| Veto LLD | 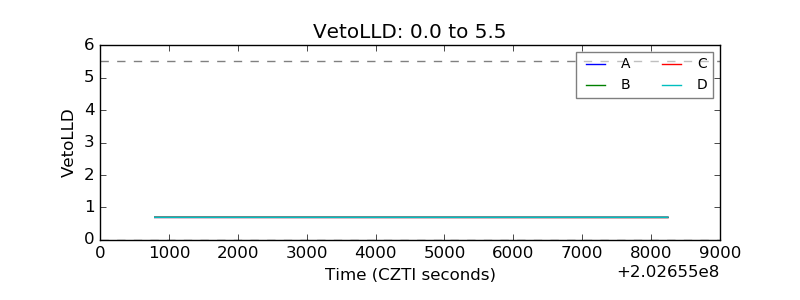 |
| Alpha Counter | 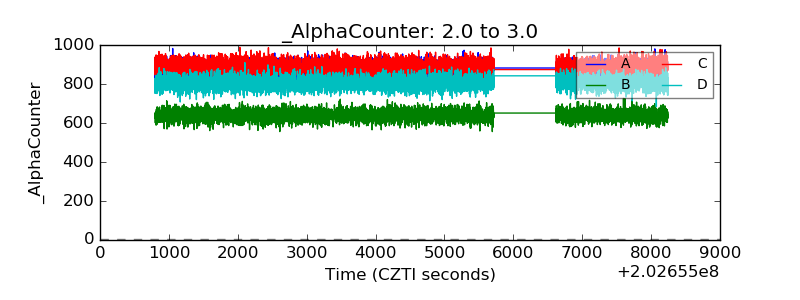 |
| _CPM_Rate | 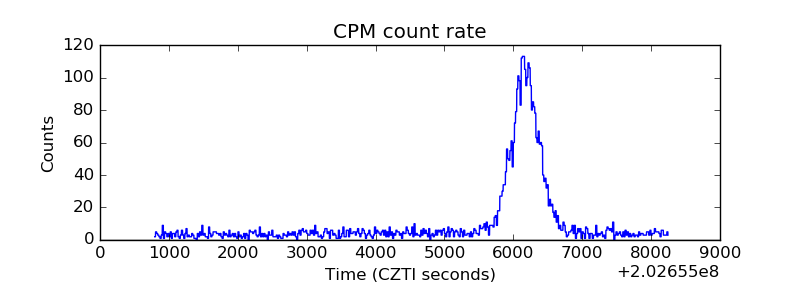 |
| CZT Counter | 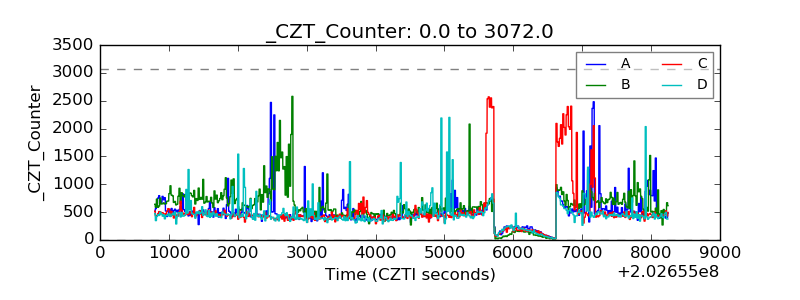 |
| +2.5 Volts monitor | 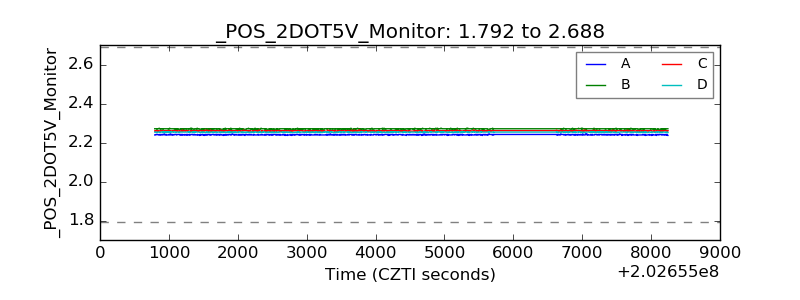 |
| +5 Volts monitor |  |
| Veto Counter | 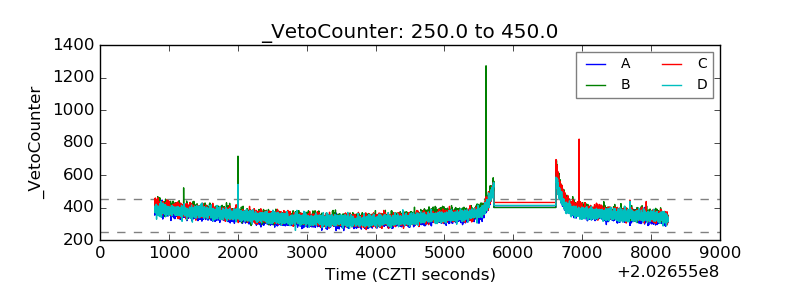 |