| Param | Original file | Final file |
|---|---|---|
| Filename | modeM0/AS1G05_009T01_9000000482_03694cztM0_level2.evt | modeM0/AS1G05_009T01_9000000482_03694cztM0_level2_quad_clean.evt |
| Size (bytes) | 506,854,080 | 74,459,520 |
| Size | 483.4 MB | 71.0 MB |
| Events in quadrant A | 4,644,781 | 432,025 |
| Events in quadrant B | 4,186,718 | 458,262 |
| Events in quadrant C | 3,020,682 | 459,722 |
| Events in quadrant D | 3,053,304 | 447,738 |
| Mode M9 | |||
|---|---|---|---|
| Quadrant | BADHDUFLAG | Total packets | Discarded packets |
| A | 0 | 5 | 0 |
| B | 0 | 5 | 0 |
| C | 0 | 5 | 0 |
| D | 0 | 5 | 0 |
| Mode SS | |||
|---|---|---|---|
| Quadrant | BADHDUFLAG | Total packets | Discarded packets |
| A | 0 | 132 | 0 |
| B | 0 | 132 | 0 |
| C | 0 | 132 | 0 |
| D | 0 | 132 | 0 |
| Mode M0 | |||
|---|---|---|---|
| Quadrant | BADHDUFLAG | Total packets | Discarded packets |
| A | 0 | 18071 | 2 |
| B | 0 | 16978 | 1 |
| C | 0 | 13662 | 1 |
| D | 0 | 13980 | 1 |
| Quadrant | Total seconds | Saturated seconds | Saturation percentage |
|---|---|---|---|
| A | 6551 | 565 | 8.624637% |
| B | 6551 | 158 | 2.411846% |
| C | 6551 | 102 | 1.557014% |
| D | 6551 | 129 | 1.969165% |
Noise dominated data is calculated using 1-second bins in cleaned event files. If a bin has >2000 counts, and if more than 50% of those come from <1% of pixels, then it is considered to be noise-dominated and hence unusable.
| Quadrant | # 1 sec bins | Bins with >0 counts | Bins with >2000 counts | High rate bins dominated by noise | Noise dominated (total time) | Noise dominated (detector-on time) | Marked lightcurve |
|---|---|---|---|---|---|---|---|
| A | 7011 | 6552 | 399 | 399 | 5.69% | 6.09% | 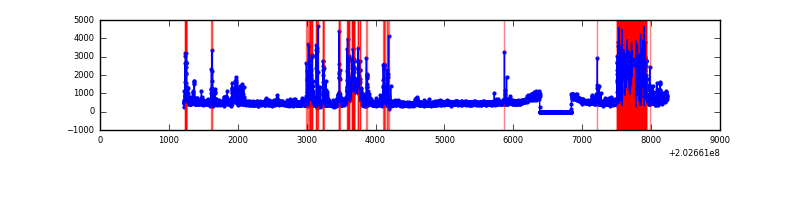 |
| B | 7011 | 6552 | 24 | 24 | 0.34% | 0.37% | 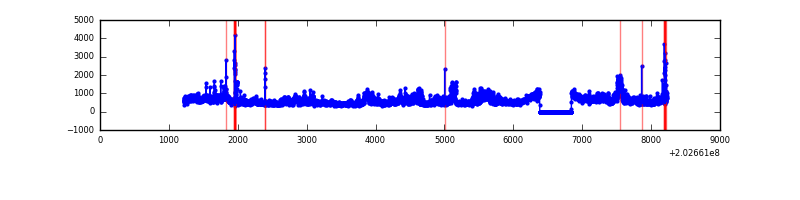 |
| C | 7011 | 6552 | 6 | 6 | 0.09% | 0.09% | 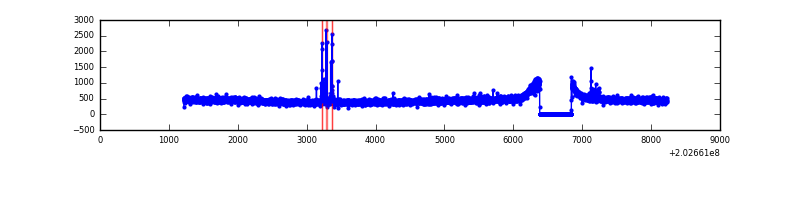 |
| D | 7011 | 6552 | 19 | 19 | 0.27% | 0.29% | 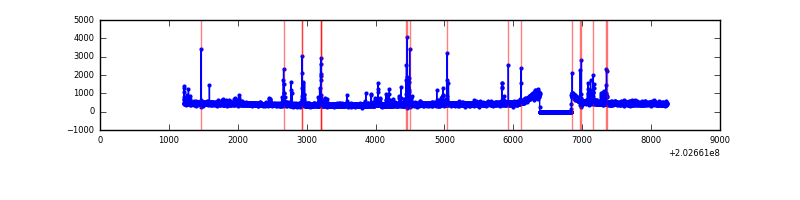 |
Top three noisy pixels from each quadrant. If the there are fewer than three noisy pixels in the level2.evt file, extra rows are filled as -1
| Pixel properties | Quadrant properties | ||||||
|---|---|---|---|---|---|---|---|
| Quadrant | DetID | PixID | Counts | Sigma | Mean | Median | Sigma |
| A | 13 | 251 | 1358729 | 8727.6 | 749 | 731 | 155.6 |
| A | 13 | 164 | 188131 | 1204.38 | 749 | 731 | 155.6 |
| A | 0 | 118 | 96204 | 613.59 | 749 | 731 | 155.6 |
| B | 5 | 70 | 389516 | 2536.95 | 782 | 764 | 153.2 |
| B | 15 | 204 | 352578 | 2295.9 | 782 | 764 | 153.2 |
| B | 14 | 167 | 180717 | 1174.35 | 782 | 764 | 153.2 |
| C | 9 | 247 | 47797 | 261.22 | 760 | 761 | 180.1 |
| C | 13 | 61 | 6455 | 31.62 | 760 | 761 | 180.1 |
| C | 5 | 223 | 2677 | 10.64 | 760 | 761 | 180.1 |
| D | 5 | 233 | 91334 | 486.42 | 758 | 735 | 186.3 |
| D | 13 | 239 | 47679 | 252.04 | 758 | 735 | 186.3 |
| D | 13 | 223 | 19462 | 100.54 | 758 | 735 | 186.3 |
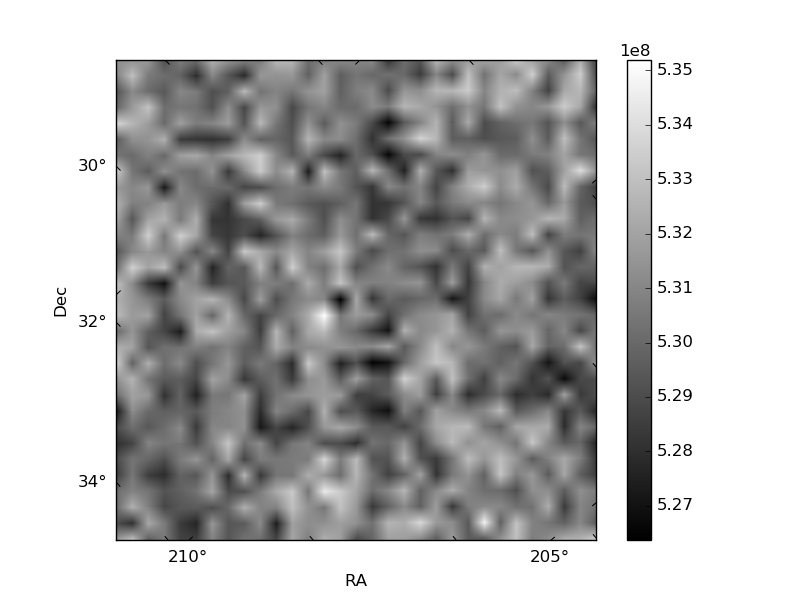
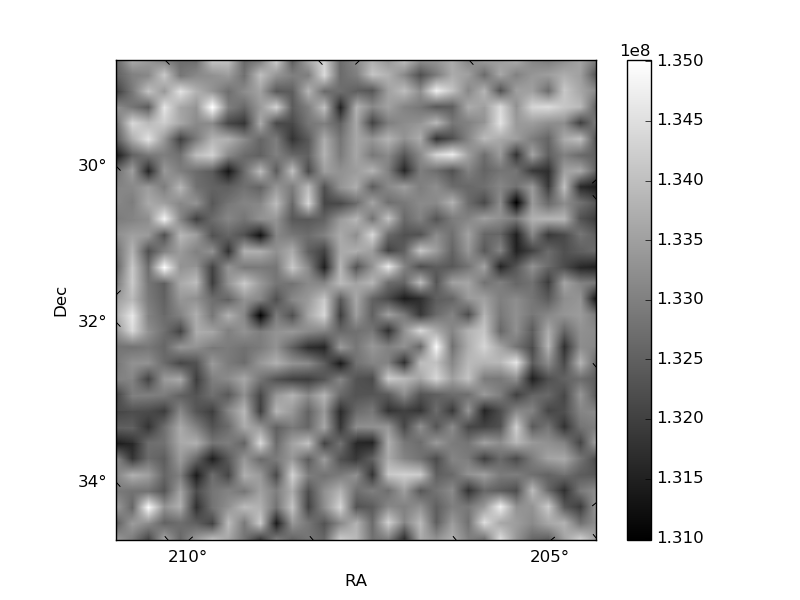
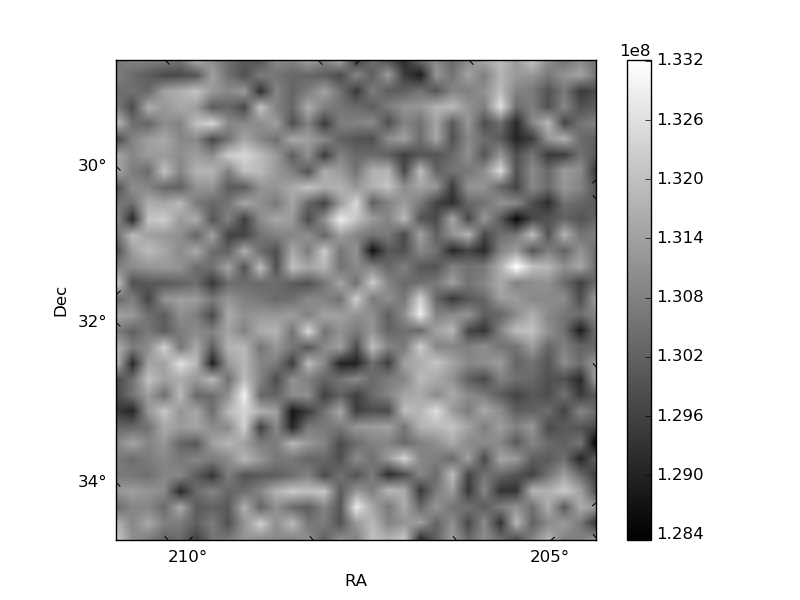
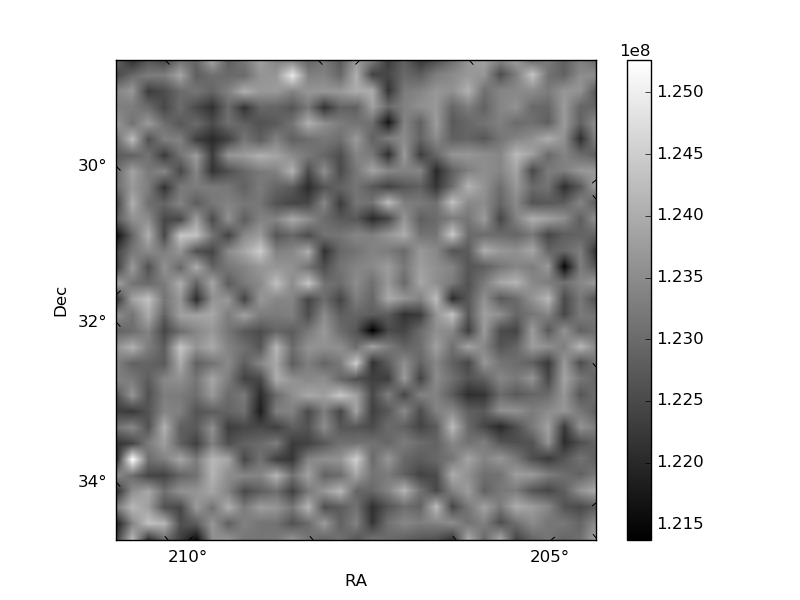
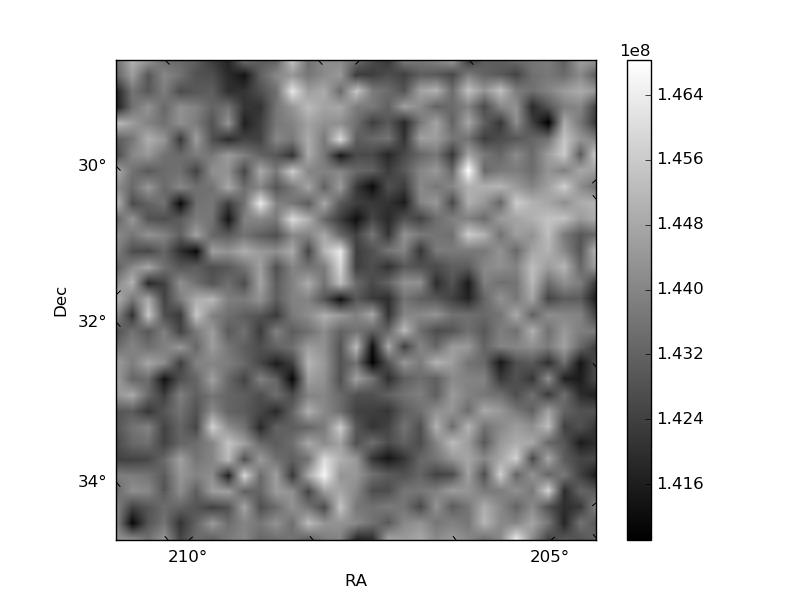
Histogram calculated using DETX and DETY for each event in the final _common_clean file
| Quadrant A | 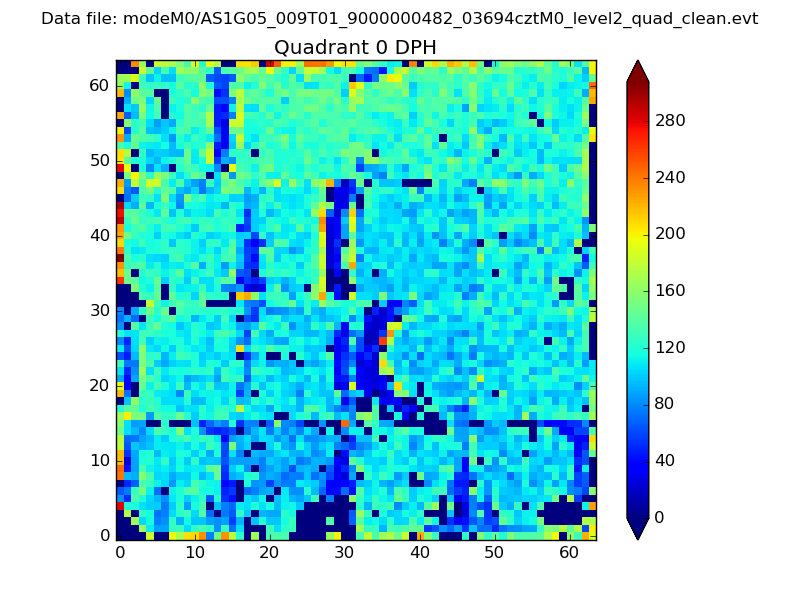 |
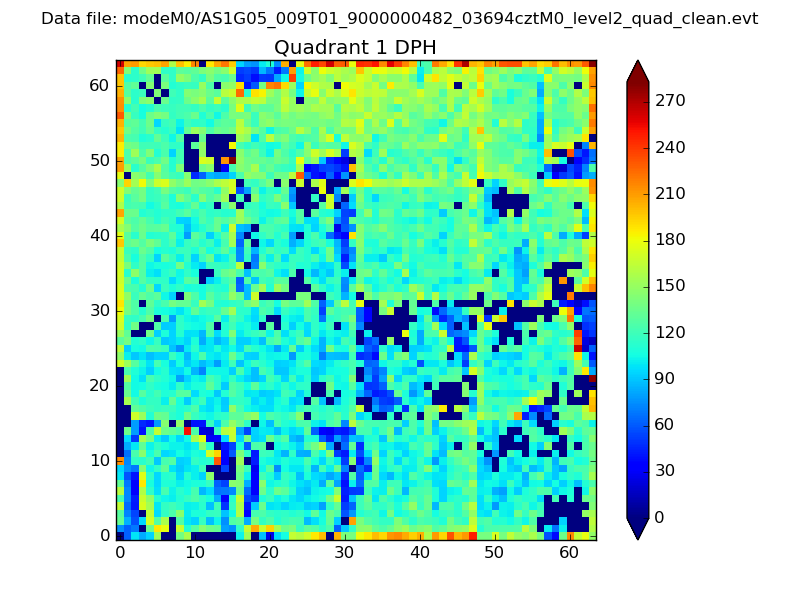 |
Quadrant B |
|---|---|---|---|
| Quadrant D | 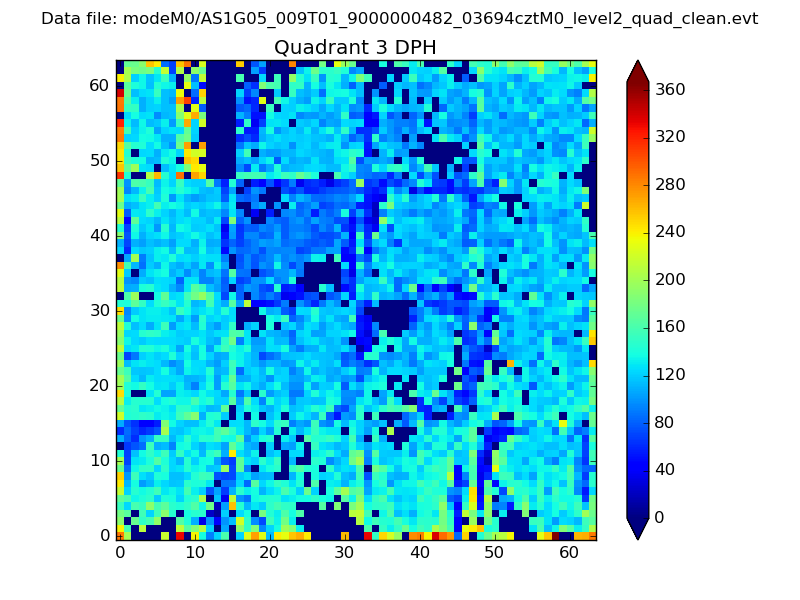 |
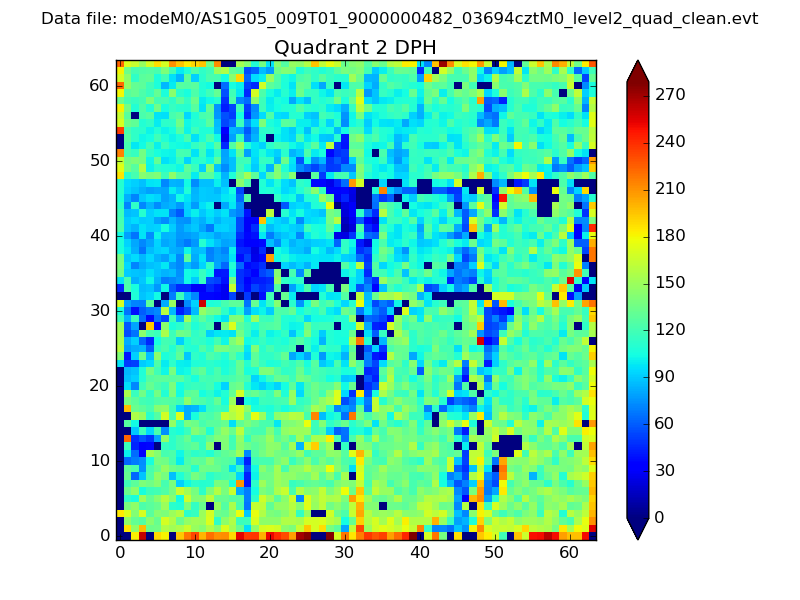 |
Quadrant C |
| Plot type | Count rate plots | Images |
|---|---|---|
| Comparison with Poisson distribution Blue bars denote a histogram of data divided into 1 sec bins. Red curve is a Poisson curve with rate = median count rate of data. |
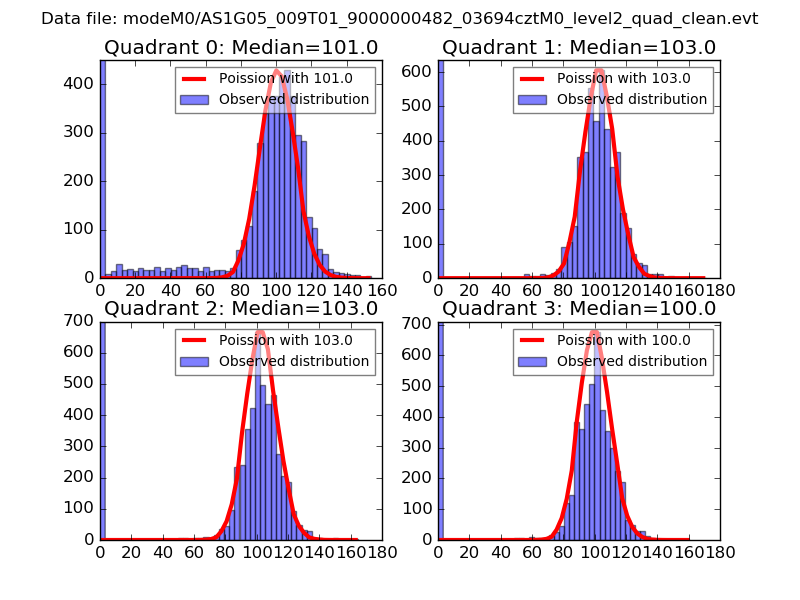 |
 |
| Quadrant-wise count rates Data is divided into 100 sec bins |
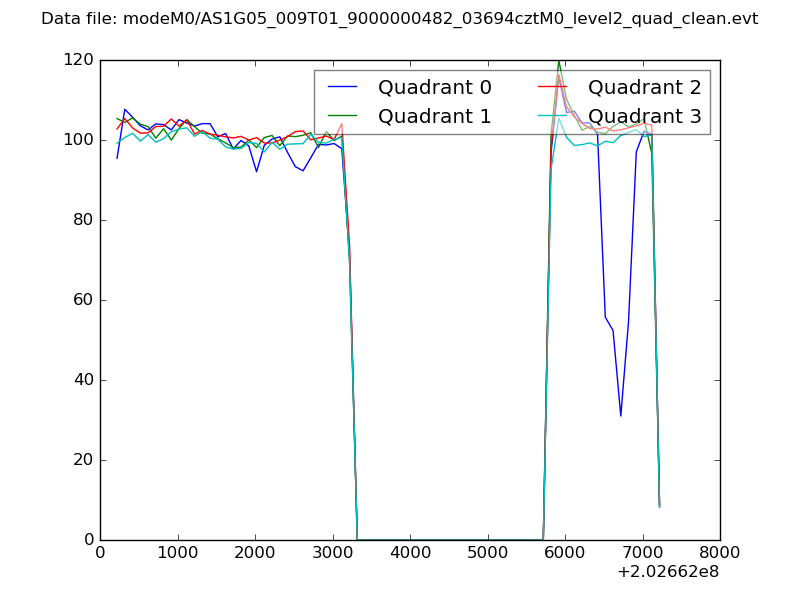 |
|
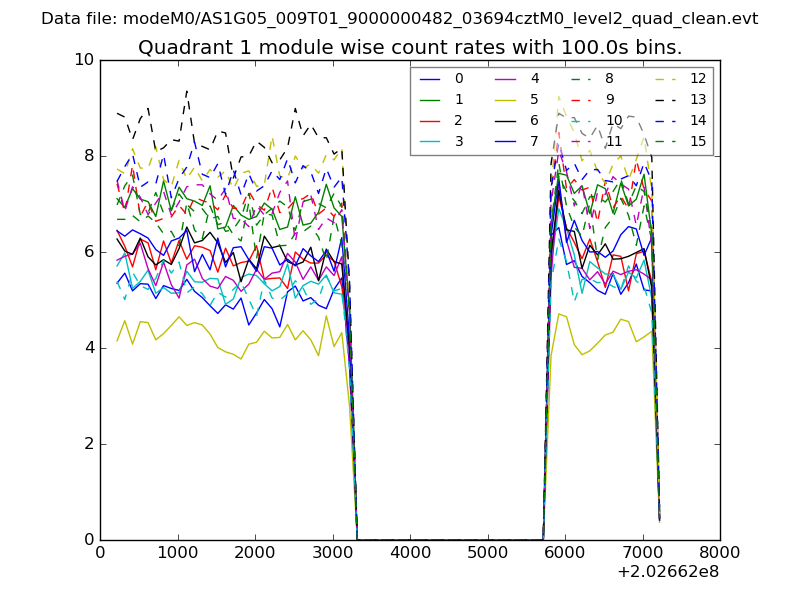
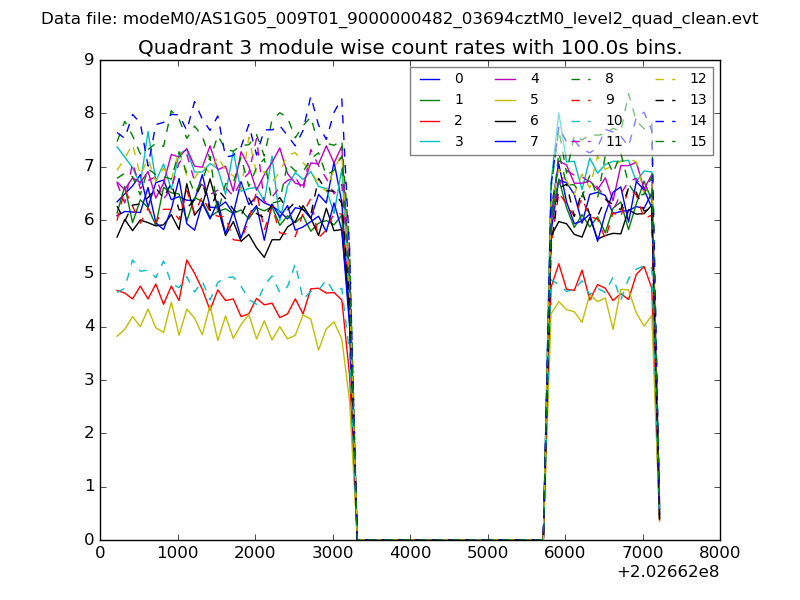
| Module-wise count rates for Quadrant A Data is divided into 100 sec bins |
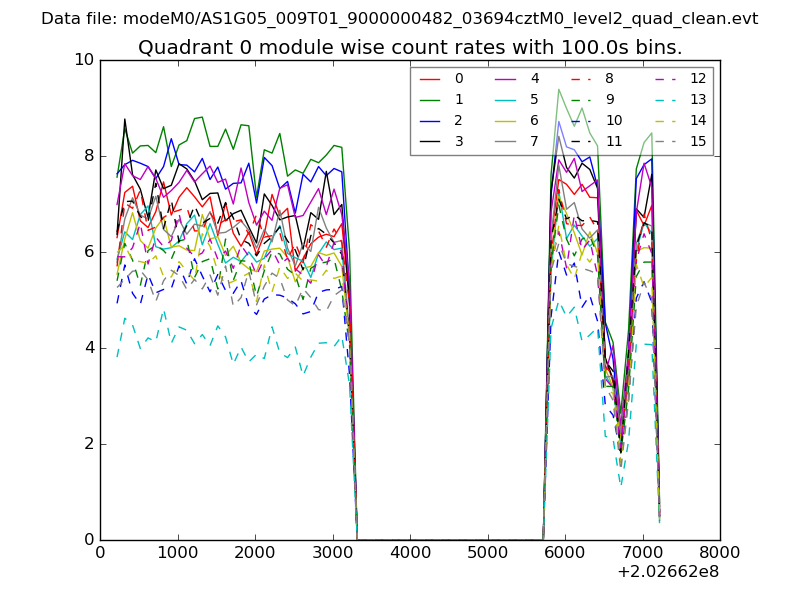 |
 |
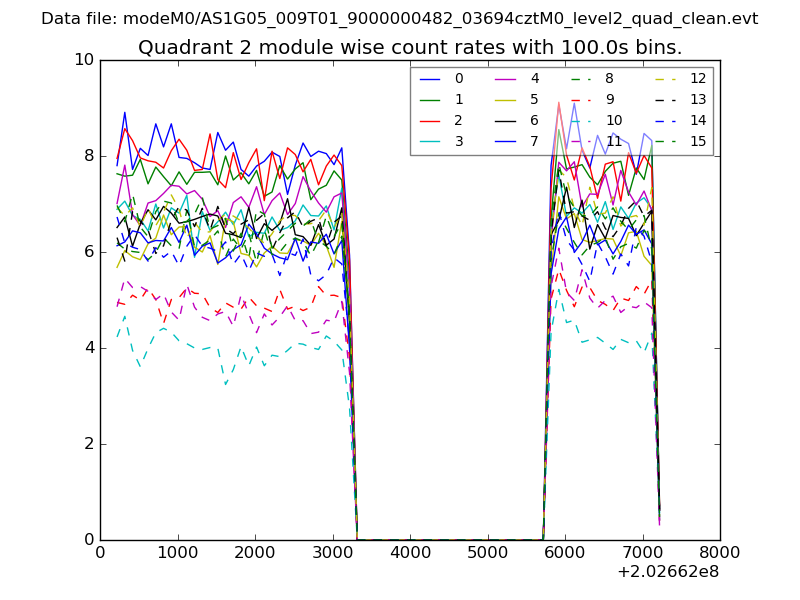
| Module-wise count rates for Quadrant B Data is divided into 100 sec bins |
 |
 |
| Module-wise count rates for Quadrant C Data is divided into 100 sec bins |
 |
 |
| Module-wise count rates for Quadrant D Data is divided into 100 sec bins |
 |
 |
| Parameter | Plot |
|---|---|
| CZT HV Monitor | 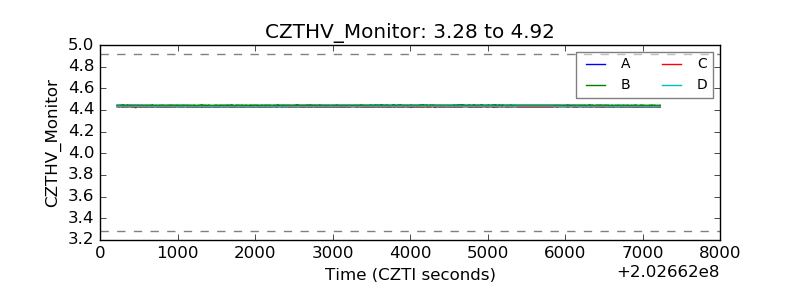 |
| D_VDD | 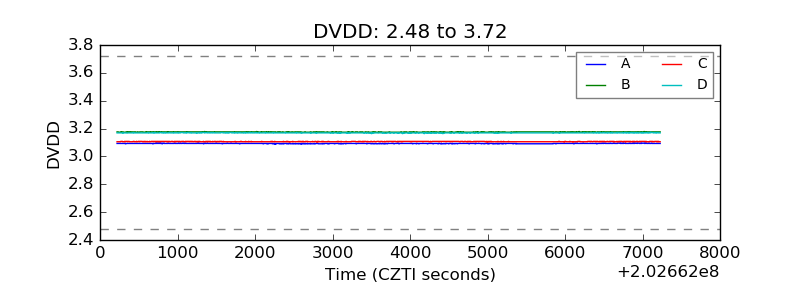 |
| Temperature 1 | 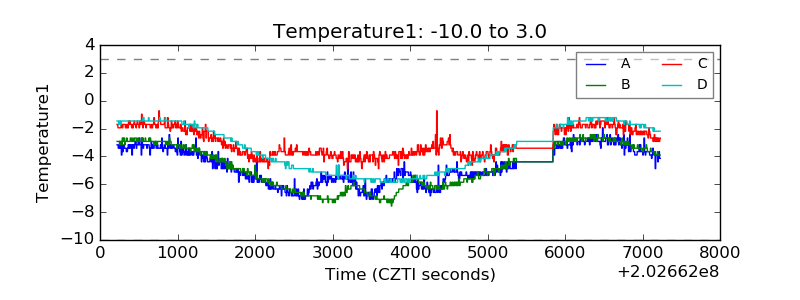 |
| Veto HV Monitor | 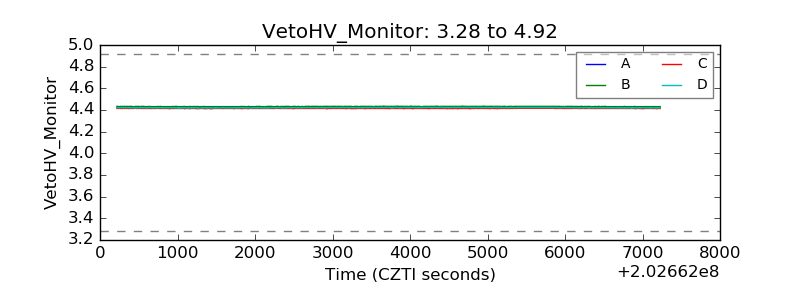 |
| Veto LLD | 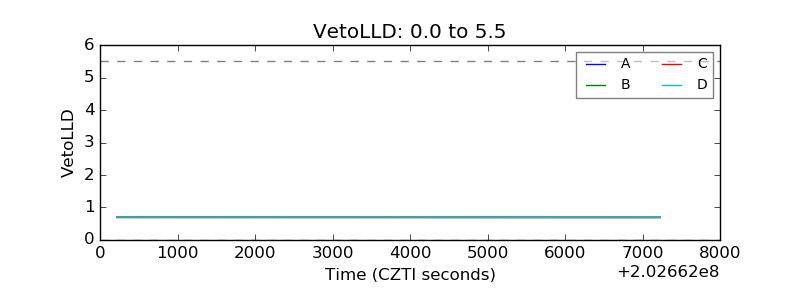 |
| Alpha Counter | 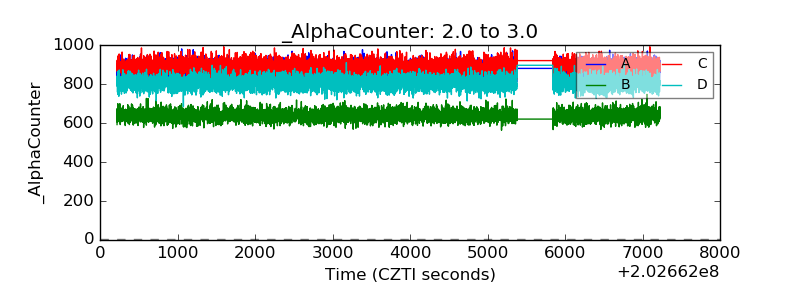 |
| _CPM_Rate | 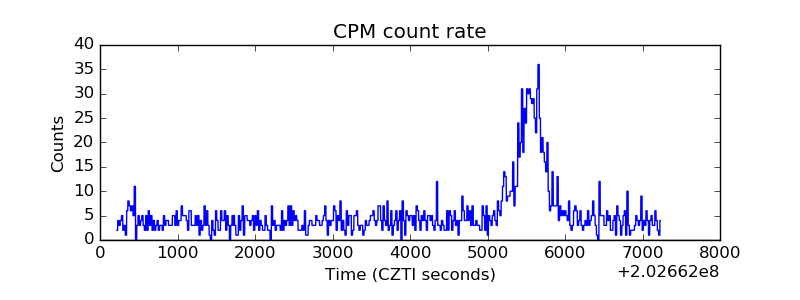 |
| CZT Counter | 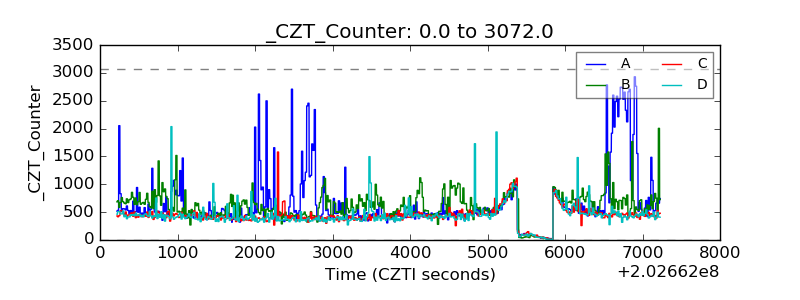 |
| +2.5 Volts monitor |  |
| +5 Volts monitor |  |
| Veto Counter | 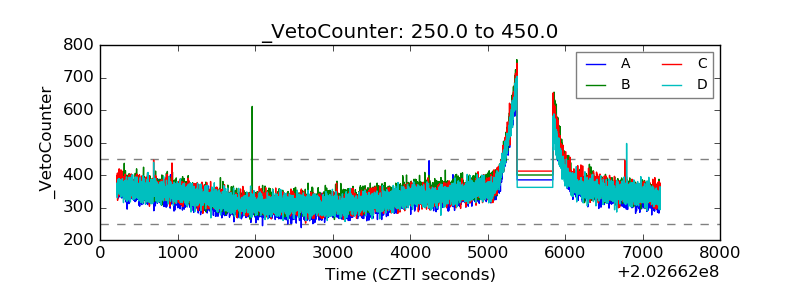 |