| Param | Original file | Final file |
|---|---|---|
| Filename | modeM0/AS1G05_009T01_9000000482_03695cztM0_level2.evt | modeM0/AS1G05_009T01_9000000482_03695cztM0_level2_quad_clean.evt |
| Size (bytes) | 551,730,240 | 89,144,640 |
| Size | 526.2 MB | 85.0 MB |
| Events in quadrant A | 4,629,701 | 530,987 |
| Events in quadrant B | 4,560,738 | 551,446 |
| Events in quadrant C | 3,463,977 | 553,319 |
| Events in quadrant D | 3,543,060 | 538,739 |
| Mode M9 | |||
|---|---|---|---|
| Quadrant | BADHDUFLAG | Total packets | Discarded packets |
| A | 0 | 4 | 0 |
| B | 0 | 4 | 0 |
| C | 0 | 4 | 0 |
| D | 0 | 5 | 0 |
| Mode SS | |||
|---|---|---|---|
| Quadrant | BADHDUFLAG | Total packets | Discarded packets |
| A | 0 | 152 | 0 |
| B | 0 | 152 | 0 |
| C | 0 | 152 | 0 |
| D | 0 | 152 | 0 |
| Mode M0 | |||
|---|---|---|---|
| Quadrant | BADHDUFLAG | Total packets | Discarded packets |
| A | 0 | 19062 | 3 |
| B | 0 | 18639 | 2 |
| C | 0 | 15727 | 2 |
| D | 0 | 16191 | 2 |
| Quadrant | Total seconds | Saturated seconds | Saturation percentage |
|---|---|---|---|
| A | 7551 | 419 | 5.548934% |
| B | 7551 | 187 | 2.476493% |
| C | 7551 | 30 | 0.397298% |
| D | 7551 | 63 | 0.834327% |
Noise dominated data is calculated using 1-second bins in cleaned event files. If a bin has >2000 counts, and if more than 50% of those come from <1% of pixels, then it is considered to be noise-dominated and hence unusable.
| Quadrant | # 1 sec bins | Bins with >0 counts | Bins with >2000 counts | High rate bins dominated by noise | Noise dominated (total time) | Noise dominated (detector-on time) | Marked lightcurve |
|---|---|---|---|---|---|---|---|
| A | 7846 | 7553 | 307 | 307 | 3.91% | 4.06% | 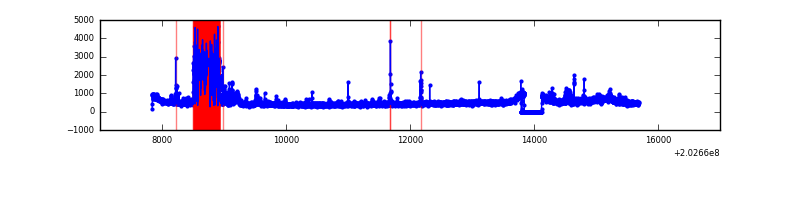 |
| B | 7846 | 7553 | 81 | 81 | 1.03% | 1.07% | 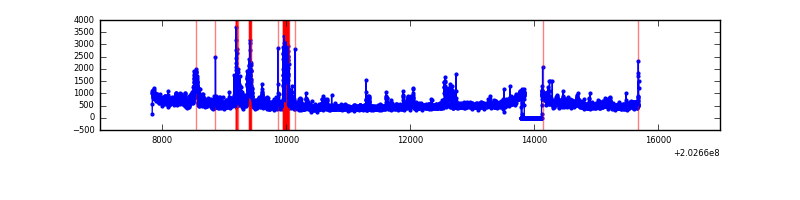 |
| C | 7846 | 7553 | 5 | 5 | 0.06% | 0.07% | 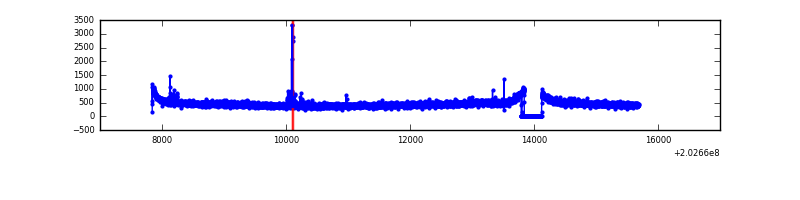 |
| D | 7846 | 7553 | 32 | 32 | 0.41% | 0.42% | 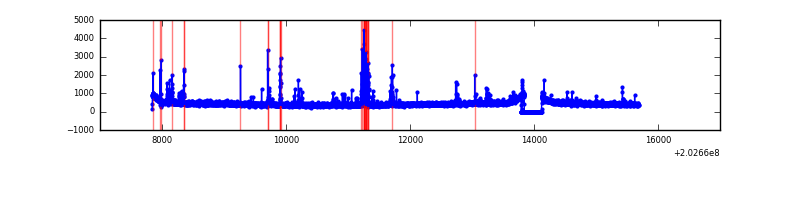 |
Top three noisy pixels from each quadrant. If the there are fewer than three noisy pixels in the level2.evt file, extra rows are filled as -1
| Pixel properties | Quadrant properties | ||||||
|---|---|---|---|---|---|---|---|
| Quadrant | DetID | PixID | Counts | Sigma | Mean | Median | Sigma |
| A | 13 | 251 | 901289 | 5009.7 | 871 | 850 | 179.7 |
| A | 13 | 164 | 187240 | 1037.0 | 871 | 850 | 179.7 |
| A | 0 | 50 | 118455 | 654.31 | 871 | 850 | 179.7 |
| B | 15 | 204 | 380532 | 2151.09 | 902 | 879 | 176.5 |
| B | 14 | 167 | 189750 | 1070.13 | 902 | 879 | 176.5 |
| B | 4 | 81 | 163646 | 922.23 | 902 | 879 | 176.5 |
| C | 9 | 247 | 40402 | 192.57 | 871 | 873 | 205.3 |
| C | 2 | 53 | 11961 | 54.02 | 871 | 873 | 205.3 |
| C | 13 | 61 | 7277 | 31.2 | 871 | 873 | 205.3 |
| D | 13 | 239 | 101867 | 474.53 | 869 | 843 | 212.9 |
| D | 5 | 233 | 78829 | 366.32 | 869 | 843 | 212.9 |
| D | 13 | 223 | 33558 | 153.67 | 869 | 843 | 212.9 |
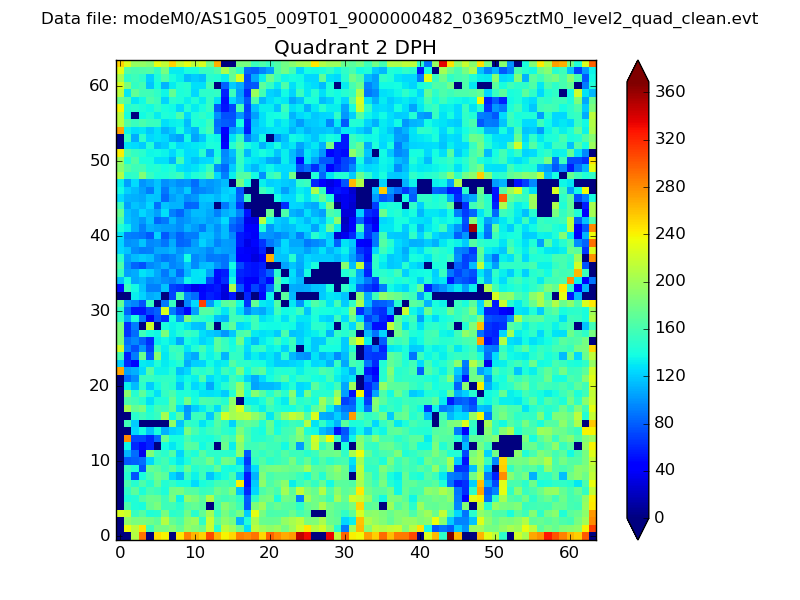
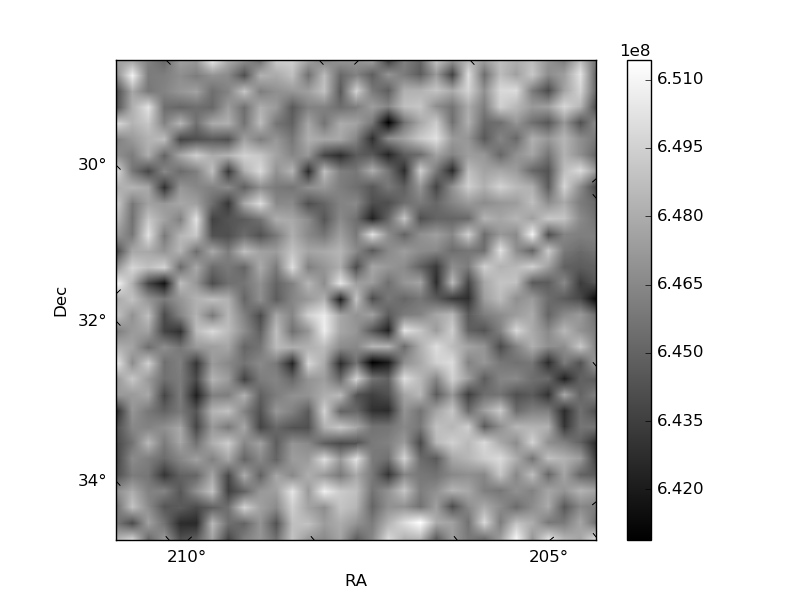
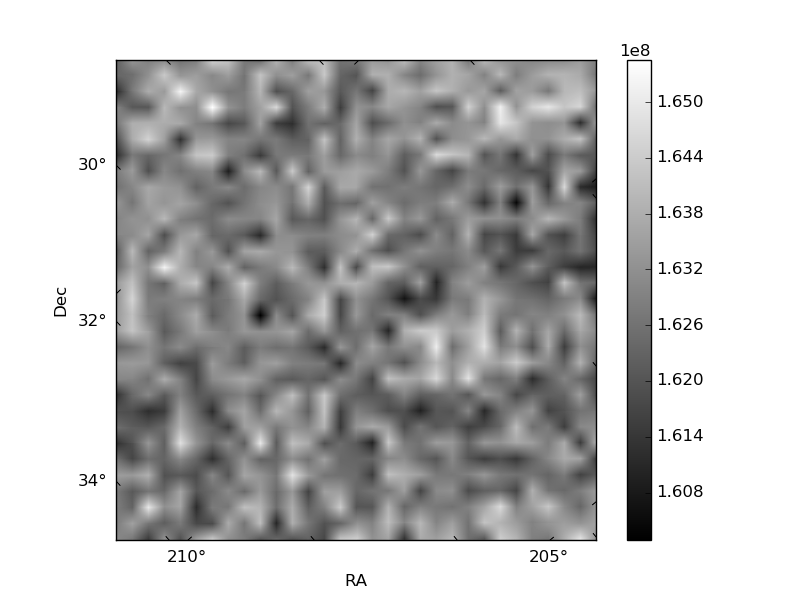
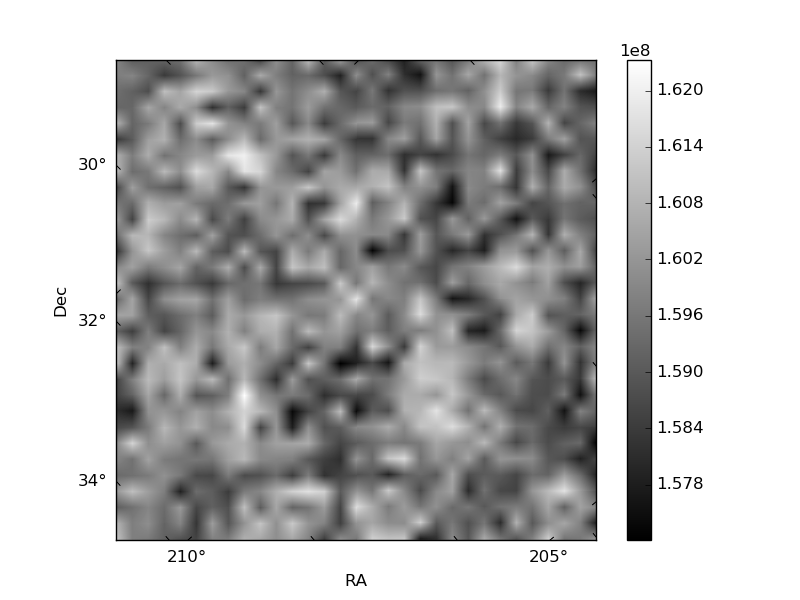
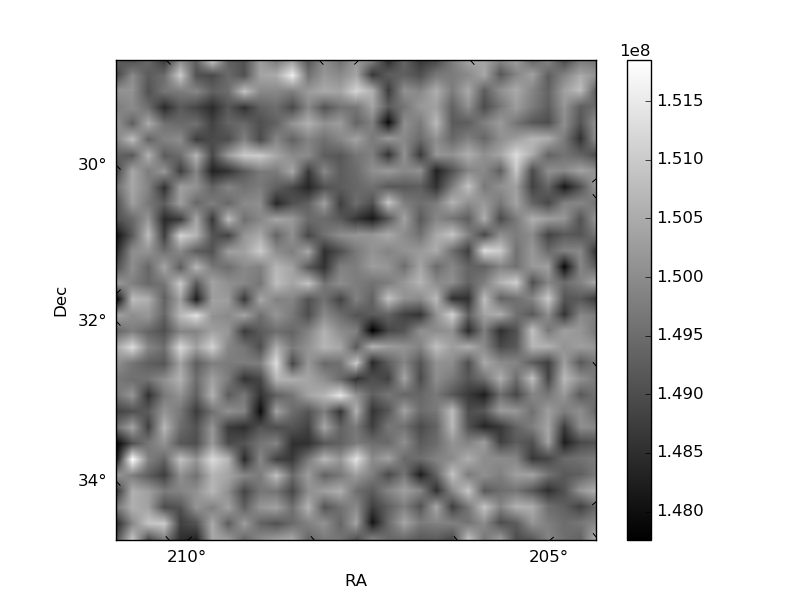
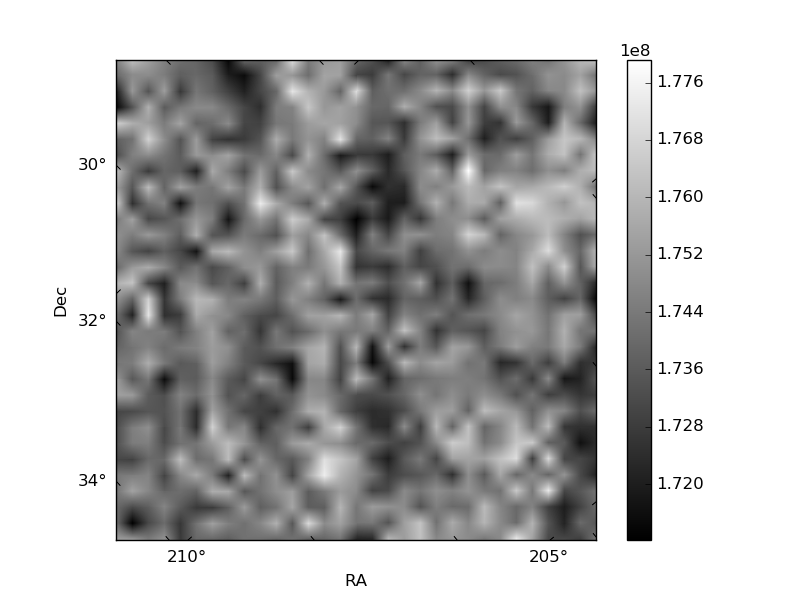
Histogram calculated using DETX and DETY for each event in the final _common_clean file
| Quadrant A | 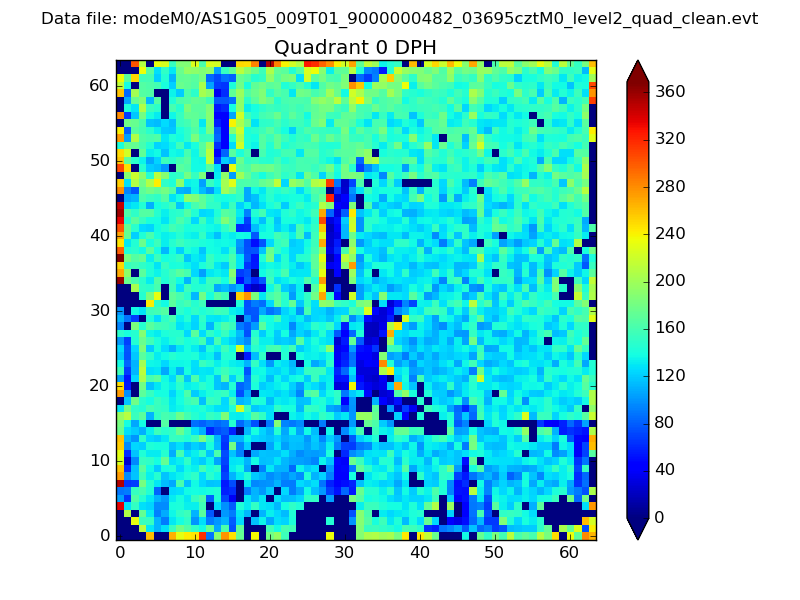 |
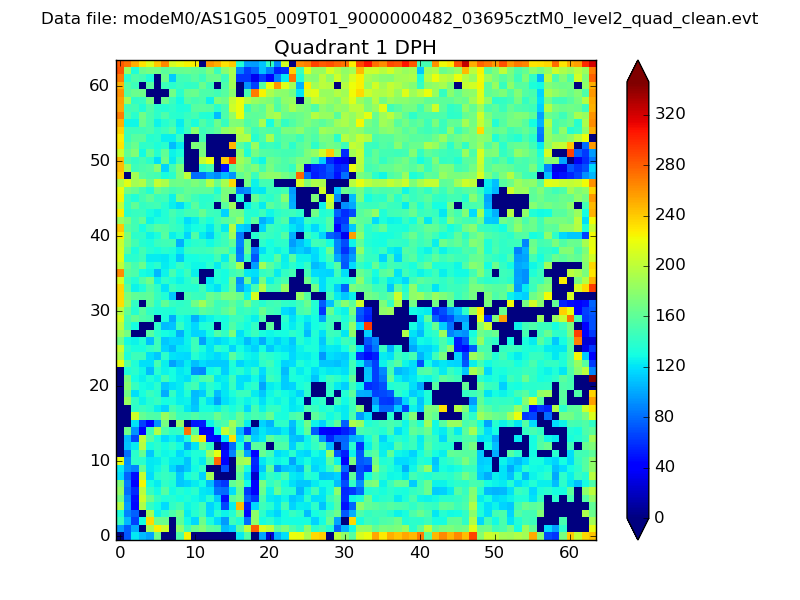 |
Quadrant B |
|---|---|---|---|
| Quadrant D | 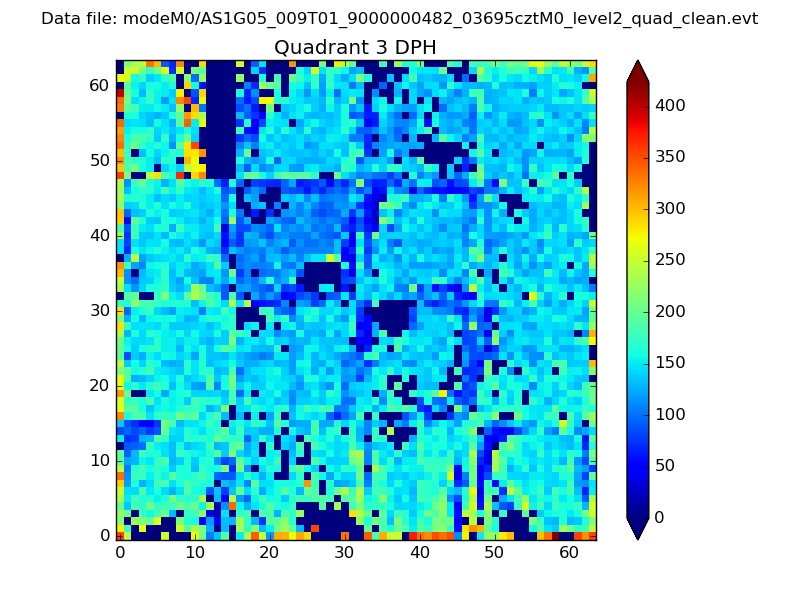 |
 |
Quadrant C |
| Plot type | Count rate plots | Images |
|---|---|---|
| Comparison with Poisson distribution Blue bars denote a histogram of data divided into 1 sec bins. Red curve is a Poisson curve with rate = median count rate of data. |
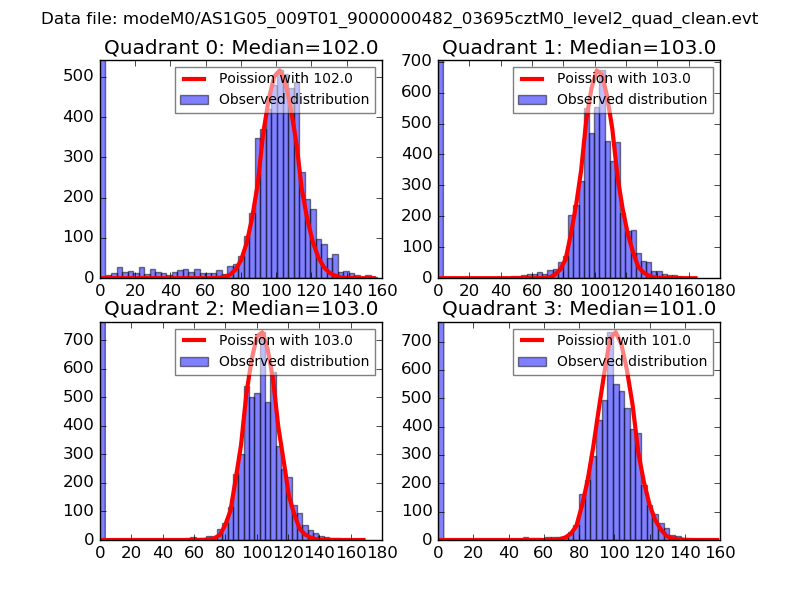 |
 |
| Quadrant-wise count rates Data is divided into 100 sec bins |
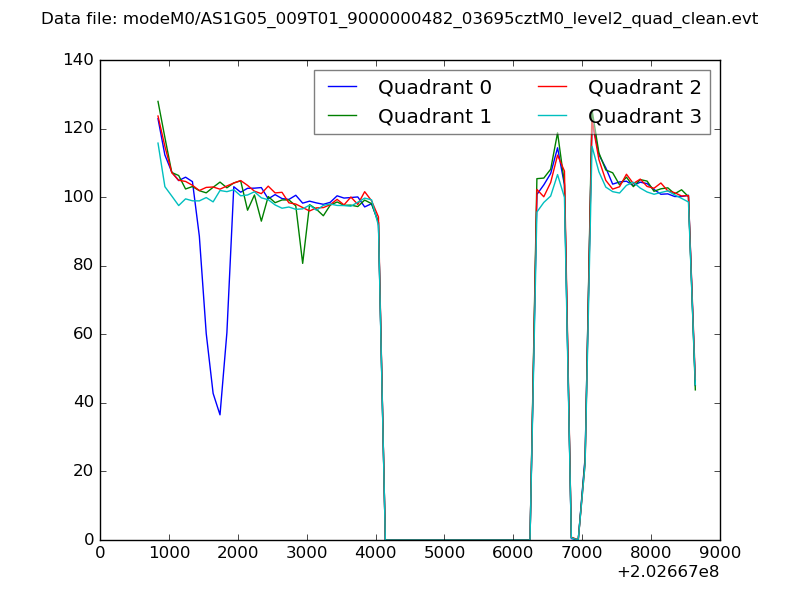 |
|
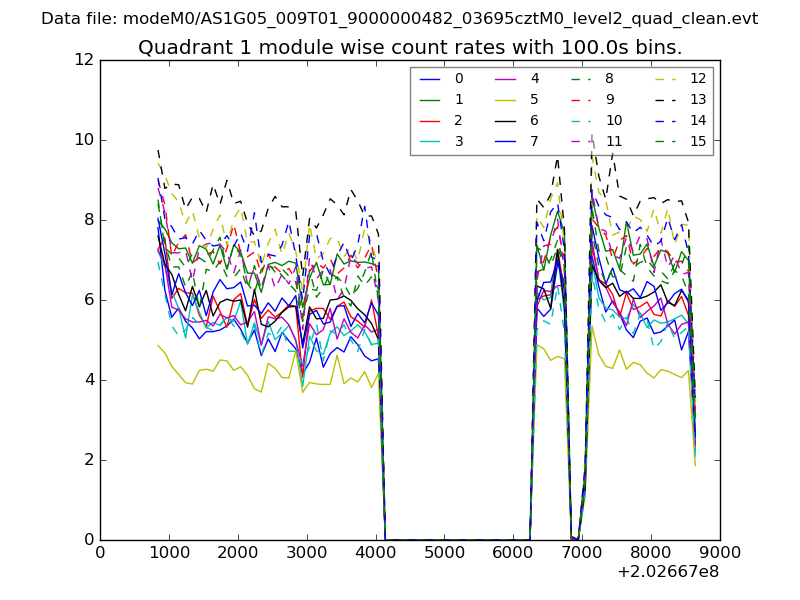
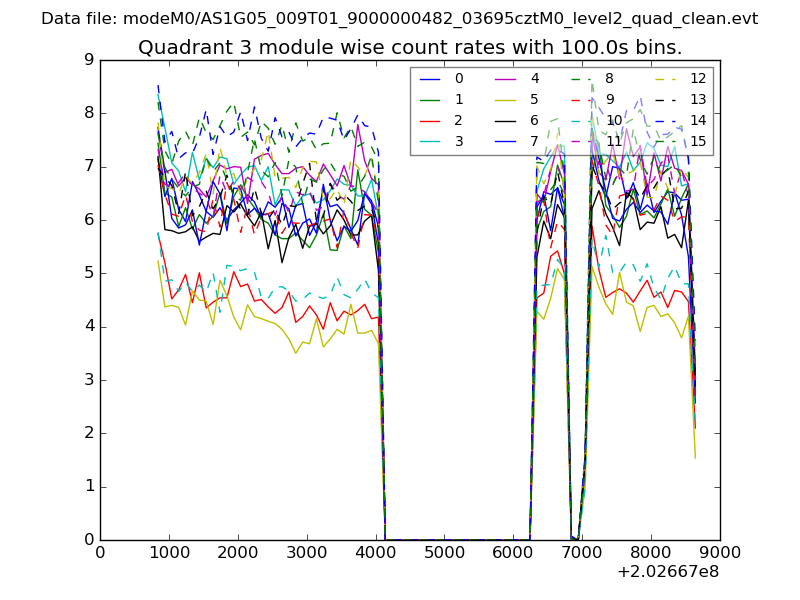
| Module-wise count rates for Quadrant A Data is divided into 100 sec bins |
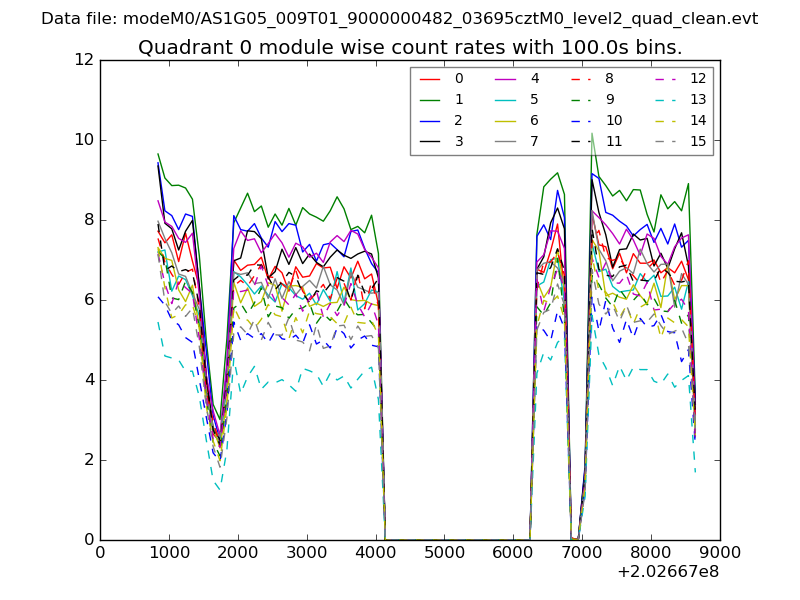 |
 |
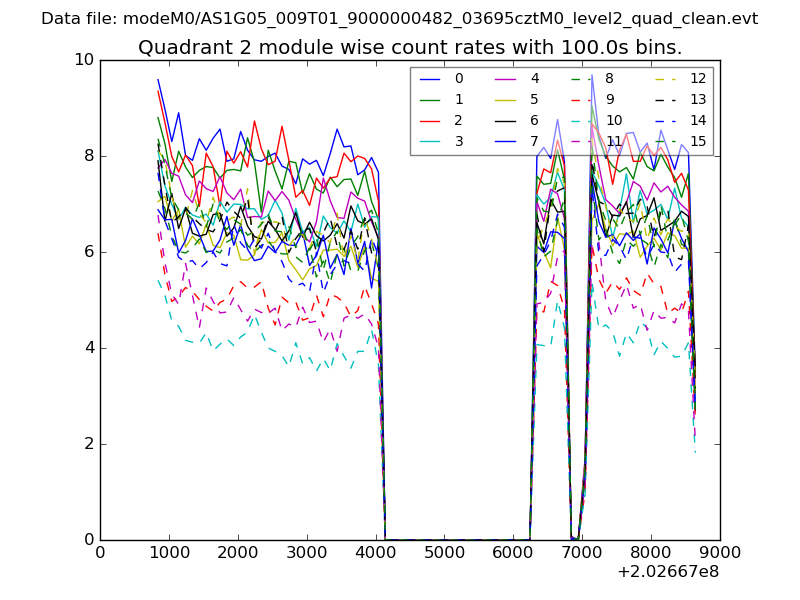
| Module-wise count rates for Quadrant B Data is divided into 100 sec bins |
 |
 |
| Module-wise count rates for Quadrant C Data is divided into 100 sec bins |
 |
 |
| Module-wise count rates for Quadrant D Data is divided into 100 sec bins |
 |
 |
| Parameter | Plot |
|---|---|
| CZT HV Monitor | 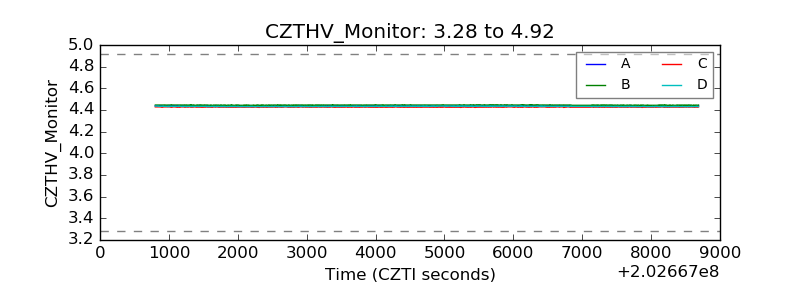 |
| D_VDD | 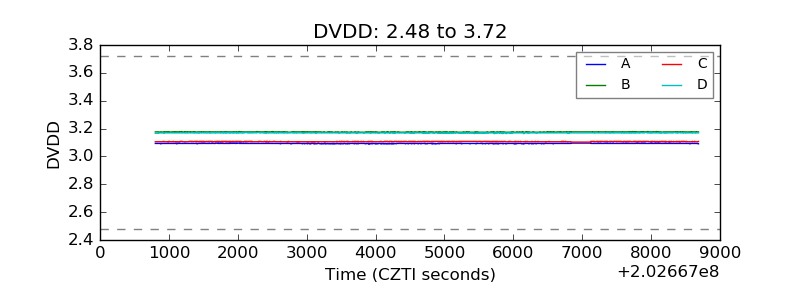 |
| Temperature 1 | 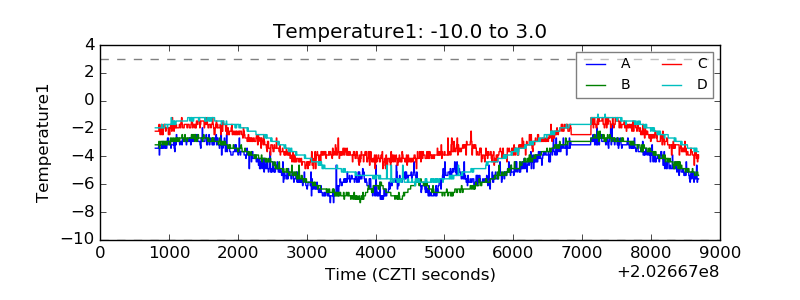 |
| Veto HV Monitor | 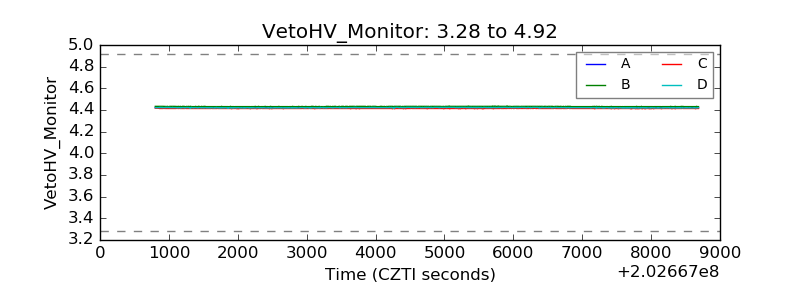 |
| Veto LLD | 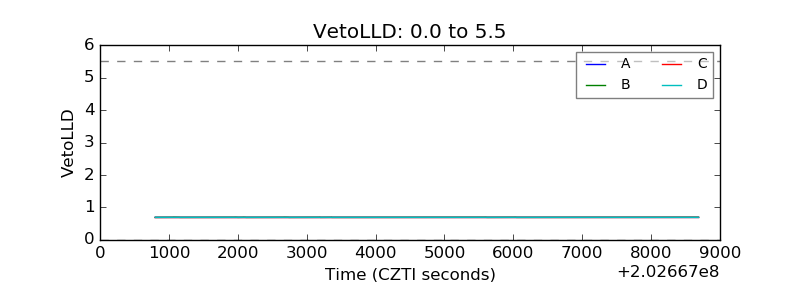 |
| Alpha Counter | 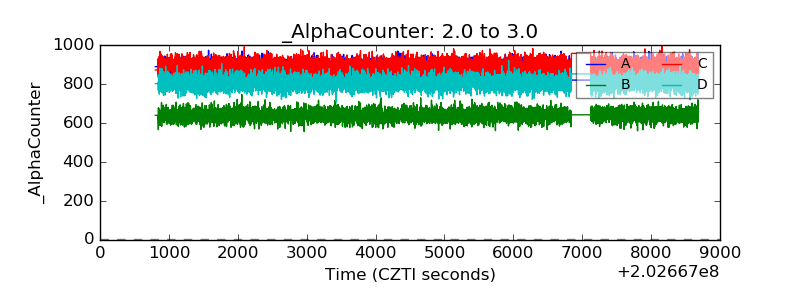 |
| _CPM_Rate | 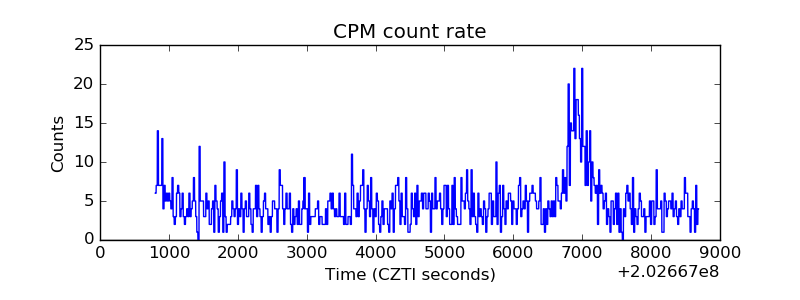 |
| CZT Counter | 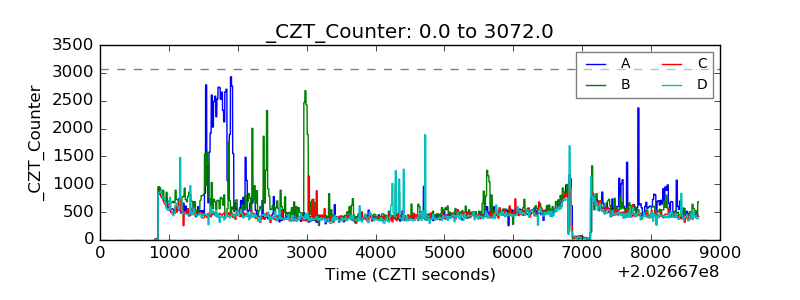 |
| +2.5 Volts monitor | 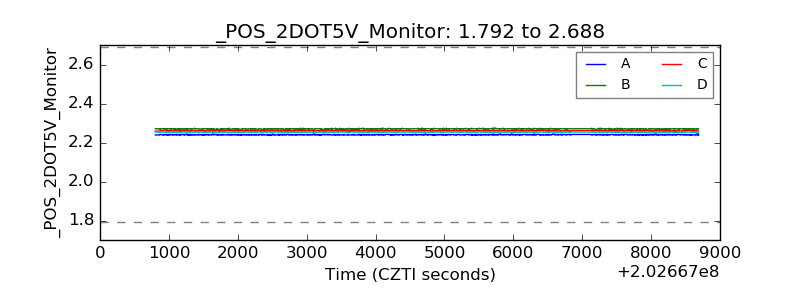 |
| +5 Volts monitor |  |
| Veto Counter | 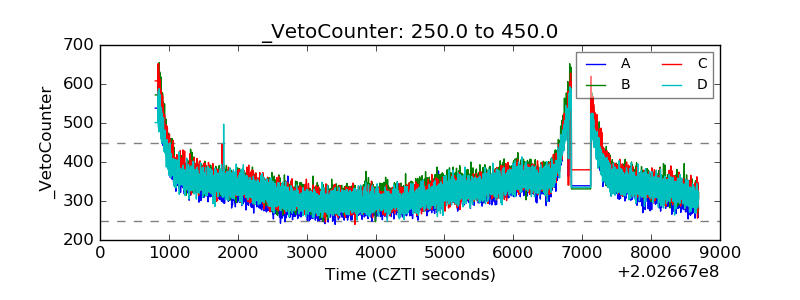 |