| Param | Original file | Final file |
|---|---|---|
| Filename | modeM0/AS1G05_009T01_9000000482_03696cztM0_level2.evt | modeM0/AS1G05_009T01_9000000482_03696cztM0_level2_quad_clean.evt |
| Size (bytes) | 532,457,280 | 89,455,680 |
| Size | 507.8 MB | 85.3 MB |
| Events in quadrant A | 4,177,835 | 544,315 |
| Events in quadrant B | 4,556,129 | 551,038 |
| Events in quadrant C | 3,407,844 | 551,204 |
| Events in quadrant D | 3,472,421 | 538,307 |
| Mode M9 | |||
|---|---|---|---|
| Quadrant | BADHDUFLAG | Total packets | Discarded packets |
| A | 0 | 2 | 0 |
| B | 0 | 2 | 0 |
| C | 0 | 2 | 0 |
| D | 0 | 3 | 0 |
| Mode SS | |||
|---|---|---|---|
| Quadrant | BADHDUFLAG | Total packets | Discarded packets |
| A | 0 | 154 | 0 |
| B | 0 | 154 | 0 |
| C | 0 | 154 | 0 |
| D | 0 | 154 | 0 |
| Mode M0 | |||
|---|---|---|---|
| Quadrant | BADHDUFLAG | Total packets | Discarded packets |
| A | 0 | 17702 | 3 |
| B | 0 | 18574 | 2 |
| C | 0 | 15559 | 2 |
| D | 0 | 15987 | 2 |
| Quadrant | Total seconds | Saturated seconds | Saturation percentage |
|---|---|---|---|
| A | 7526 | 224 | 2.976349% |
| B | 7526 | 169 | 2.245549% |
| C | 7526 | 28 | 0.372044% |
| D | 7526 | 43 | 0.571353% |
Noise dominated data is calculated using 1-second bins in cleaned event files. If a bin has >2000 counts, and if more than 50% of those come from <1% of pixels, then it is considered to be noise-dominated and hence unusable.
| Quadrant | # 1 sec bins | Bins with >0 counts | Bins with >2000 counts | High rate bins dominated by noise | Noise dominated (total time) | Noise dominated (detector-on time) | Marked lightcurve |
|---|---|---|---|---|---|---|---|
| A | 7796 | 7527 | 129 | 129 | 1.65% | 1.71% | 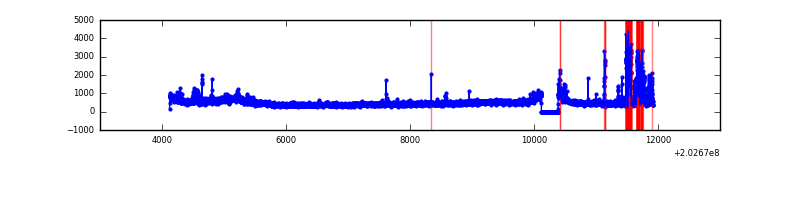 |
| B | 7796 | 7527 | 67 | 67 | 0.86% | 0.89% | 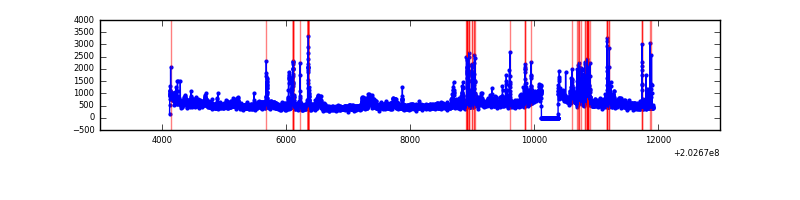 |
| C | 7796 | 7527 | 0 | 0 | 0.00% | 0.00% | 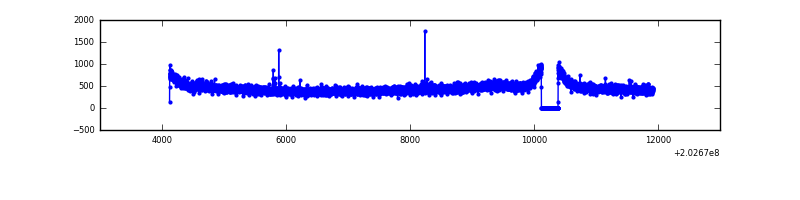 |
| D | 7796 | 7527 | 14 | 14 | 0.18% | 0.19% | 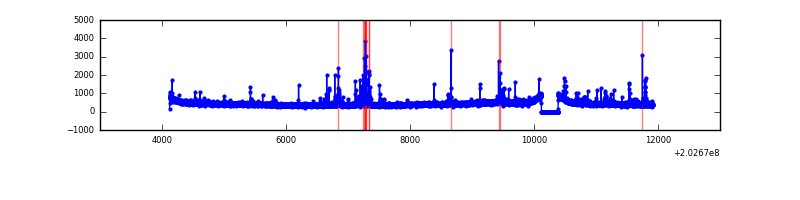 |
Top three noisy pixels from each quadrant. If the there are fewer than three noisy pixels in the level2.evt file, extra rows are filled as -1
| Pixel properties | Quadrant properties | ||||||
|---|---|---|---|---|---|---|---|
| Quadrant | DetID | PixID | Counts | Sigma | Mean | Median | Sigma |
| A | 13 | 251 | 458168 | 2526.37 | 875 | 852 | 181.0 |
| A | 13 | 164 | 200078 | 1100.59 | 875 | 852 | 181.0 |
| A | 0 | 50 | 85223 | 466.09 | 875 | 852 | 181.0 |
| B | 14 | 167 | 471406 | 2700.84 | 890 | 868 | 174.2 |
| B | 15 | 204 | 401400 | 2299.01 | 890 | 868 | 174.2 |
| B | 5 | 70 | 121883 | 694.61 | 890 | 868 | 174.2 |
| C | 2 | 53 | 11534 | 52.69 | 864 | 867 | 202.4 |
| C | 13 | 61 | 7264 | 31.6 | 864 | 867 | 202.4 |
| C | 8 | 128 | 6338 | 27.02 | 864 | 867 | 202.4 |
| D | 13 | 239 | 96818 | 458.03 | 861 | 836 | 209.6 |
| D | 13 | 223 | 42916 | 200.81 | 861 | 836 | 209.6 |
| D | 5 | 233 | 39038 | 182.3 | 861 | 836 | 209.6 |
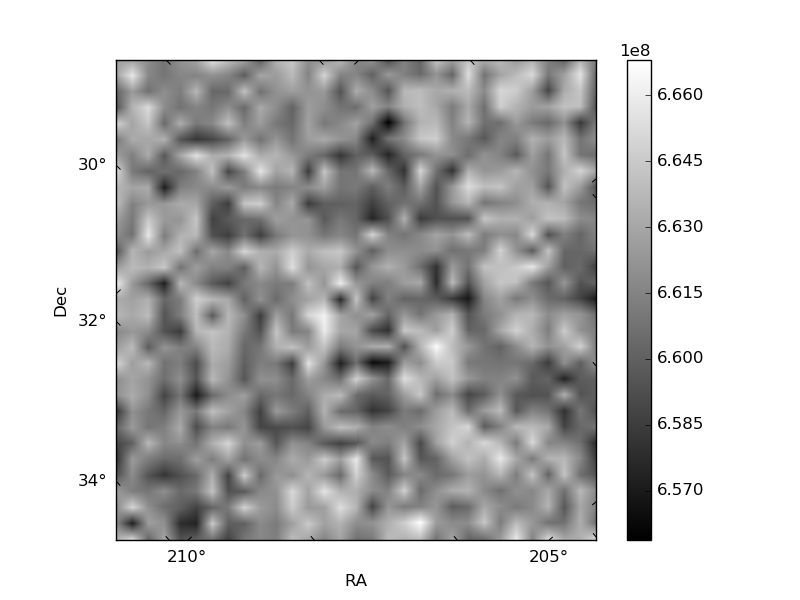
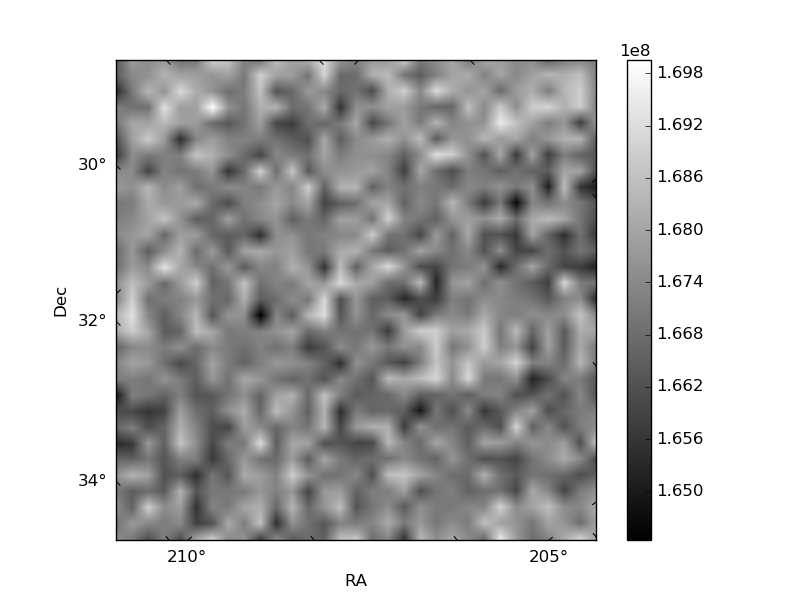
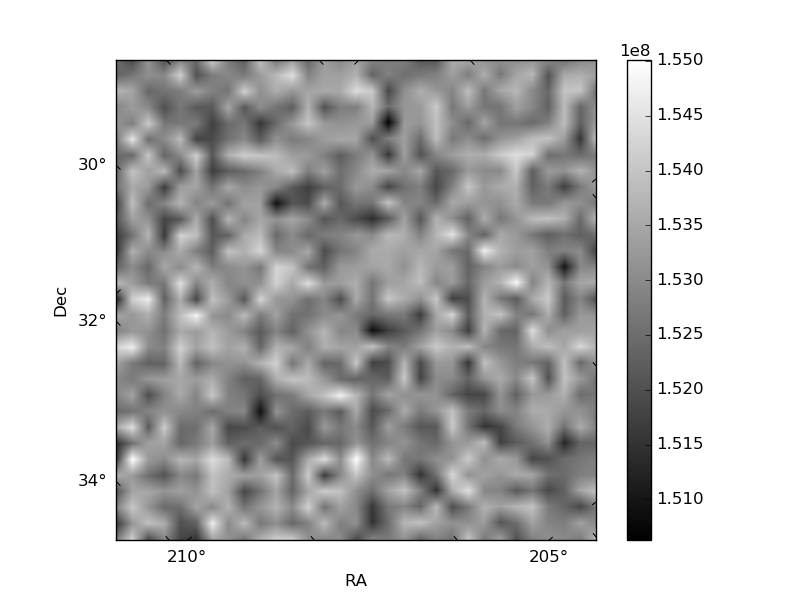
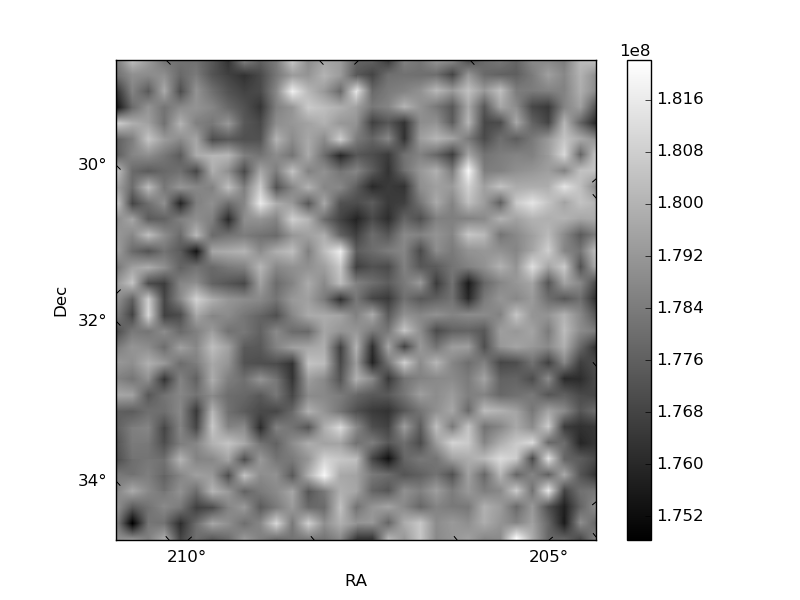
Histogram calculated using DETX and DETY for each event in the final _common_clean file
| Quadrant A | 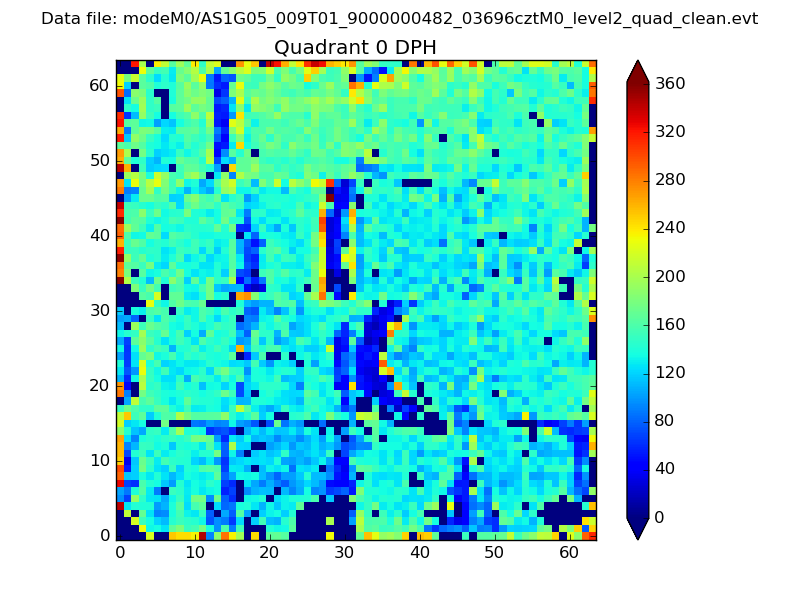 |
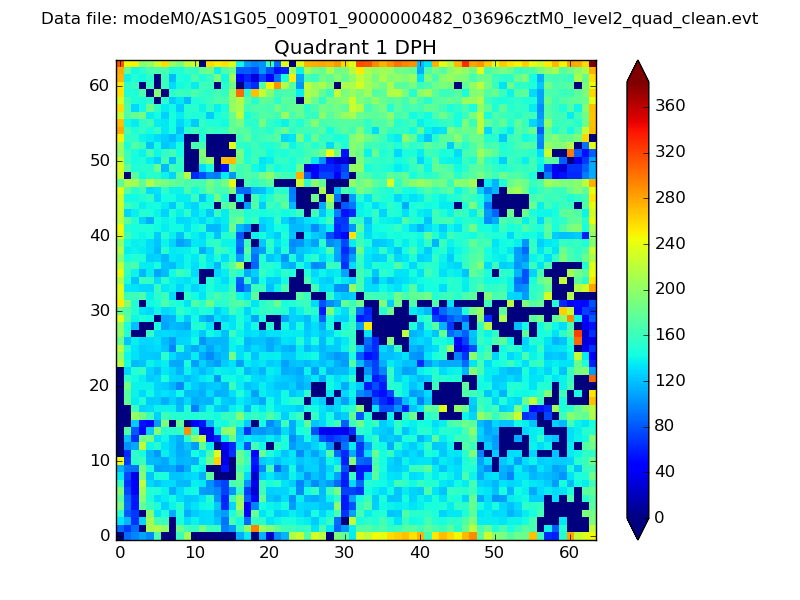 |
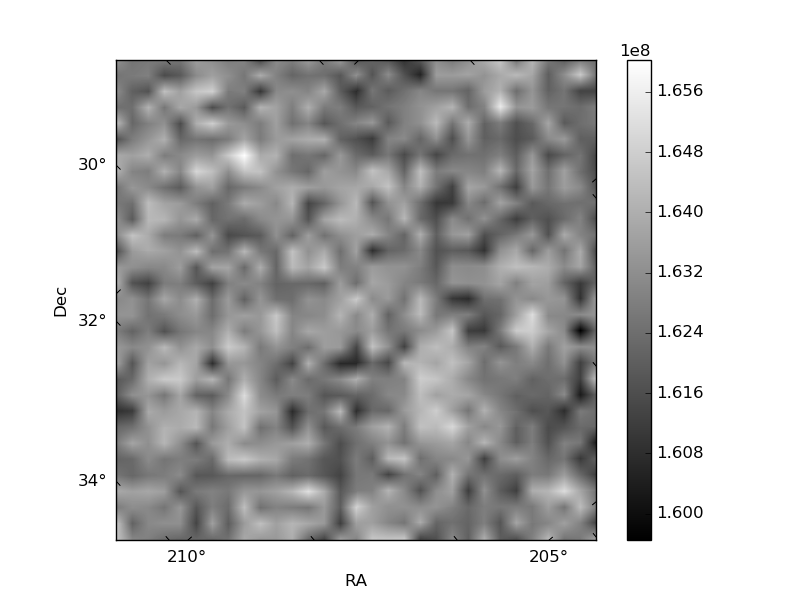
Quadrant B |
|---|---|---|---|
| Quadrant D | 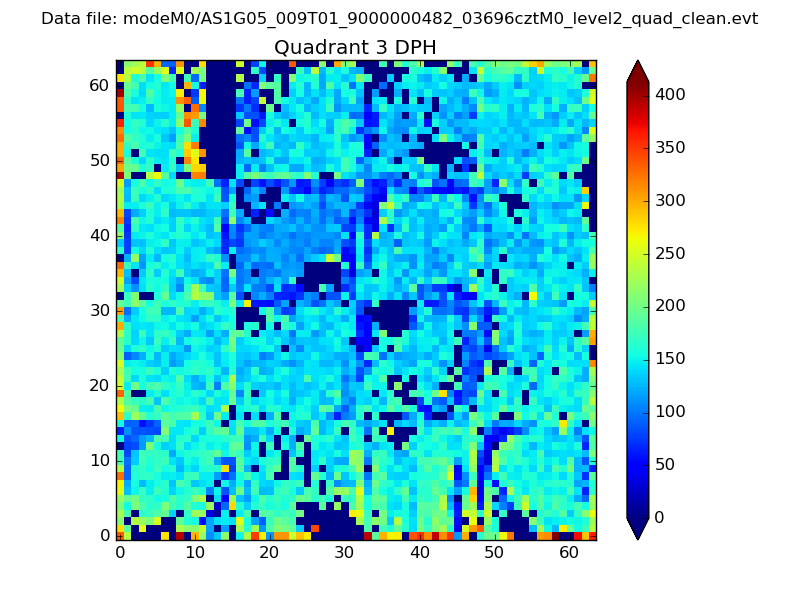 |
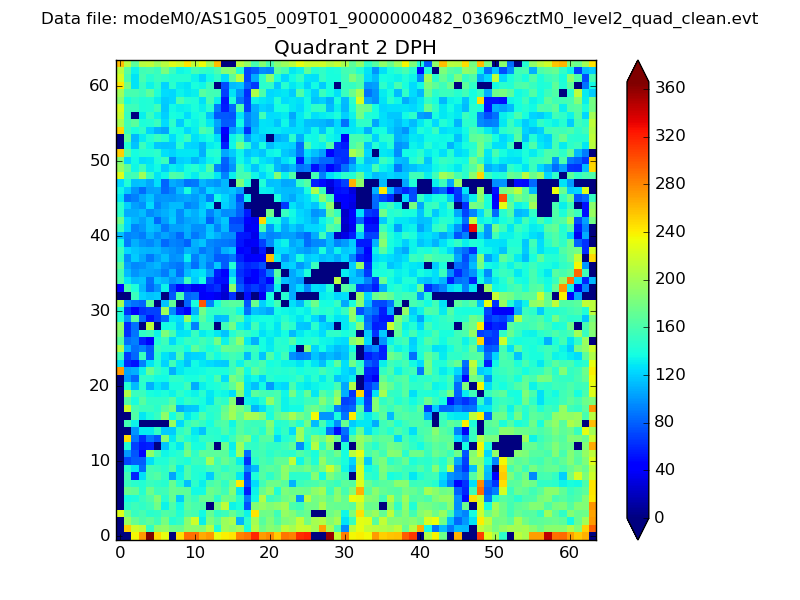 |
Quadrant C |
| Plot type | Count rate plots | Images |
|---|---|---|
| Comparison with Poisson distribution Blue bars denote a histogram of data divided into 1 sec bins. Red curve is a Poisson curve with rate = median count rate of data. |
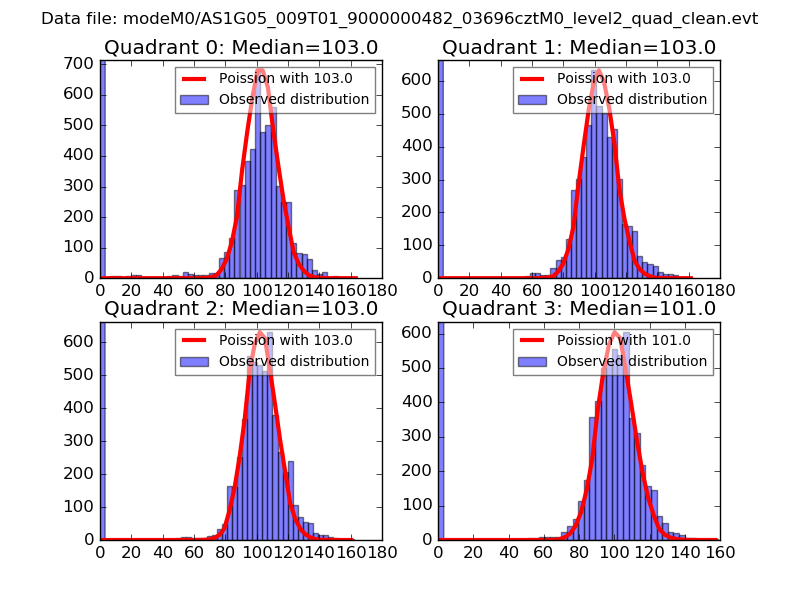 |
 |
| Quadrant-wise count rates Data is divided into 100 sec bins |
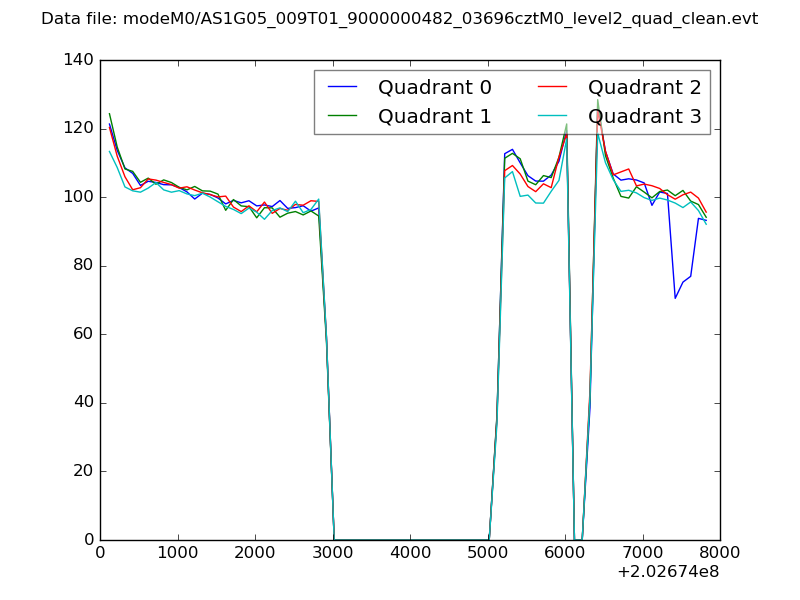 |
|
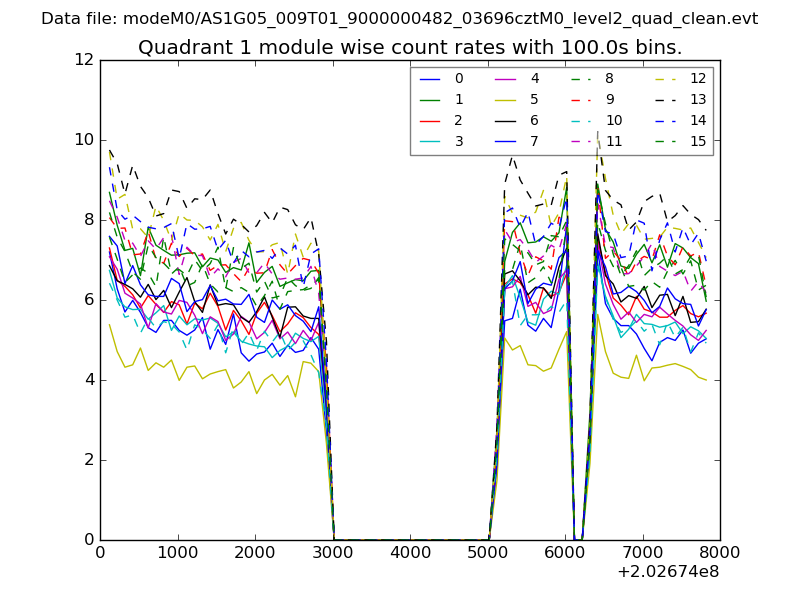
| Module-wise count rates for Quadrant A Data is divided into 100 sec bins |
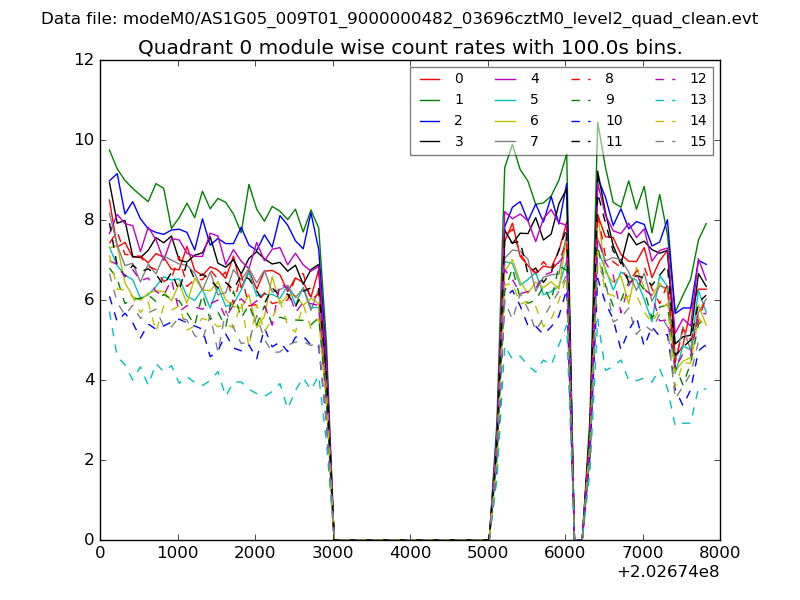 |
 |
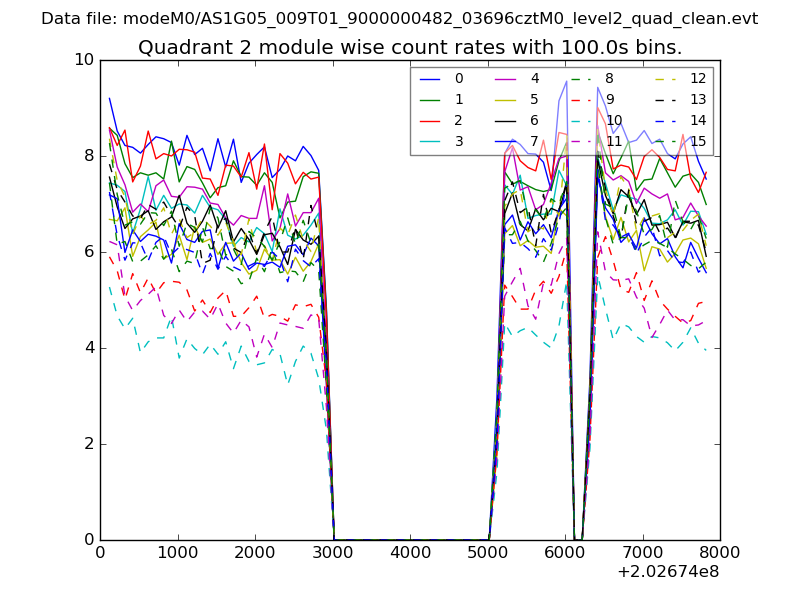
| Module-wise count rates for Quadrant B Data is divided into 100 sec bins |
 |
 |
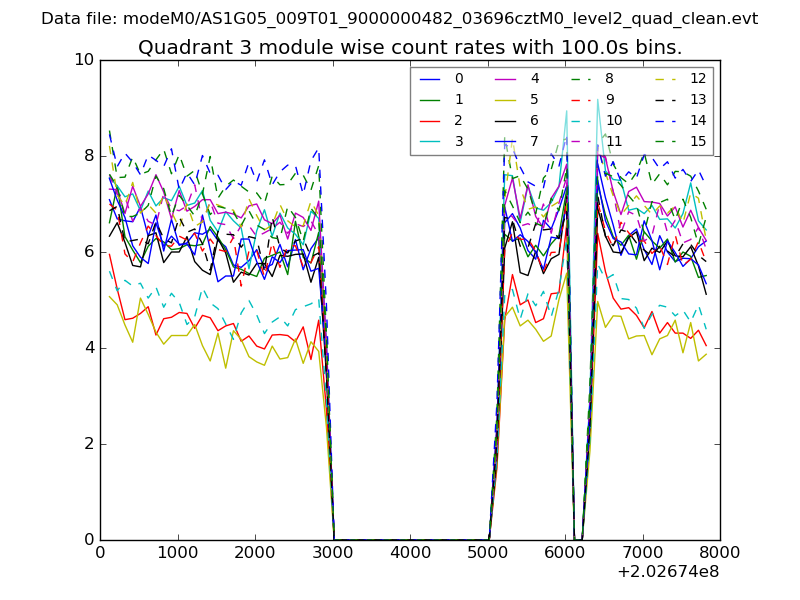
| Module-wise count rates for Quadrant C Data is divided into 100 sec bins |
 |
 |
| Module-wise count rates for Quadrant D Data is divided into 100 sec bins |
 |
 |
| Parameter | Plot |
|---|---|
| CZT HV Monitor | 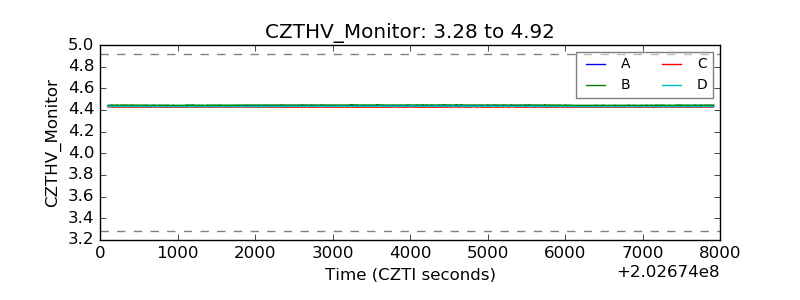 |
| D_VDD | 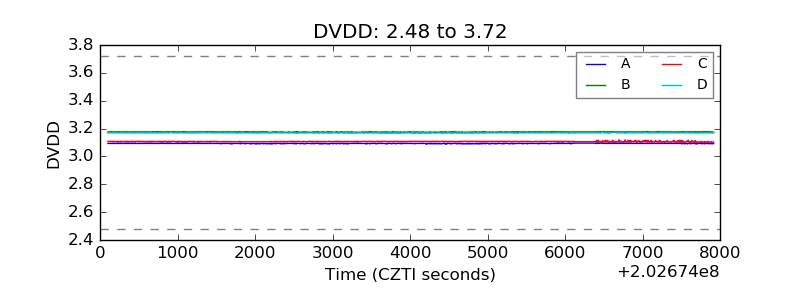 |
| Temperature 1 | 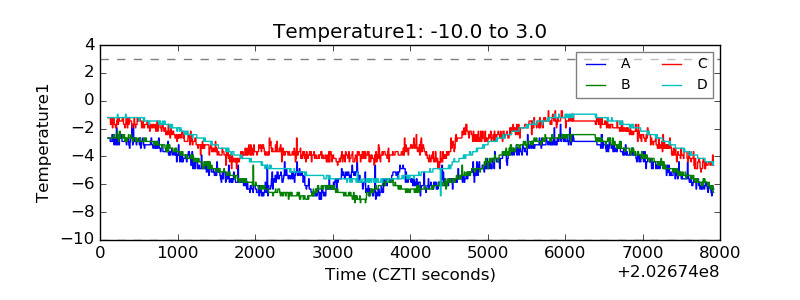 |
| Veto HV Monitor | 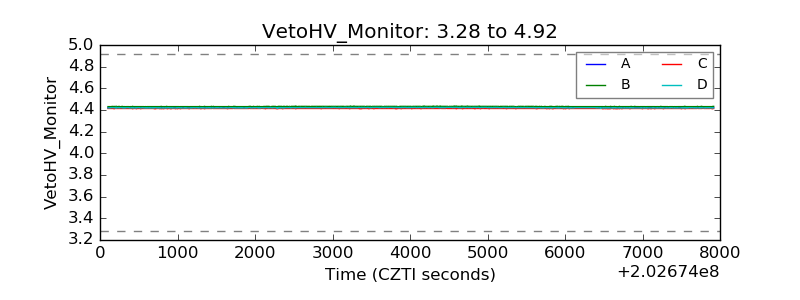 |
| Veto LLD | 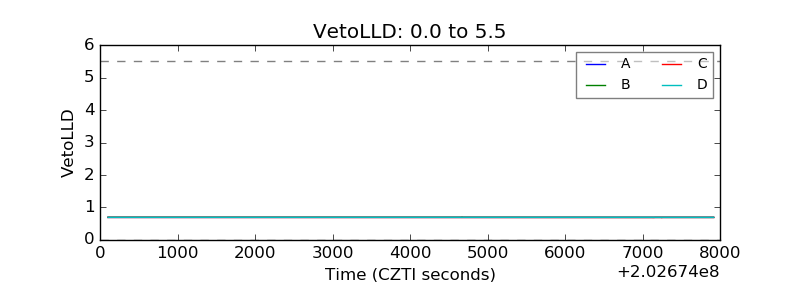 |
| Alpha Counter | 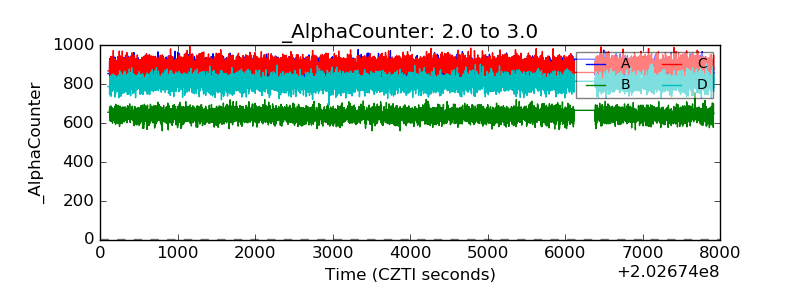 |
| _CPM_Rate | 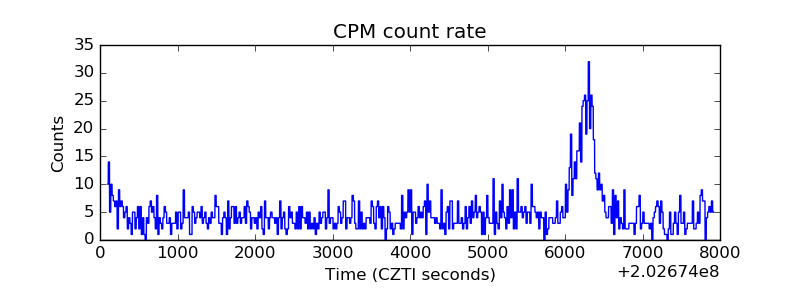 |
| CZT Counter | 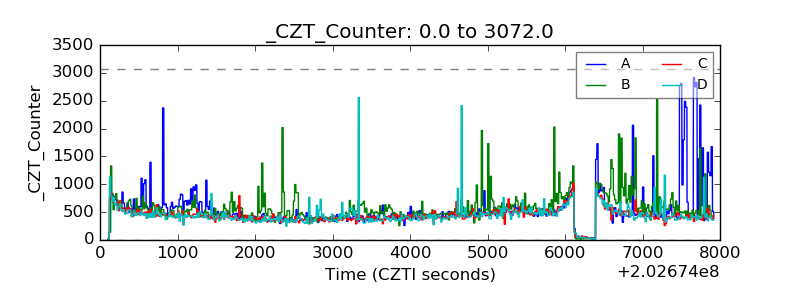 |
| +2.5 Volts monitor |  |
| +5 Volts monitor |  |
| Veto Counter | 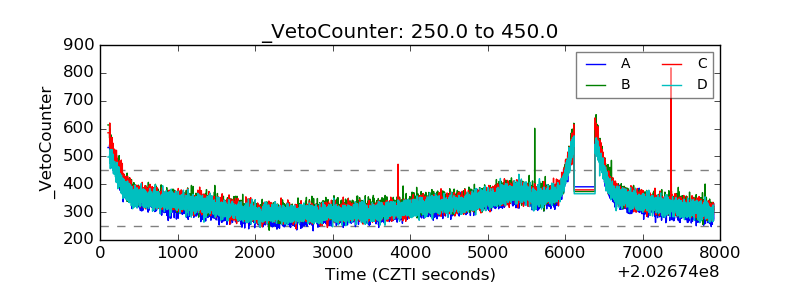 |