| Param | Original file | Final file |
|---|---|---|
| Filename | modeM0/AS1G05_009T01_9000000482_03699cztM0_level2.evt | modeM0/AS1G05_009T01_9000000482_03699cztM0_level2_quad_clean.evt |
| Size (bytes) | 1,559,312,640 | 203,970,240 |
| Size | 1.5 GB | 194.5 MB |
| Events in quadrant A | 13,388,688 | 1,162,091 |
| Events in quadrant B | 12,136,870 | 1,248,308 |
| Events in quadrant C | 8,770,145 | 1,244,287 |
| Events in quadrant D | 11,637,508 | 1,204,395 |
| Mode M9 | |||
|---|---|---|---|
| Quadrant | BADHDUFLAG | Total packets | Discarded packets |
| A | 0 | 21 | 0 |
| B | 0 | 21 | 0 |
| C | 0 | 21 | 0 |
| D | 0 | 21 | 0 |
| Mode SS | |||
|---|---|---|---|
| Quadrant | BADHDUFLAG | Total packets | Discarded packets |
| A | 0 | 392 | 0 |
| B | 0 | 392 | 0 |
| C | 0 | 392 | 0 |
| D | 0 | 392 | 0 |
| Mode M0 | |||
|---|---|---|---|
| Quadrant | BADHDUFLAG | Total packets | Discarded packets |
| A | 0 | 53293 | 5 |
| B | 0 | 48942 | 4 |
| C | 0 | 39391 | 4 |
| D | 0 | 48725 | 4 |
| Quadrant | Total seconds | Saturated seconds | Saturation percentage |
|---|---|---|---|
| A | 19117 | 1865 | 9.755715% |
| B | 19117 | 448 | 2.343464% |
| C | 19117 | 59 | 0.308626% |
| D | 19117 | 806 | 4.216143% |
Noise dominated data is calculated using 1-second bins in cleaned event files. If a bin has >2000 counts, and if more than 50% of those come from <1% of pixels, then it is considered to be noise-dominated and hence unusable.
| Quadrant | # 1 sec bins | Bins with >0 counts | Bins with >2000 counts | High rate bins dominated by noise | Noise dominated (total time) | Noise dominated (detector-on time) | Marked lightcurve |
|---|---|---|---|---|---|---|---|
| A | 21332 | 19120 | 1464 | 1464 | 6.86% | 7.66% | 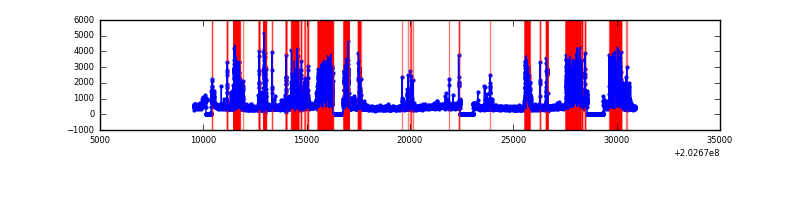 |
| B | 21332 | 19121 | 262 | 262 | 1.23% | 1.37% | 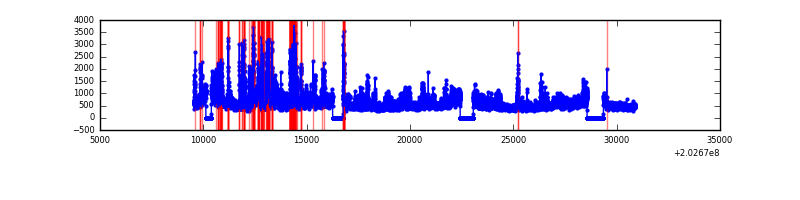 |
| C | 21332 | 19121 | 13 | 13 | 0.06% | 0.07% | 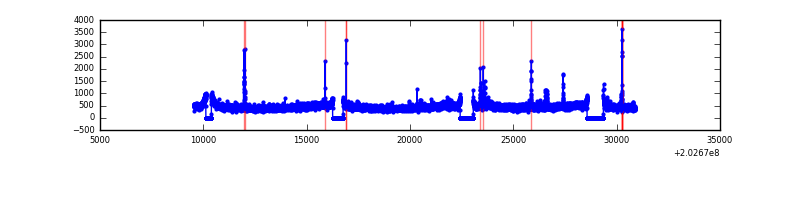 |
| D | 21332 | 19121 | 625 | 625 | 2.93% | 3.27% | 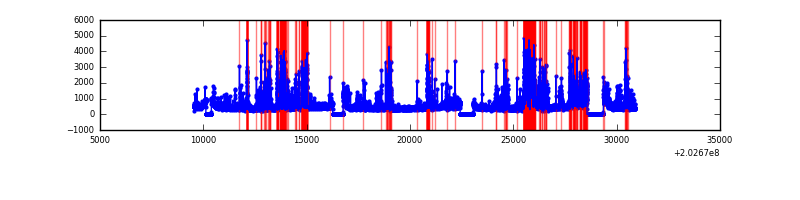 |
Top three noisy pixels from each quadrant. If the there are fewer than three noisy pixels in the level2.evt file, extra rows are filled as -1
| Pixel properties | Quadrant properties | ||||||
|---|---|---|---|---|---|---|---|
| Quadrant | DetID | PixID | Counts | Sigma | Mean | Median | Sigma |
| A | 13 | 251 | 5068195 | 11810.15 | 2094 | 2047 | 429.0 |
| A | 0 | 50 | 83119 | 188.99 | 2094 | 2047 | 429.0 |
| A | 13 | 164 | 70341 | 159.21 | 2094 | 2047 | 429.0 |
| B | 14 | 167 | 1259225 | 2922.62 | 2218 | 2162 | 430.1 |
| B | 15 | 204 | 1042283 | 2418.24 | 2218 | 2162 | 430.1 |
| B | 5 | 70 | 758470 | 1758.38 | 2218 | 2162 | 430.1 |
| C | 2 | 53 | 204845 | 404.31 | 2149 | 2156 | 501.3 |
| C | 9 | 247 | 63241 | 121.85 | 2149 | 2156 | 501.3 |
| C | 1 | 16 | 45395 | 86.25 | 2149 | 2156 | 501.3 |
| D | 13 | 223 | 2043492 | 4003.63 | 2103 | 2039 | 509.9 |
| D | 9 | 35 | 748997 | 1464.91 | 2103 | 2039 | 509.9 |
| D | 13 | 239 | 403452 | 787.24 | 2103 | 2039 | 509.9 |
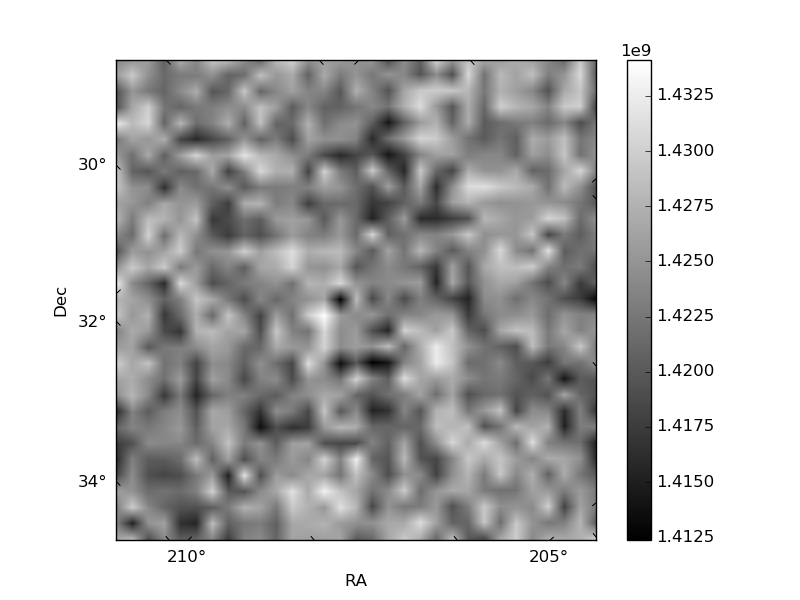
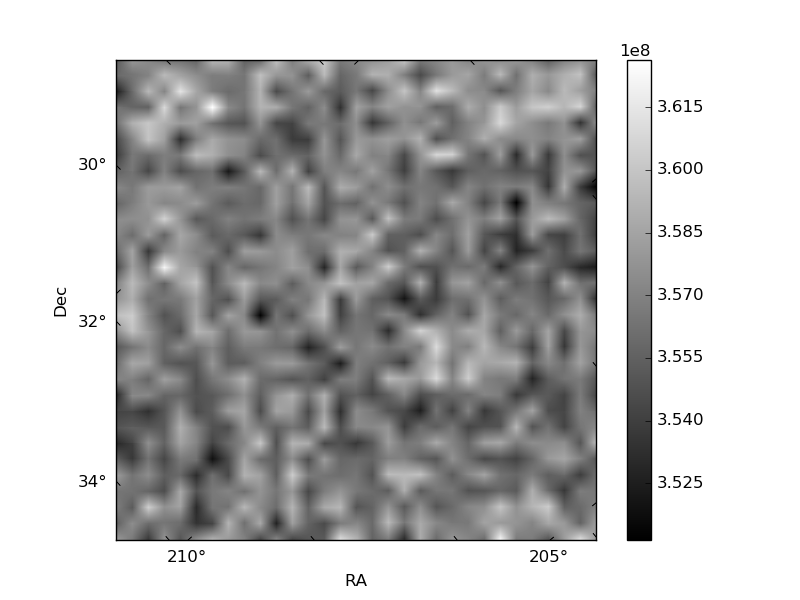
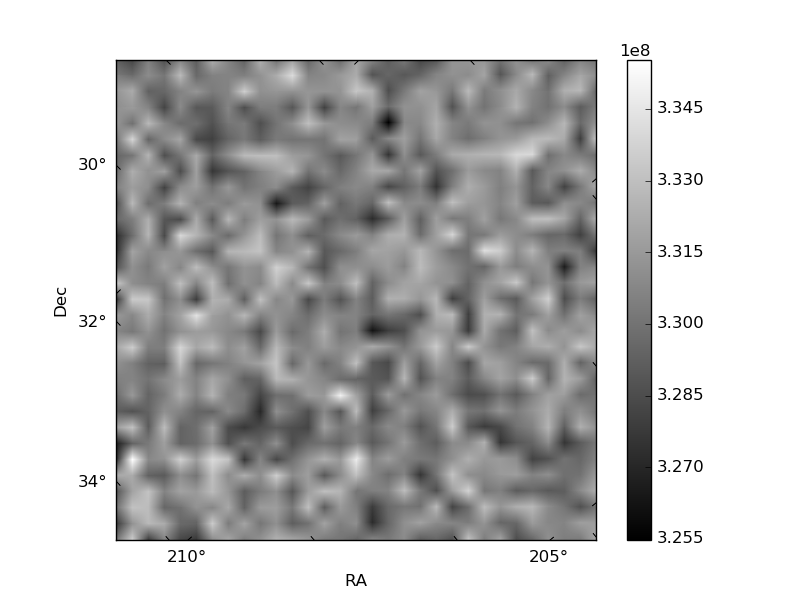
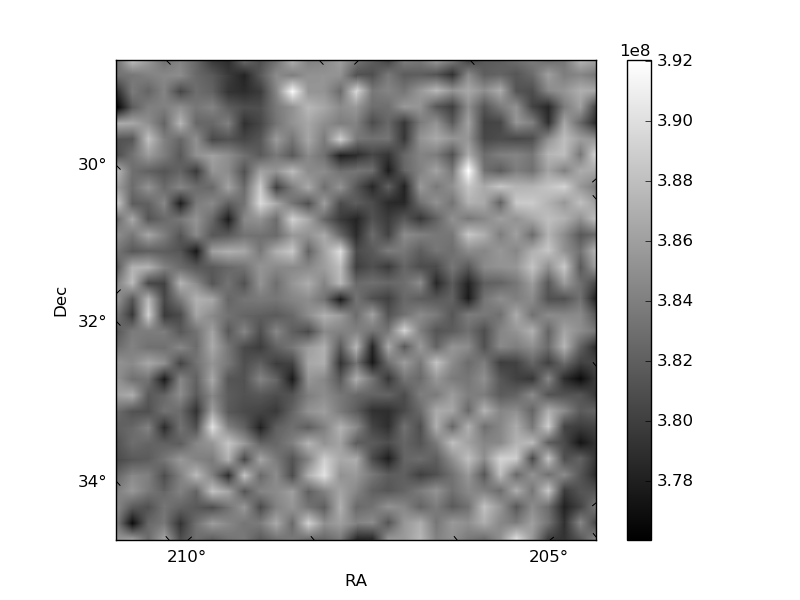
Histogram calculated using DETX and DETY for each event in the final _common_clean file
| Quadrant A | 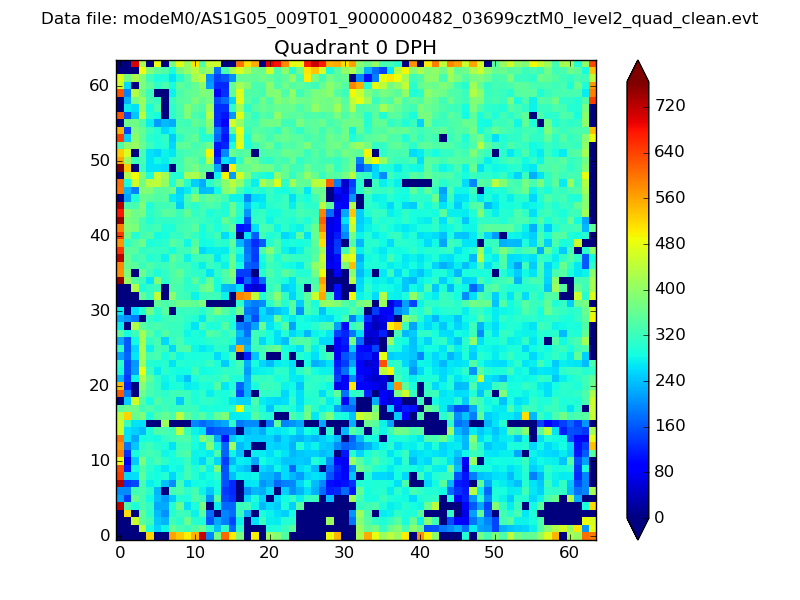 |
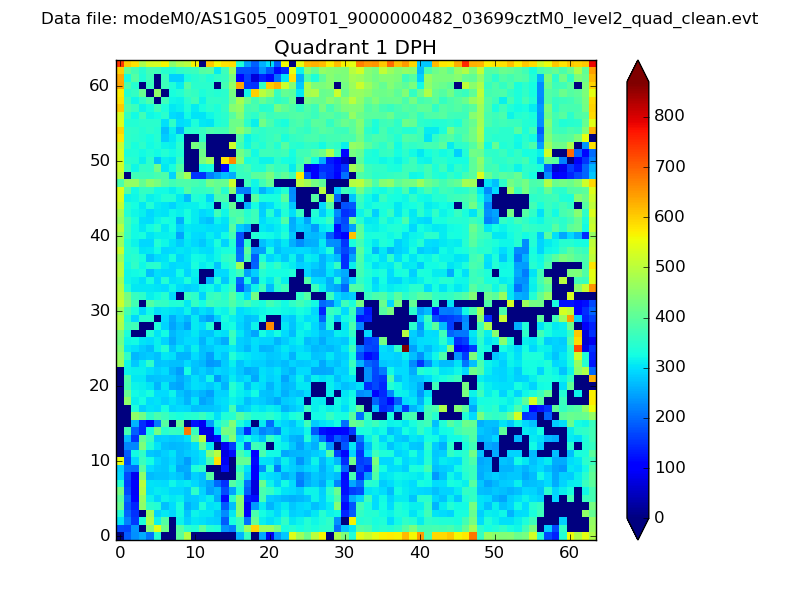 |
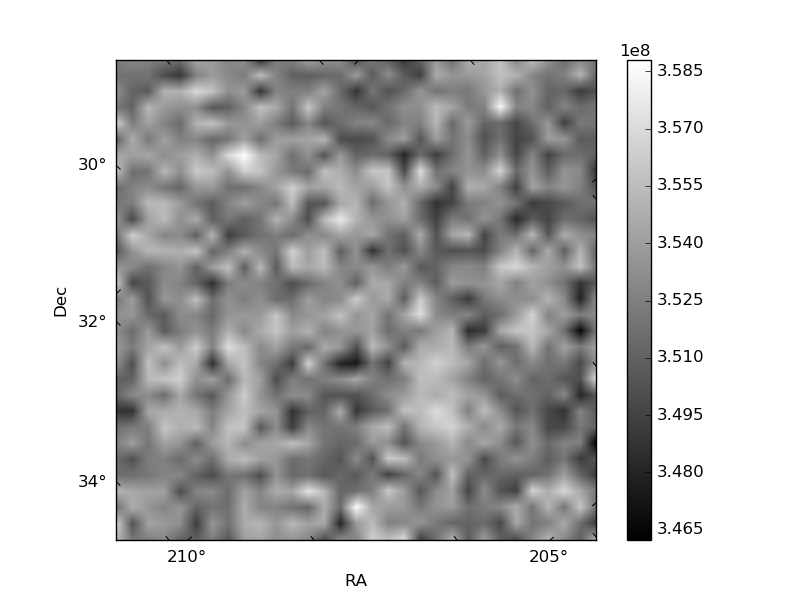
Quadrant B |
|---|---|---|---|
| Quadrant D | 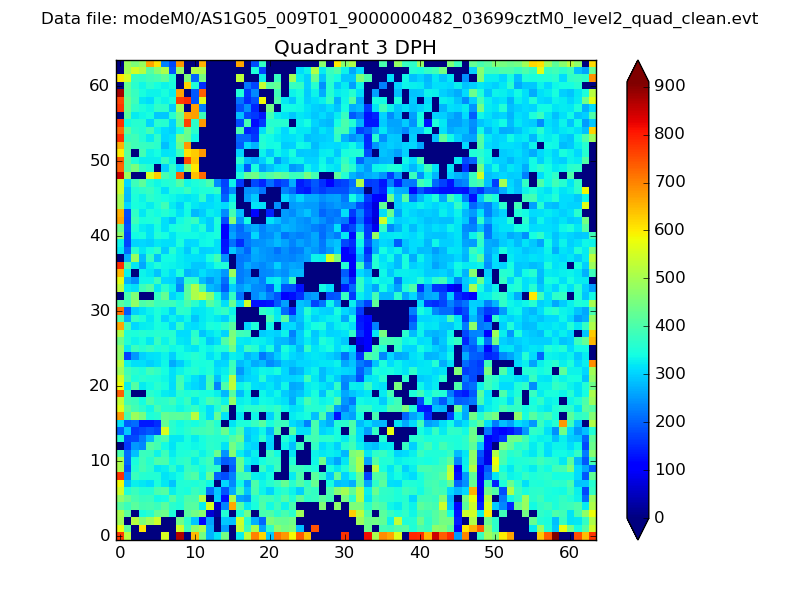 |
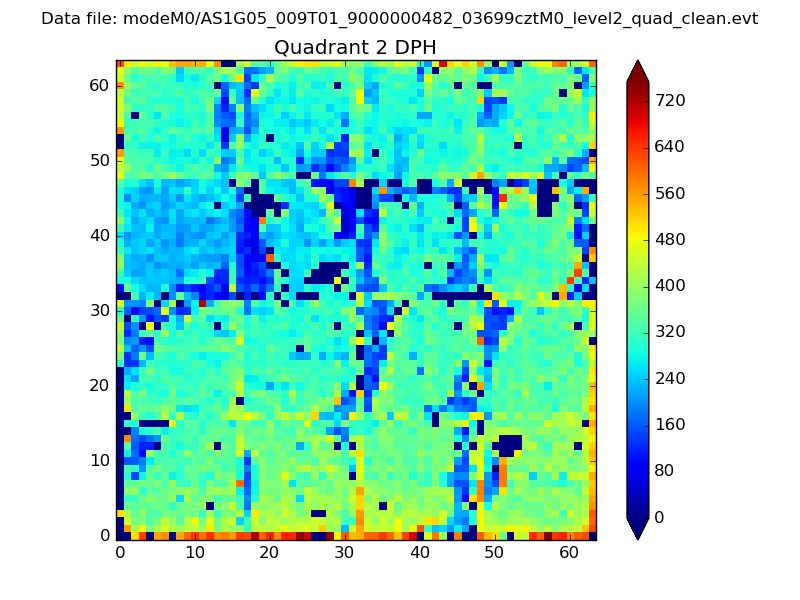 |
Quadrant C |
| Plot type | Count rate plots | Images |
|---|---|---|
| Comparison with Poisson distribution Blue bars denote a histogram of data divided into 1 sec bins. Red curve is a Poisson curve with rate = median count rate of data. |
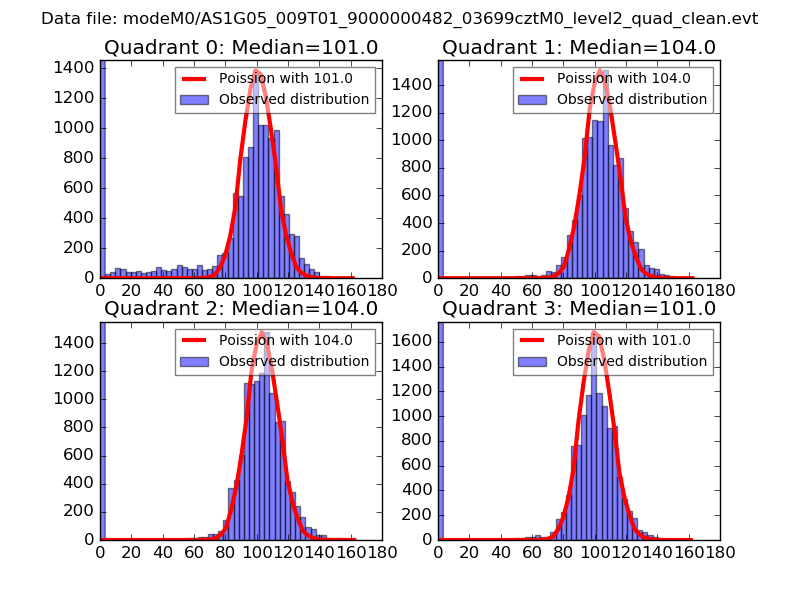 |
 |
| Quadrant-wise count rates Data is divided into 100 sec bins |
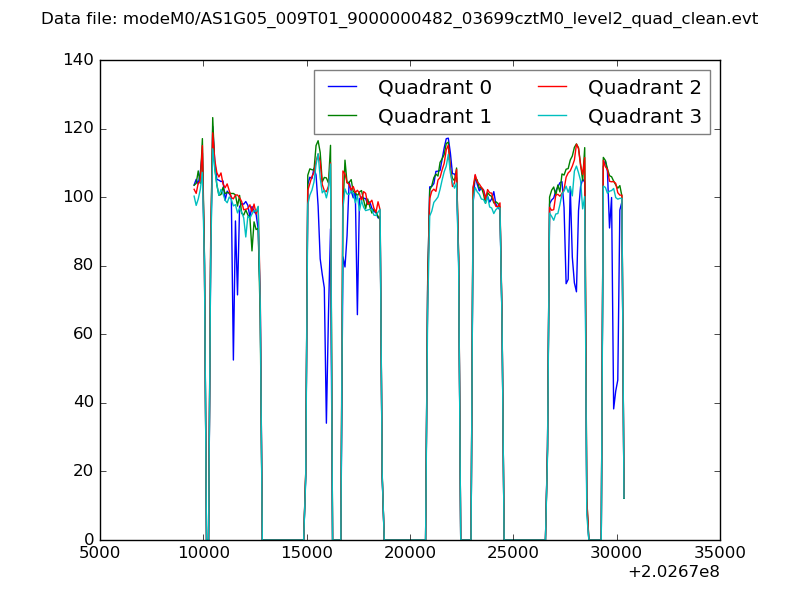 |
|
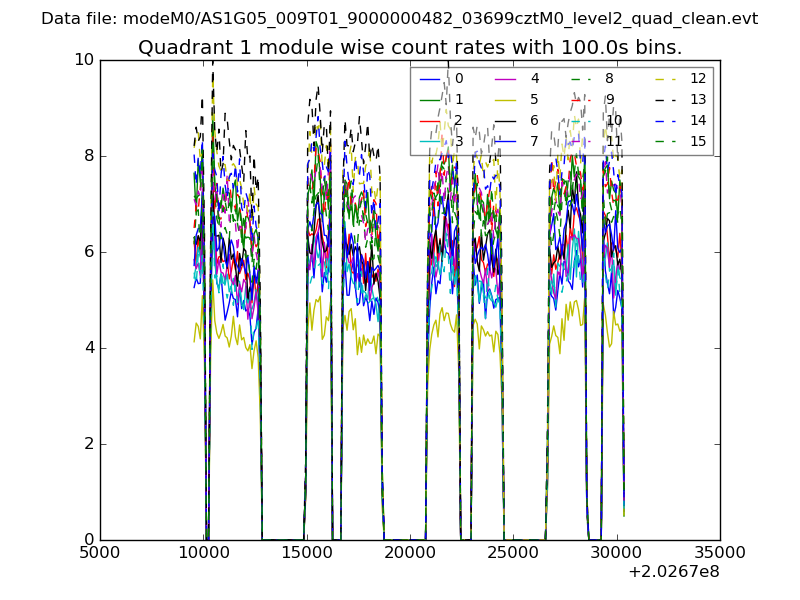
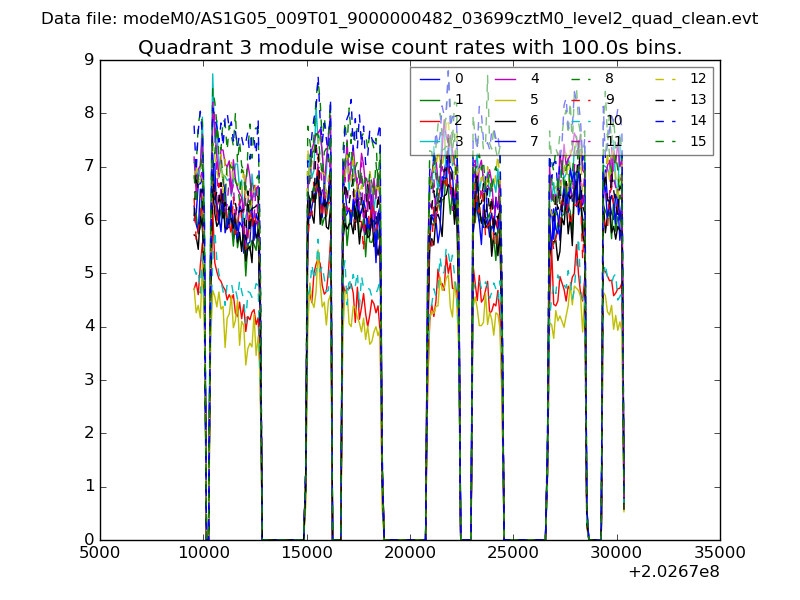
| Module-wise count rates for Quadrant A Data is divided into 100 sec bins |
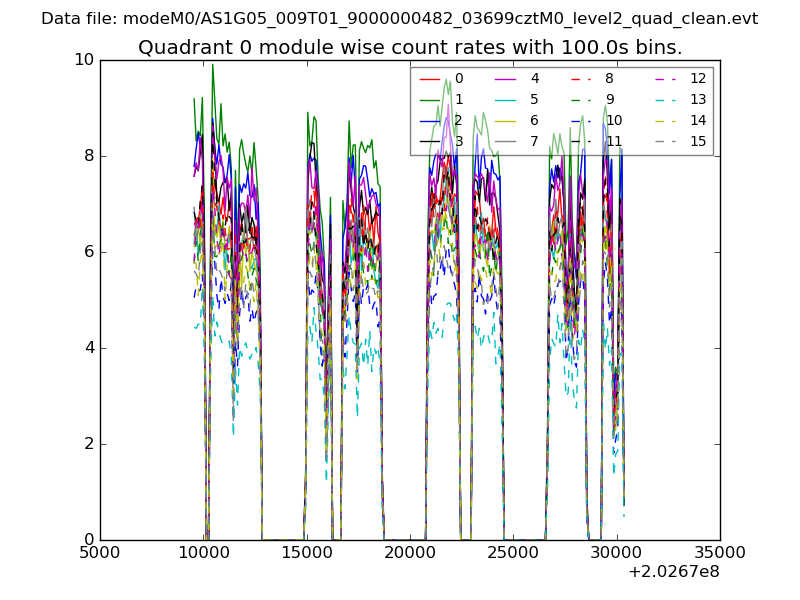 |
 |
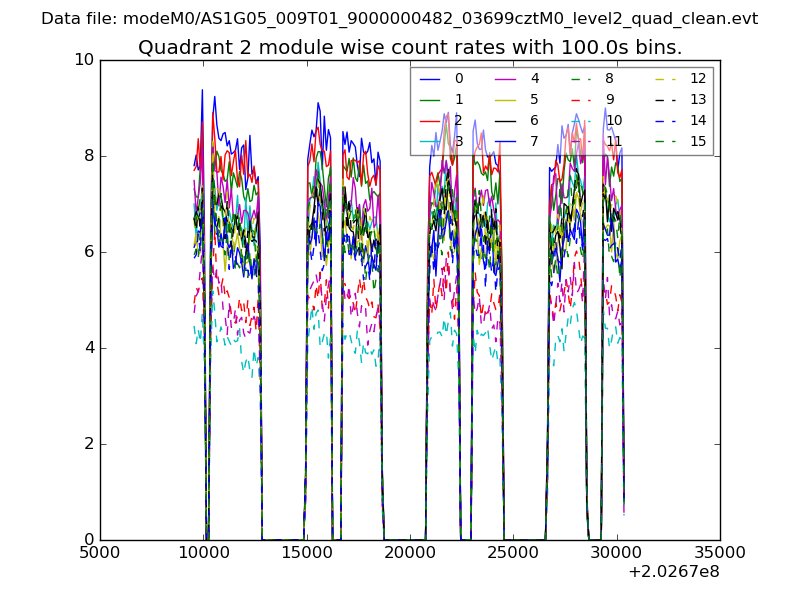
| Module-wise count rates for Quadrant B Data is divided into 100 sec bins |
 |
 |
| Module-wise count rates for Quadrant C Data is divided into 100 sec bins |
 |
 |
| Module-wise count rates for Quadrant D Data is divided into 100 sec bins |
 |
 |
| Parameter | Plot |
|---|---|
| CZT HV Monitor | 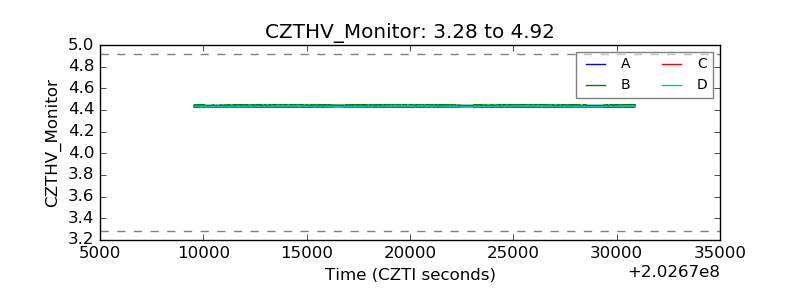 |
| D_VDD | 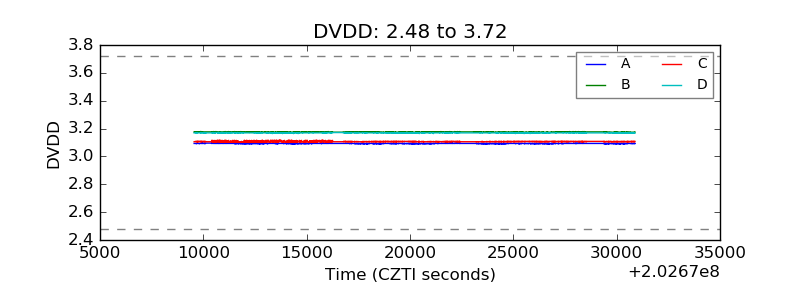 |
| Temperature 1 | 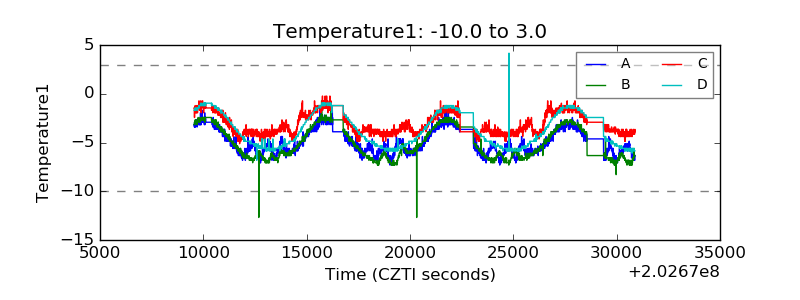 |
| Veto HV Monitor | 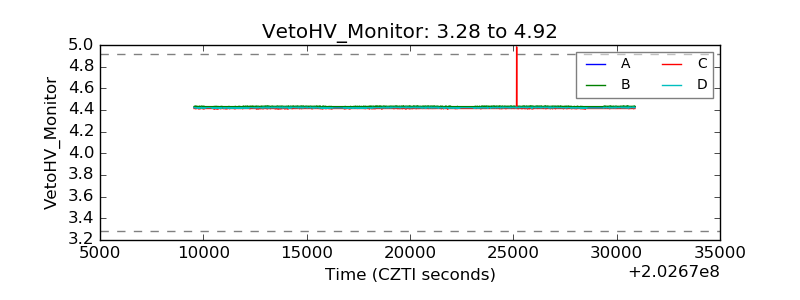 |
| Veto LLD | 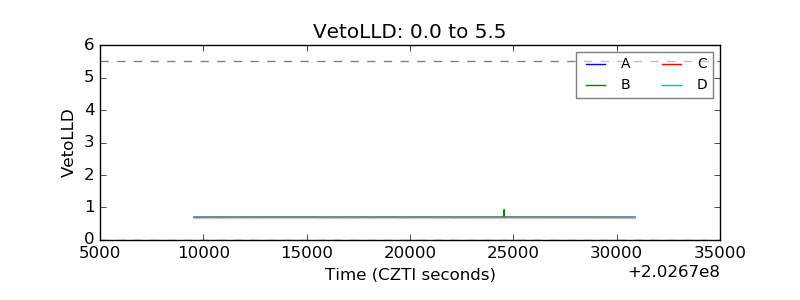 |
| Alpha Counter | 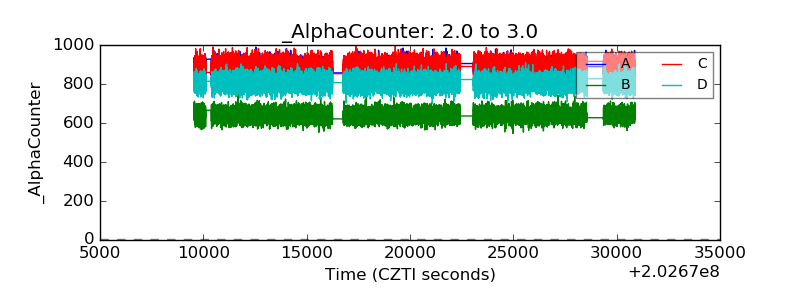 |
| _CPM_Rate | 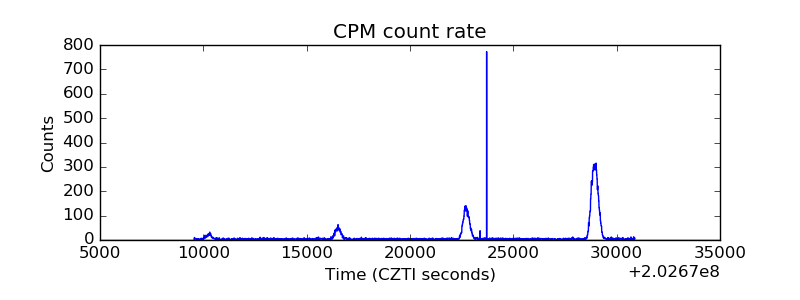 |
| CZT Counter | 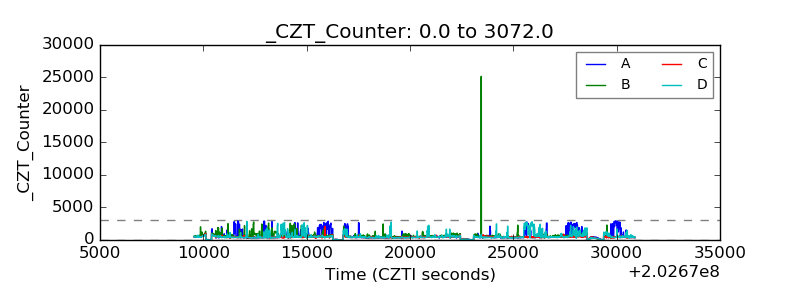 |
| +2.5 Volts monitor |  |
| +5 Volts monitor |  |
| Veto Counter | 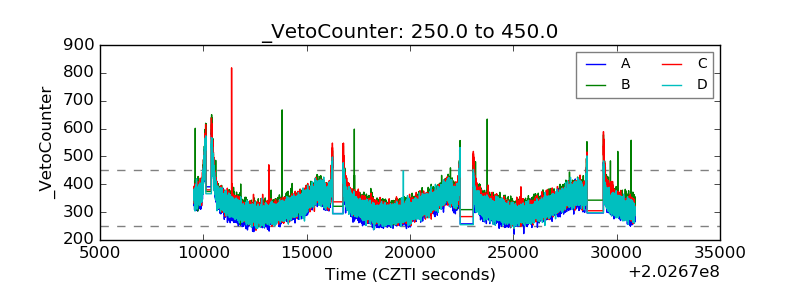 |