| Param | Original file | Final file |
|---|---|---|
| Filename | modeM0/AS1G05_009T01_9000000482_03700cztM0_level2.evt | modeM0/AS1G05_009T01_9000000482_03700cztM0_level2_quad_clean.evt |
| Size (bytes) | 519,742,080 | 64,923,840 |
| Size | 495.7 MB | 61.9 MB |
| Events in quadrant A | 4,387,972 | 364,237 |
| Events in quadrant B | 3,572,071 | 389,787 |
| Events in quadrant C | 2,931,855 | 384,155 |
| Events in quadrant D | 4,398,098 | 364,286 |
| Mode M9 | |||
|---|---|---|---|
| Quadrant | BADHDUFLAG | Total packets | Discarded packets |
| A | 0 | 9 | 0 |
| B | 0 | 9 | 0 |
| C | 0 | 9 | 0 |
| D | 0 | 9 | 0 |
| Mode SS | |||
|---|---|---|---|
| Quadrant | BADHDUFLAG | Total packets | Discarded packets |
| A | 0 | 136 | 0 |
| B | 0 | 136 | 0 |
| C | 0 | 136 | 0 |
| D | 0 | 136 | 0 |
| Mode M0 | |||
|---|---|---|---|
| Quadrant | BADHDUFLAG | Total packets | Discarded packets |
| A | 0 | 17520 | 2 |
| B | 0 | 14856 | 1 |
| C | 0 | 13448 | 1 |
| D | 0 | 17847 | 1 |
| Quadrant | Total seconds | Saturated seconds | Saturation percentage |
|---|---|---|---|
| A | 6634 | 393 | 5.924028% |
| B | 6634 | 65 | 0.979801% |
| C | 6634 | 18 | 0.271330% |
| D | 6634 | 240 | 3.617727% |
Noise dominated data is calculated using 1-second bins in cleaned event files. If a bin has >2000 counts, and if more than 50% of those come from <1% of pixels, then it is considered to be noise-dominated and hence unusable.
| Quadrant | # 1 sec bins | Bins with >0 counts | Bins with >2000 counts | High rate bins dominated by noise | Noise dominated (total time) | Noise dominated (detector-on time) | Marked lightcurve |
|---|---|---|---|---|---|---|---|
| A | 7589 | 6635 | 317 | 317 | 4.18% | 4.78% | 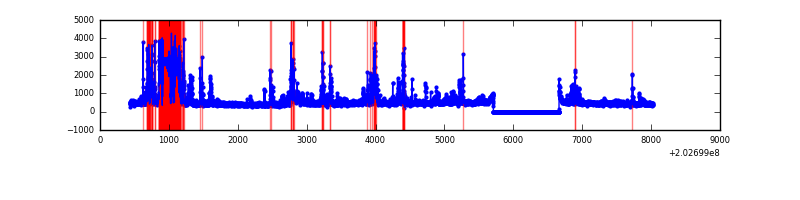 |
| B | 7589 | 6635 | 13 | 13 | 0.17% | 0.20% | 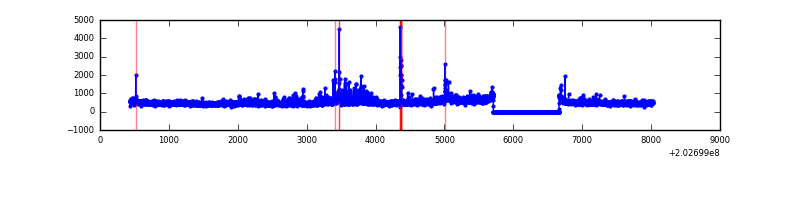 |
| C | 7589 | 6635 | 5 | 5 | 0.07% | 0.08% | 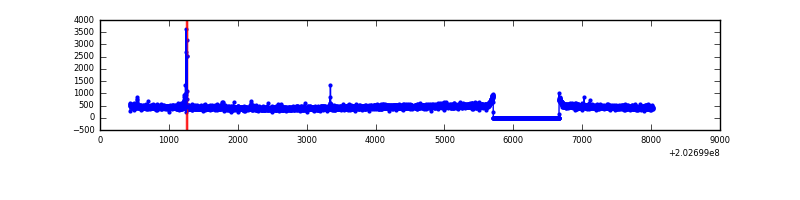 |
| D | 7589 | 6635 | 209 | 209 | 2.75% | 3.15% | 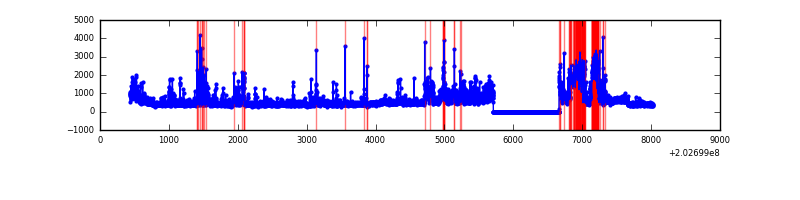 |
Top three noisy pixels from each quadrant. If the there are fewer than three noisy pixels in the level2.evt file, extra rows are filled as -1
| Pixel properties | Quadrant properties | ||||||
|---|---|---|---|---|---|---|---|
| Quadrant | DetID | PixID | Counts | Sigma | Mean | Median | Sigma |
| A | 13 | 251 | 1392862 | 9115.24 | 738 | 722 | 152.7 |
| A | 13 | 164 | 112663 | 732.95 | 738 | 722 | 152.7 |
| A | 3 | 1 | 13177 | 81.55 | 738 | 722 | 152.7 |
| B | 15 | 204 | 183615 | 1211.18 | 771 | 751 | 151.0 |
| B | 0 | 173 | 130623 | 860.19 | 771 | 751 | 151.0 |
| B | 0 | 219 | 106410 | 699.82 | 771 | 751 | 151.0 |
| C | 1 | 16 | 28625 | 159.64 | 740 | 743 | 174.7 |
| C | 2 | 53 | 9928 | 52.59 | 740 | 743 | 174.7 |
| C | 13 | 61 | 6300 | 31.82 | 740 | 743 | 174.7 |
| D | 9 | 35 | 1361231 | 7758.96 | 726 | 707 | 175.3 |
| D | 13 | 239 | 115859 | 656.7 | 726 | 707 | 175.3 |
| D | 1 | 84 | 55657 | 313.37 | 726 | 707 | 175.3 |
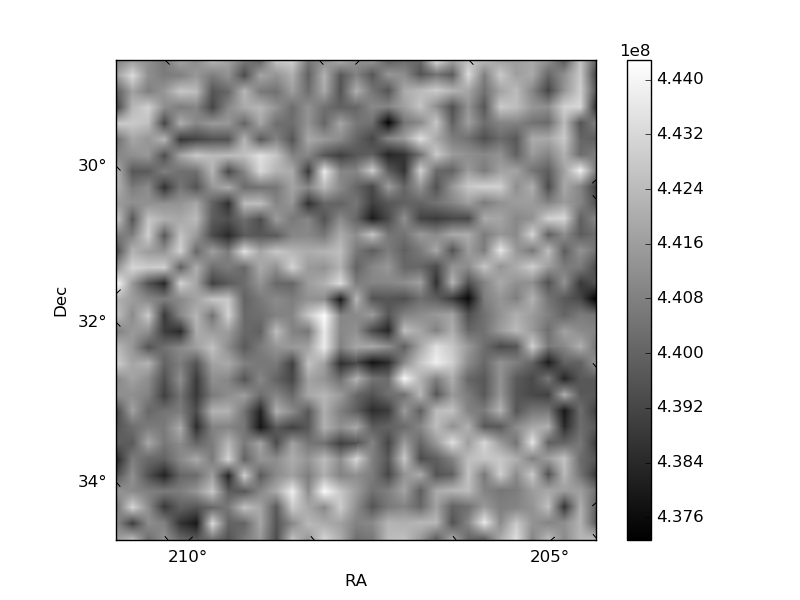
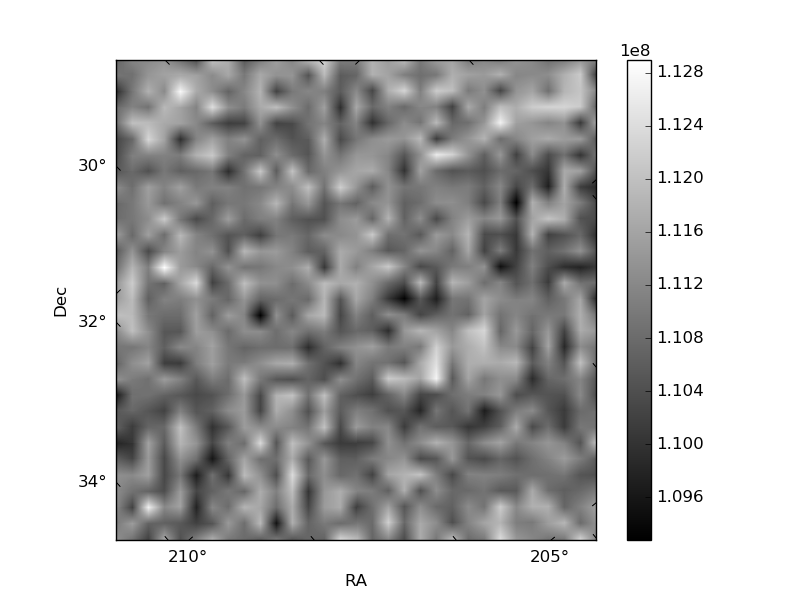
Histogram calculated using DETX and DETY for each event in the final _common_clean file
| Quadrant A | 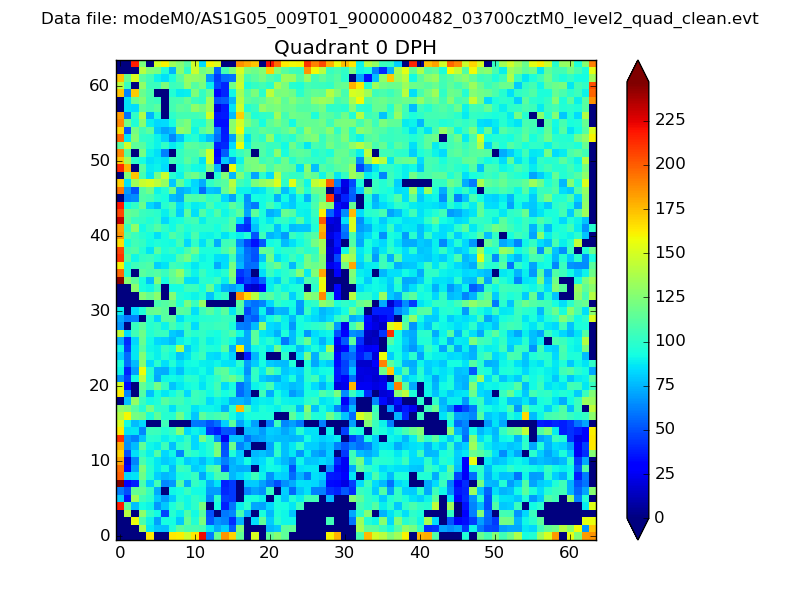 |
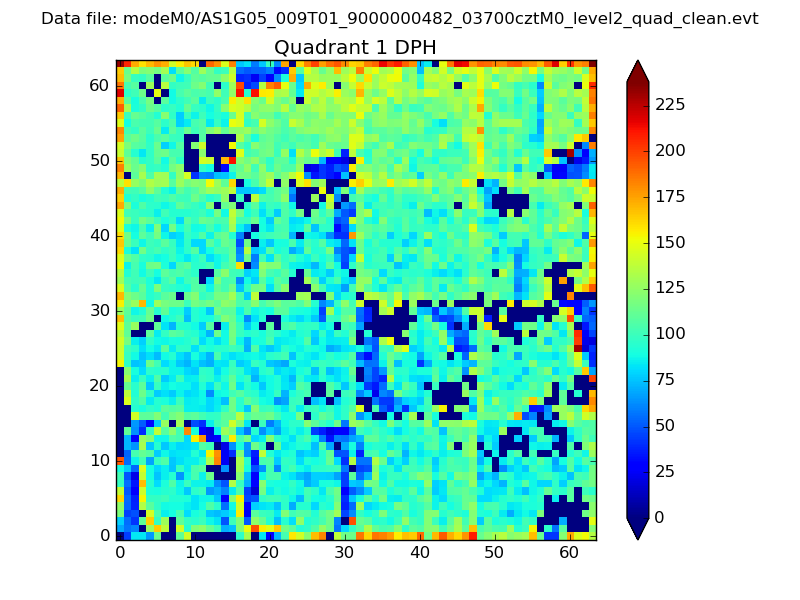 |
Quadrant B |
|---|---|---|---|
| Quadrant D | 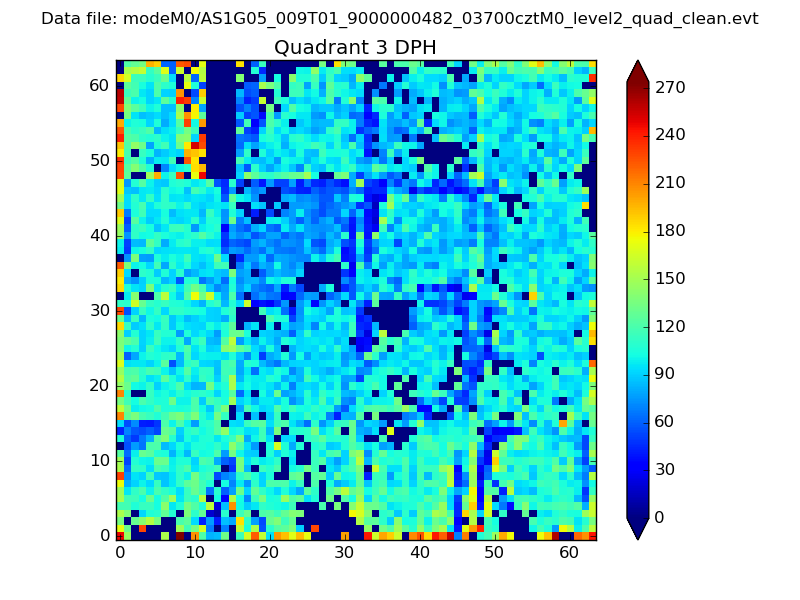 |
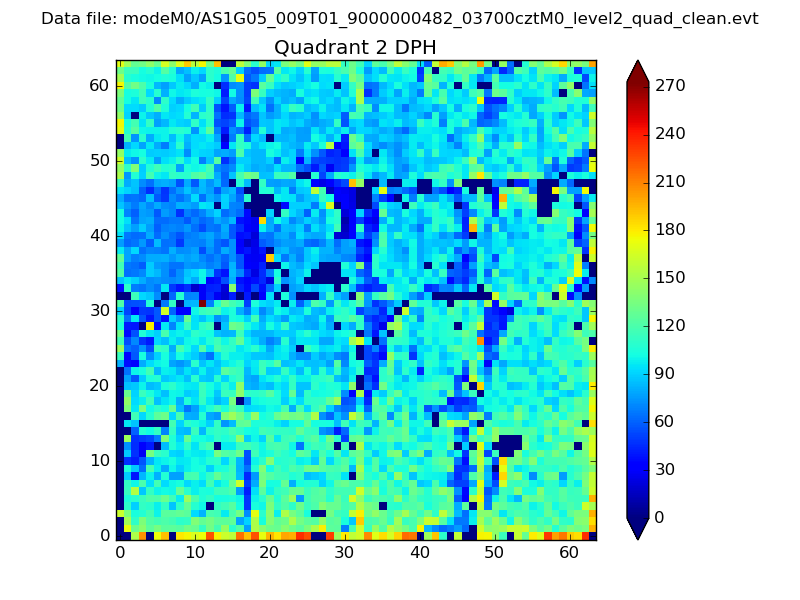 |
Quadrant C |
| Plot type | Count rate plots | Images |
|---|---|---|
| Comparison with Poisson distribution Blue bars denote a histogram of data divided into 1 sec bins. Red curve is a Poisson curve with rate = median count rate of data. |
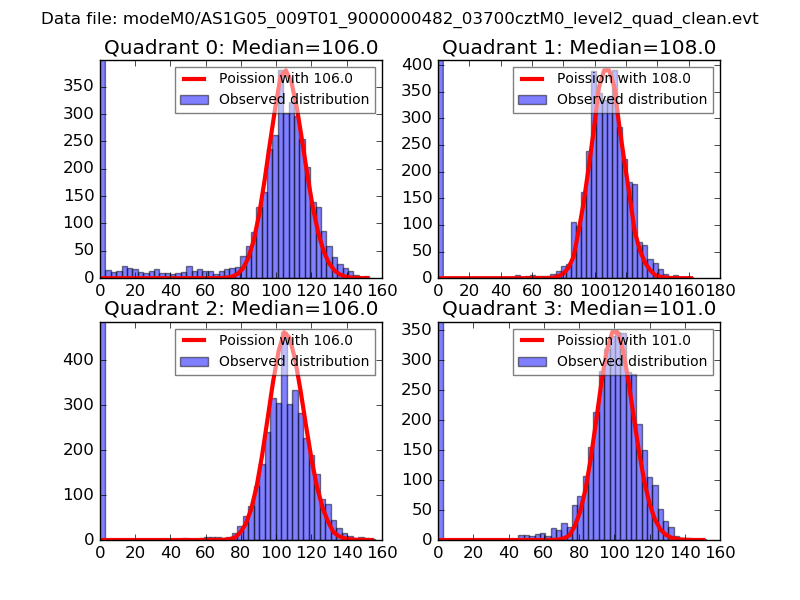 |
 |
| Quadrant-wise count rates Data is divided into 100 sec bins |
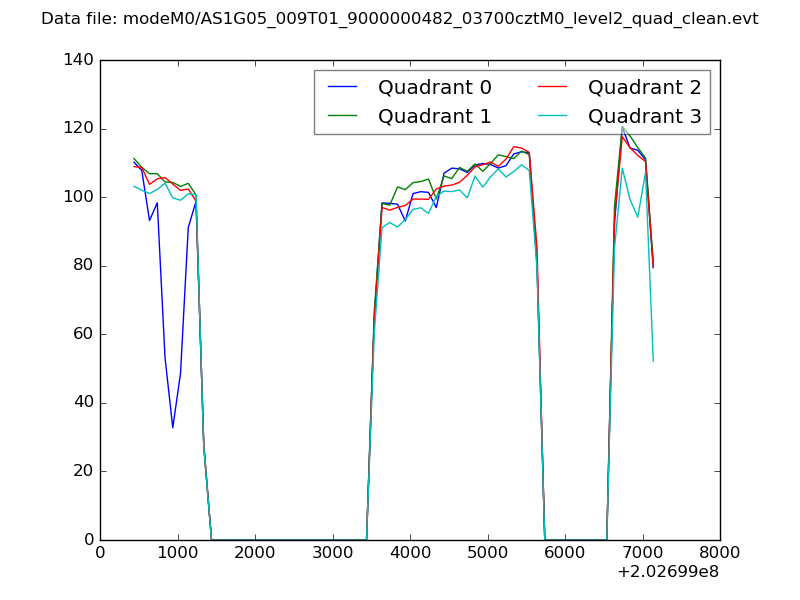 |
|
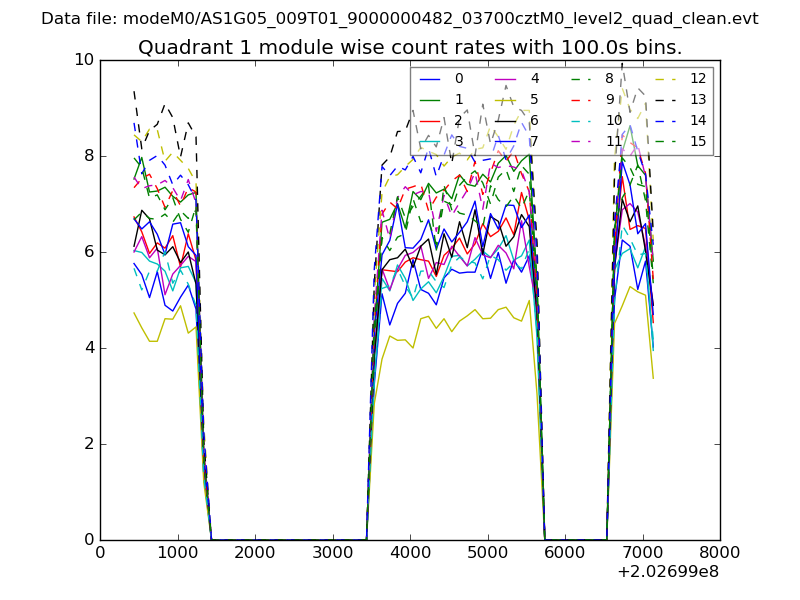
| Module-wise count rates for Quadrant A Data is divided into 100 sec bins |
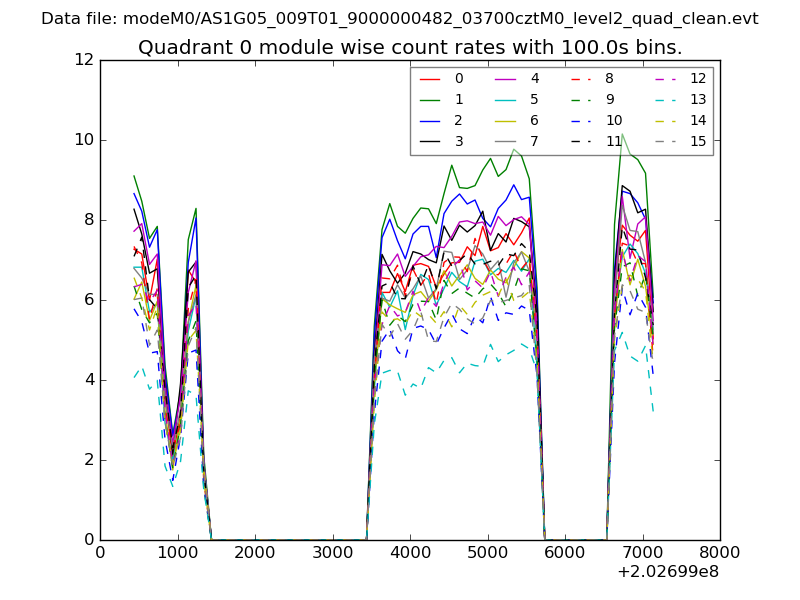 |
 |
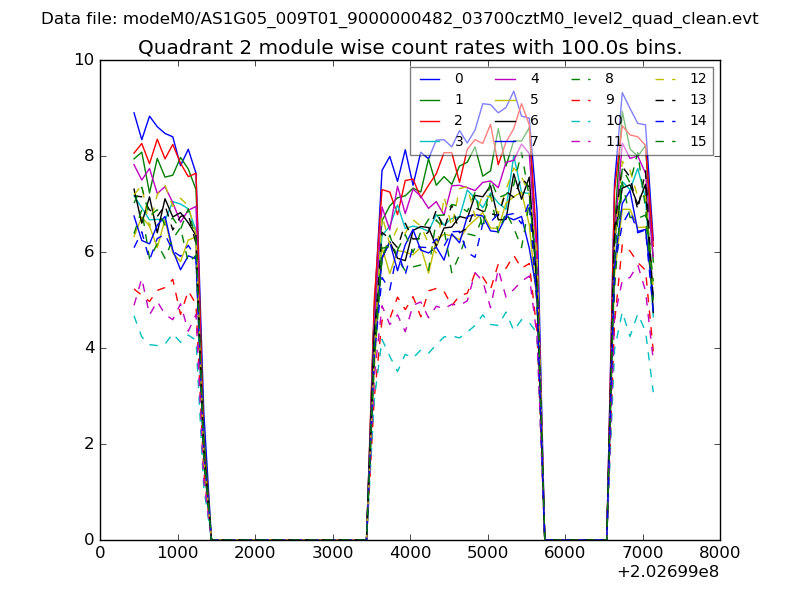
| Module-wise count rates for Quadrant B Data is divided into 100 sec bins |
 |
 |
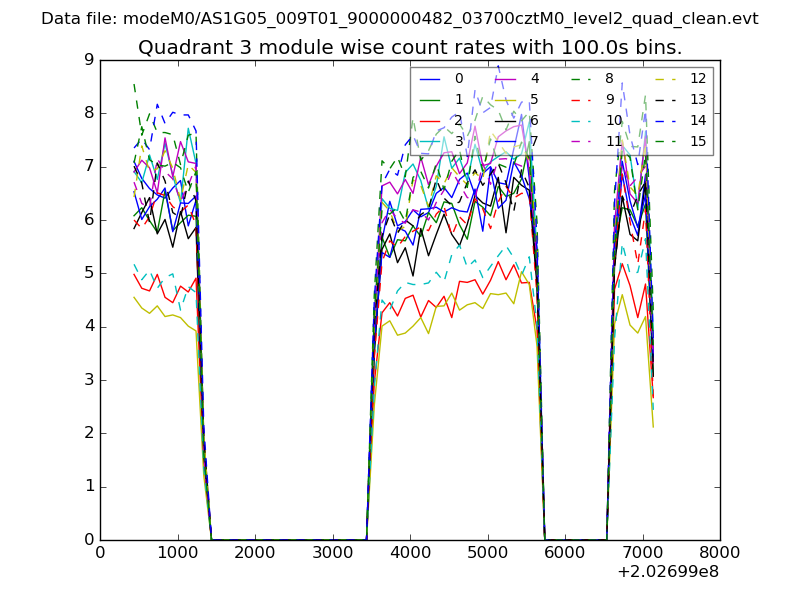
| Module-wise count rates for Quadrant C Data is divided into 100 sec bins |
 |
 |
| Module-wise count rates for Quadrant D Data is divided into 100 sec bins |
 |
 |
| Parameter | Plot |
|---|---|
| CZT HV Monitor | 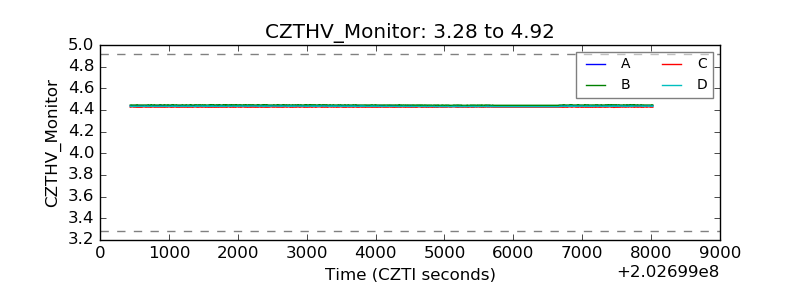 |
| D_VDD | 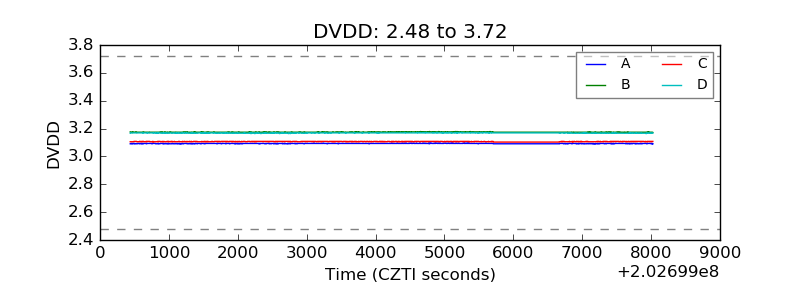 |
| Temperature 1 | 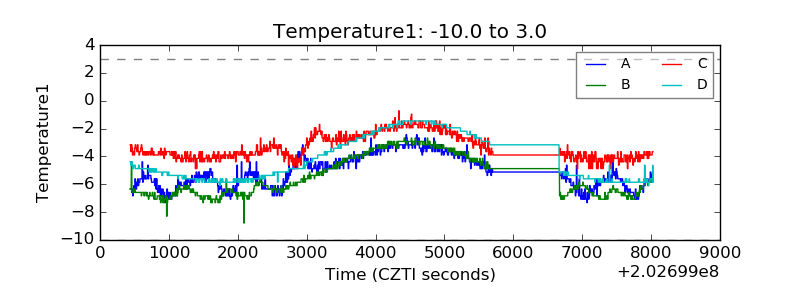 |
| Veto HV Monitor | 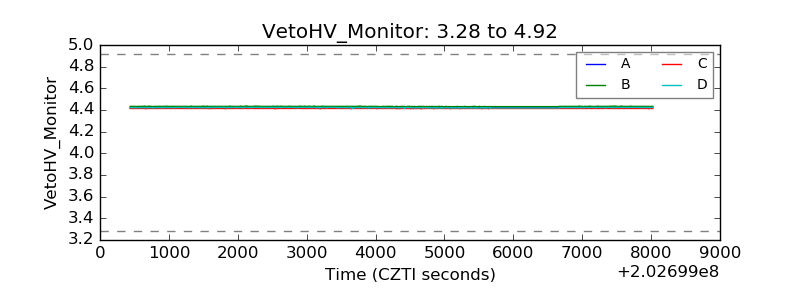 |
| Veto LLD | 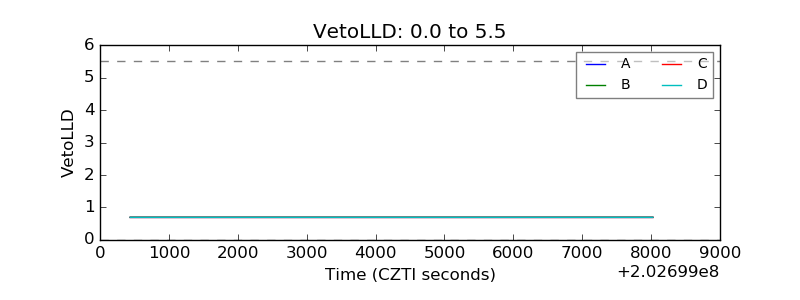 |
| Alpha Counter | 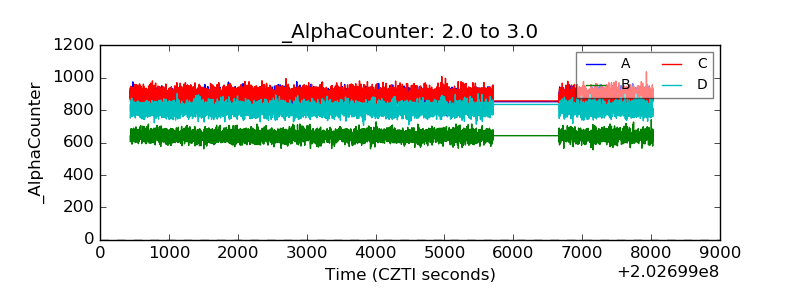 |
| _CPM_Rate | 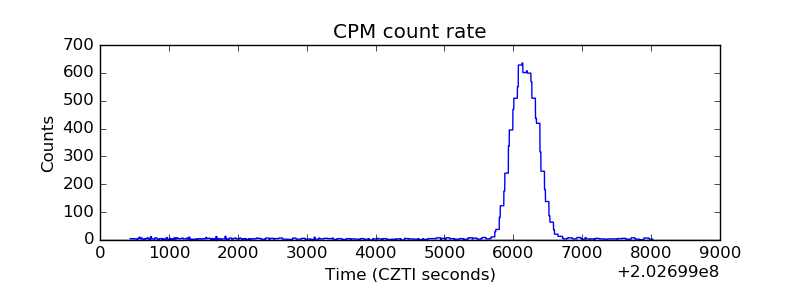 |
| CZT Counter |  |
| +2.5 Volts monitor |  |
| +5 Volts monitor |  |
| Veto Counter | 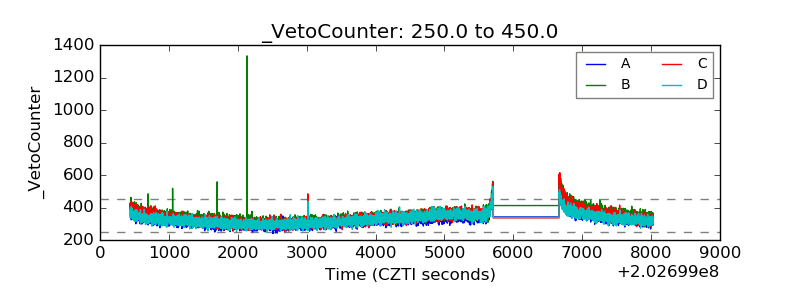 |